2878
Short-term Fourier Transform Analysis of Respiratory- and Cardiac-driven Pulsation of Cerebrospinal Fluid under Free Breathing1Cource of Electrical and Electric Engineering, Guraduate School of Engineering, Tokai University, Hiratsuka, Kanagawa, Japan, 2Guraduate School of Information Science and Technology, Tokai University, Hiratsuka, Kanagawa, Japan, 3Department of Neurosurgery, Tokai University, Isehara, Kanagawa, Japan
Synopsis
To separate the respiratory- and cardiac-driven motions of cerebrospinal fluid (CSF) under free breathing, CSF velocity in 7 healthy volunteers and 3 hydrocephalus patients were observed by asynchronous phase contrast (PC) technique with monitoring respiratory and ECG signals. Spectrograms of CSF velocity and respiratory signal obtained by short-term Fourier transform (STFT) with 8-sec length Hamming window revealed that the peak respiratory motion appeared in 0-0.5 Hz band, while the cardiac motion appeared around 1-1.5 Hz. These results suggest that the separation of the two motion components is possible by sliding the frequency bands temporarily according to the spectrogram.
Introduction
Separation of respiratory- and cardiac- driven Cerebrospinal Fluid (CSF) pulsation is important for categorizing the pathological status of hydrocephalus. When breathing is controlled by an audio guidance for healthy volunteers, separation of the respiratory and cardiac components is possible in the frequency domain(1). Under free breathing, however the separation became problematic since the breathing frequency or period varies. In order to separate the two types motions under free breathing, frequency-temporal properties of the motions were analyzed by spectrogram approach.Method
Our institution’s review board approved this study. All volunteers were examined after we obtained appropriate informed consent. Asynchronous PC-MR images of the following conditions were acquired: TR, 6.0 msec; TE, 3.9 msec; flip angle, 10 degrees; slice thickness, 7 mm; matrix, 256×256; encode direction, FH; time resolution, 217 msec, SENSE factor; 4, and velocity encoding (VENC), 10 cm/sec. All volunteers and patients imaged by synchronous PC-MR images of 3 healthy volunteers under controlled of breathing (2 males (21yo, 22yo, 25yo), 1 female (25yo)), 3 healthy volunteers under free breathing (2 males (54yo, 48yo), 1 female (51yo)), and 3 patients of hydrocephalus (1 male (74yo), 2 females (30yo, 70yo)) were examined with a 3T-MRI (Ingenia, Philips). Respiratory signals obtained from MR correspondence pressure sensor. The CSF velocity plotted against both Cardiac- and Respiratory- signals to seize the overall behavior of the motion. STFT with hamming window function applied to the CSF velocity waveforms and respiratory signals of all volunteers and patients. A hamming window with 3 to 10sec with 1 sec steps and 10 to 16 sec with 2sec steps were used to the CSF velocity. The window was then shifted for 1 % of its length with 99% overlap with the adjacent window position. Furthermore, STFT with 8sec window width applied to CSF velocity waveforms and respiratory signals of all volunteers and patients. More 0.7 Hz was set to 0 and a low pass filter was applied to the respiratory signals.Results
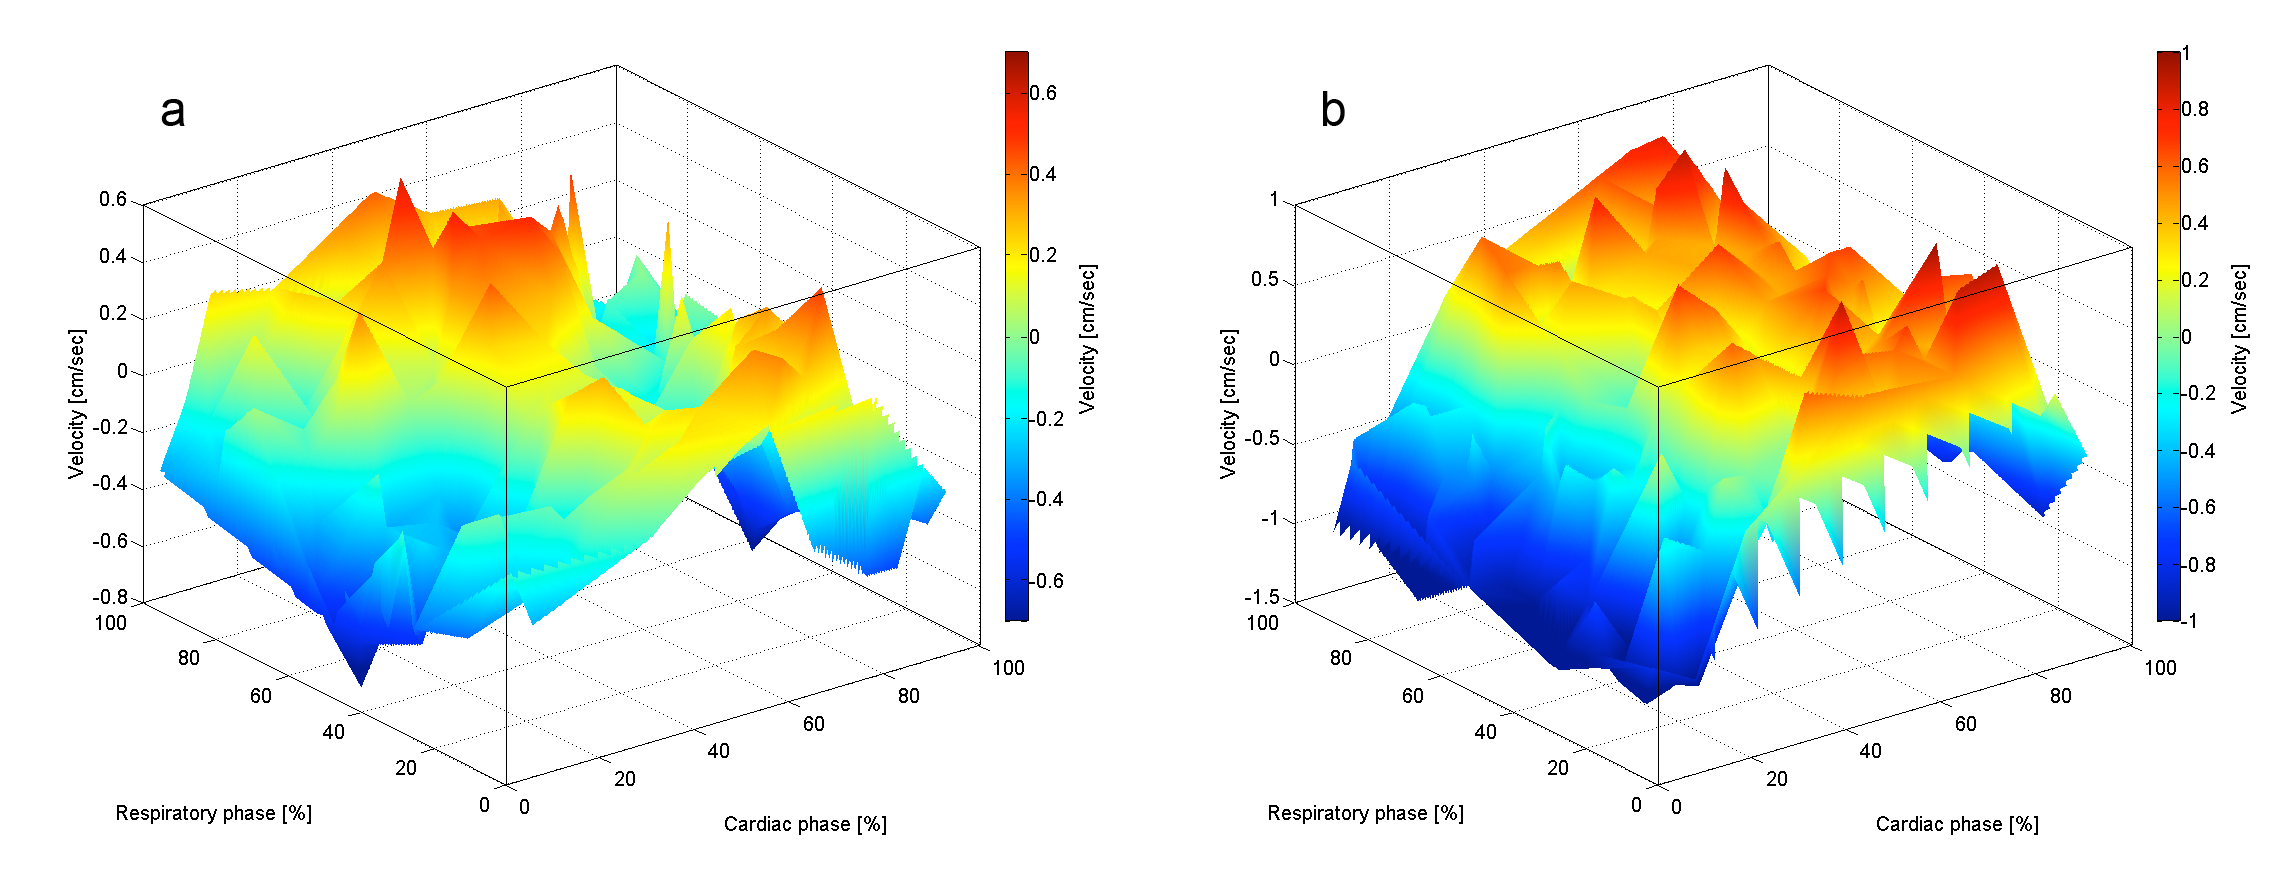
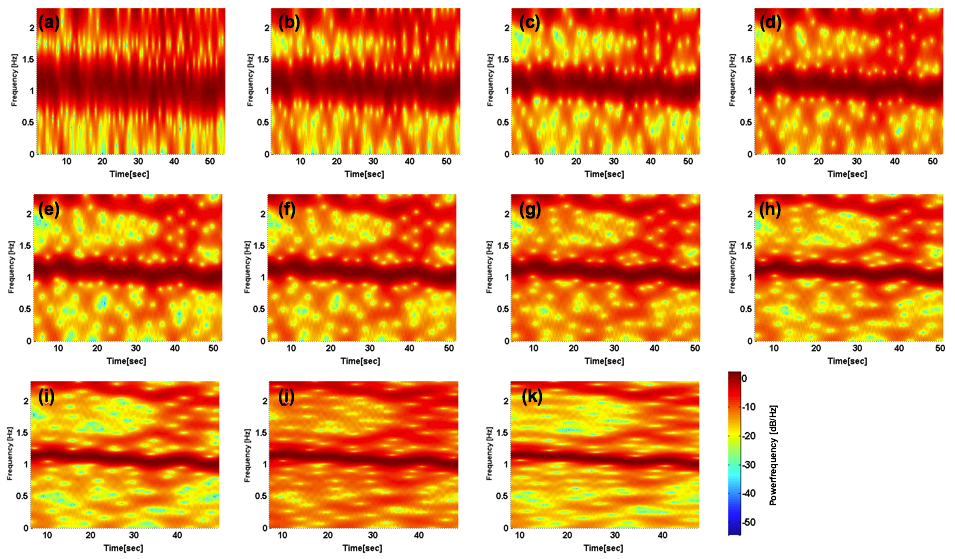
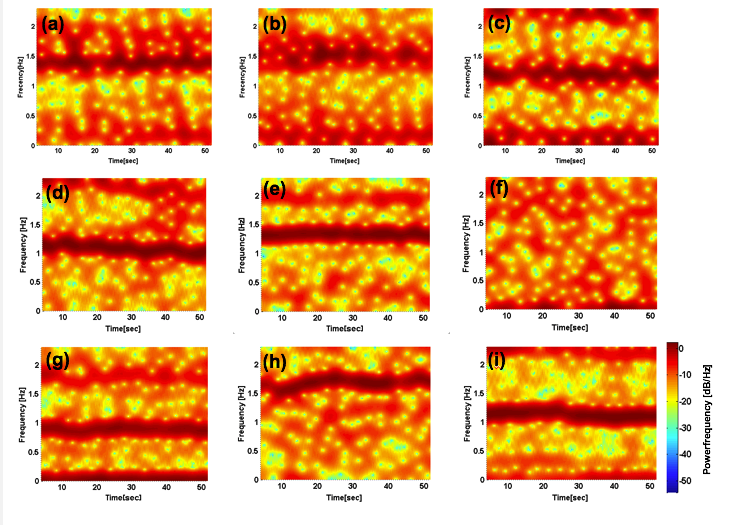
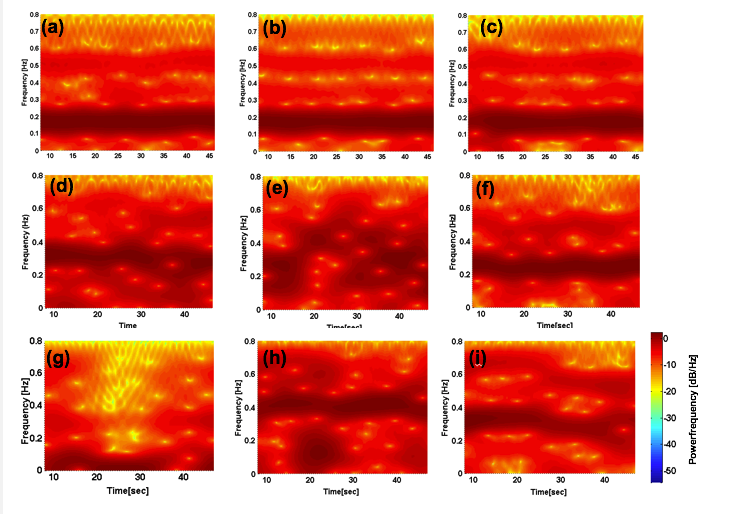
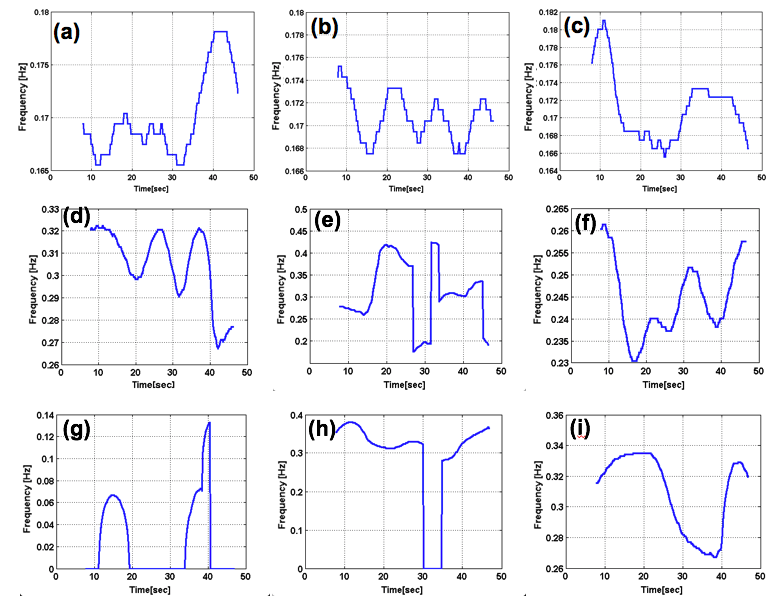
Figure 1 shows the overall behavior of the CSF motion relating to the cardiac pulsation and respiration. Spectrogram of the CSF velocity waveform with 3sec to 6sec (upper row), 7sec to 10sec (middle row) and 12sec to 16sec (bottom row) window functions are shown in Figure 2 for 1 volunteer. Spectrogram of CSF velocity waveform with 8sec window function width obtained for 3 healthy volunteers under controlled breathing (upper row), under free breathing (middle row), and patients (bottom row) are shown in Figure 3. Spectrogram of the respiratory waveform with 8sec window function width are shown in Figure 4 for controlled and free breathing volunteers and patients. The frequency plotting maximum value are shown in Figure 5.Discussion
Figure 1 (a) demonstrates that the CSF motion changes complicatedly even in the case of controlled respiration. In the case of free breathing the behavior look like small variation of the CSF velocity by the respiration. In Figure 2, the peaks from 1 Hz to 1.5Hz are cardiac signals. The more window function width extends, the more cardiac frequency bands narrow, because cardiac cycle usually steady. Most signals in (i-k) were averaged and there were no major changes. The other volunteers were similar results. Respiratory signal doesn’t appear in all spectrogram in Figure 3, because respiratory signal is weaker than cardiac and respiratory cycle is unstable. The reason why window function width set 8sec, because it covers from instantaneous breathing like cough to long breathing like deep breathing. In Figure 3 (f), it is not detected cardiac signals because CSF lumen is narrow and contains components of other tissues. Referring to the Figure 4 and Figure 5, respiratory peaks are present from 0.23 to 0.33 Hz in (d, e), and (i), and others exist from 0 to 0.5 Hz. Difference in respiratory band caused by several factors such as disturbed breathing and displacement of the bellows sensor due to body movement. In Figure 5 (g). this patient respiratory waveform has partial turbulence.Conclusion
To separate respiratory- and cardiac-driven CSF motion under free breathing, spectrogram analysis based on STFT seemed to be one of the possible techniques. In the future, the time domain window length has to be optimized for detecting both cardiac- and respiratory-driven components. Dynamic adjustment of the frequency band for detecting respiratory-driven component has to be examined.Acknowledgements
The authors thank Dr. Koichi Oshio, Prof, Kazuhiko Hamamoto, Prof. Osamu Uchida and Dr. Ken Takizawa for valuable discussions. The authors also thank Mr. Tomoaki Horie and Mr. Nao Kajihara for their great help in the volunteer experiments.References
1. Yatsushiro S. et al., Characterization of cardiac- and respiratory-driven cerebrospinal fluid motion based on asynchronous phase-contrast magnetic resonance imaging in volunteers. IEEE EMBC 2016;3867-3870.
2. Yildiz S. et al., Quantifying the Influence of Respiration and Cardiac Pulsations on Cerebrospinal Fluid Dynamics Using Real-Time Phase-Contrast MRI. J Magn Reson Imag 2017;46(2):431-439.
Figures