2876
Quality Assurance of physiologic signal measures in HCP resting state fMRI data1Radilogy, Cleveland Clinic, Cleveland, OH, United States
Synopsis
Recently, a physiological log file timing error with fMRI acquisition was fixed and physiologic data with corrected timing was uploaded to the WU-MINN human connectome project (HCP) cloud. While HCP preprocessing pipeline for resting state (rs-) and fMRI has been proposed, the physiologic noise correction sub-pipeline has not been established yet and the physiologic noise data has had less attention in HCP community. In this study, we investigate the quality of HCP physiologic data and propose a standard physiological noise quality assurance.
Introduction
The purpose of this study is to investigate which properties of physiologic data could predict the performance of the physiological noise correction in HCP rs-fMRI data, and which level of factors could be used as an outlier threshold for bad physiologic data.Method
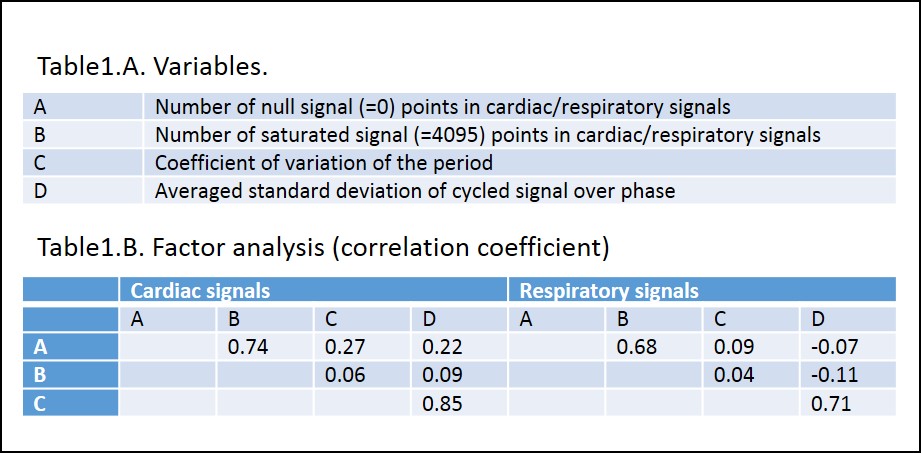
Two different phase encoding direction (RL or LR) rsfMRI data and corresponding physiological data were used from randomly selected 143 subjects in WU-MINN data set. Total 286 scans data with physiologic files were used. We monitored A) the number of nulled and B) saturated signal measures from the physiologic data. Then the physiologic data was processed using modified RetroTS.m (https://afni.nimh.nih.gov) to define each physiologic cycle by the detection of adjacent peaks. The periodicity time was calculated and C) its standard deviation divided by its mean (COV) was calculated, which represents the consistency of the physiologic periodicity. The repeated, normalized signals were resampled with 2π/50 window over the phase cycles, and D) the standard deviation (SD) of signals in each phase window was calculated and averaged, which represents the consistency of signals over phases. We calculated vowelwise F values of the second order Fourier series model (M=2, 4 each regressors) for cardiac and respiratory signals using RETROICOR [1]. The mean of the top highest 1% of F values was used for the output of the physiological noise correction performance.Result
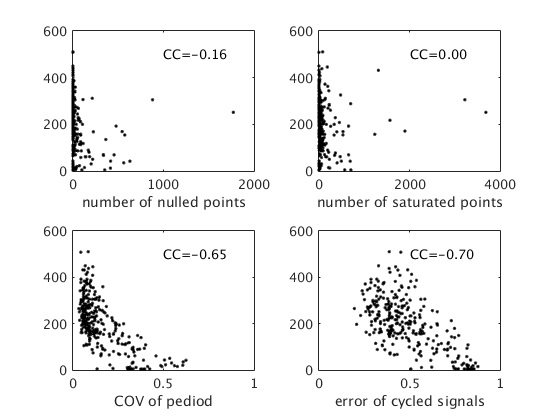
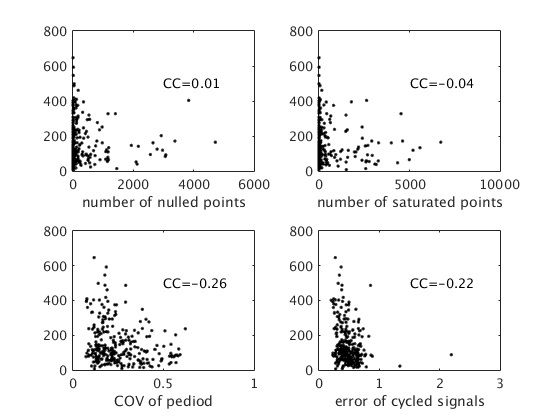
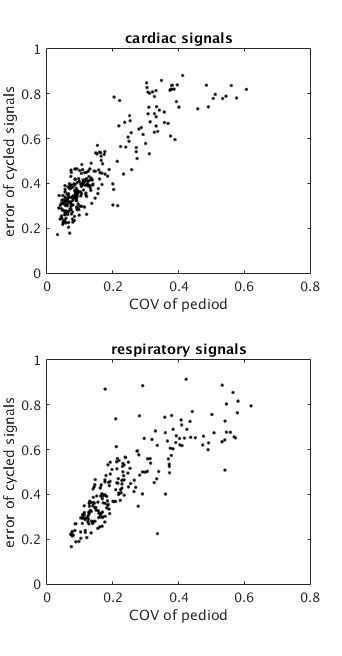
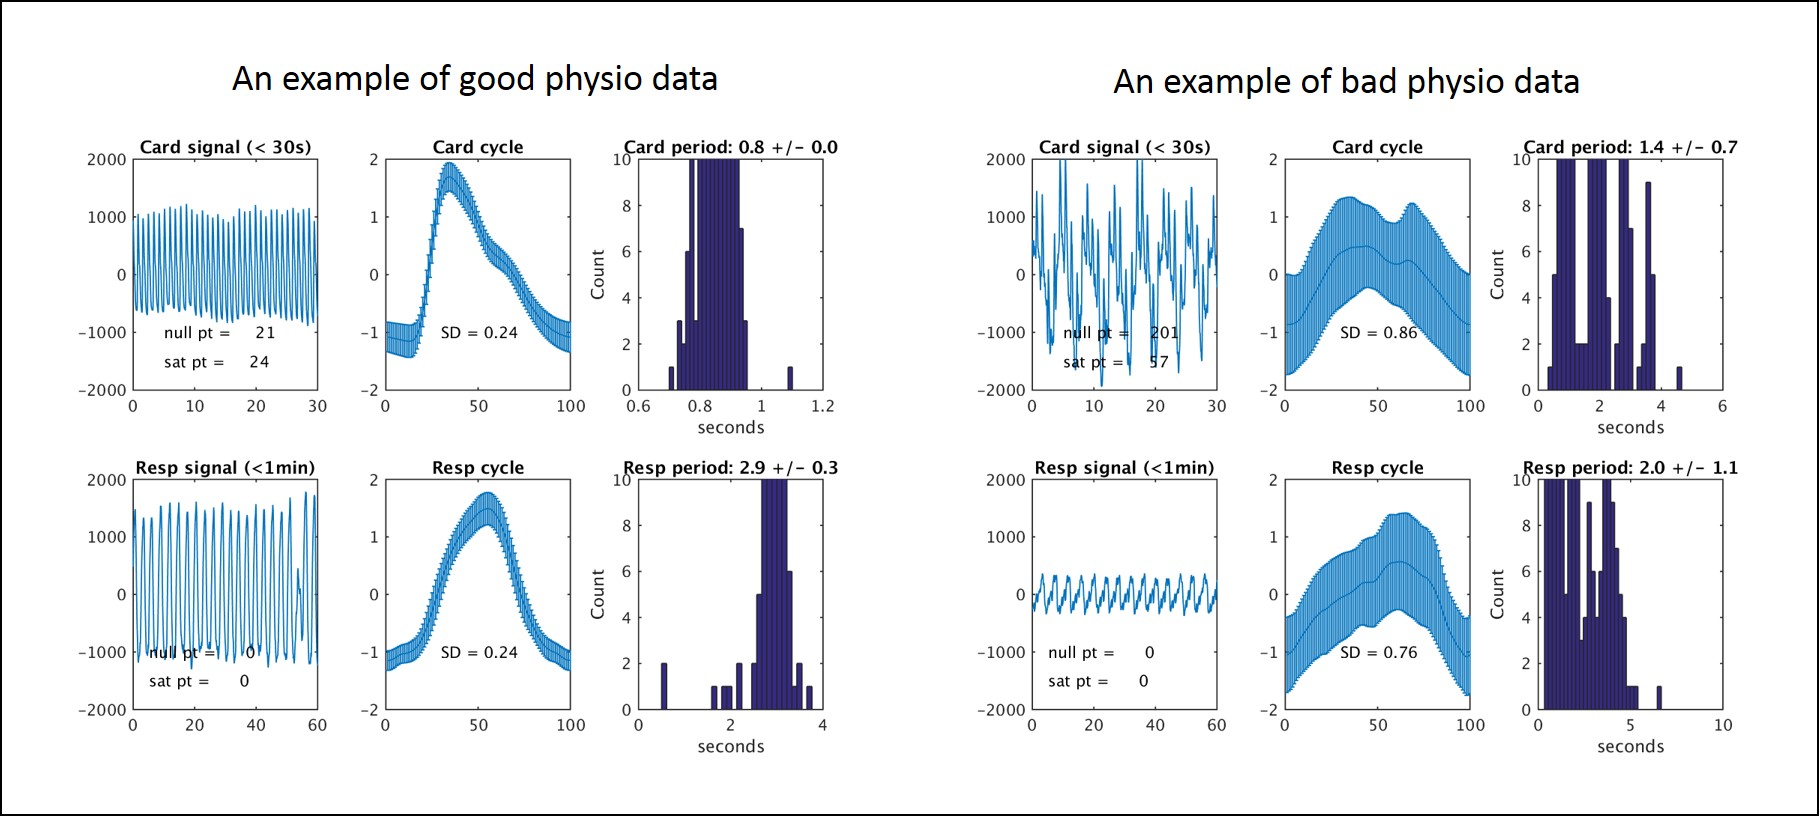
Table1 shows the list of variables and the factor analysis of them. As shown, the number of nulled signals are highly correlated to the number of saturated signals with 0.74 and 0.68 in cardiac and respiratory signals, respectively. Also, COV of period is highly correlated to SD of the repeated signals over the phase with 0.85 and 0.71 in cardiac and respiratory signals, respectively. Figure 1 and 2 show the correlation coefficient between mean value of top 1% F value from cardiac and respiratory RETROICOR results and each predictor. It is observed that COV of the period and SD of normalized signals are the significant predictors of the goodness of physio correction. Figure 3 plots the relationship between COV of the period and SD of the repeated signals. Note that low numbers of COV and SD indicate the consistent patterns of physiologic data. We set the outlier threshold as 0.6 and 0.2 for the cardiac signals, and 0.6 and 0.3 for the respiratory signals. Figure 4 shows the example of quality assurance result of good and bad cases.Discusion
The number of nulled and the saturated physiologic signals is not highly correlated to the quality of physiologic correction. However, it could represent the quality of the physiologic data measures. We excluded physiologic data with more than 500 and 3000 points of null and saturated signals for the cardiac and respiratory, which results in the exclusion of 6% of the physiologic data. The proposed outlier threshold using COV of the period and SD of the repeated signals leave 197 cardiac and 186 respiratory data among 282, which is 70% and 67 % of cardiac and respiratory data. A more comprehensive investigation is needed to determine the threshold more accurately. It was found that the physiological correction could be conducted more efficiently using alternative physiologic estimator methods, such as PESTICA [2], in case that physiologic data is corrupted [3]. The proposed QA standard could be considered as a matrix to determine which physiologic noise data should be employed.Conclusion
We investigate the quality of HCP physiologic data and propose the quality assurance standard of them. The script to generate physiologic QA, shown in Fig4 will be provided in public in NITRC site soon (www.nitrc.org/projects/pestica)Acknowledgements
This work was supported by Cleveland Clinic. Authors appreciate HCP community for the helpful discussion.References
1. Glover GH, Li TQ, Ress D. Image-based method for retrospective correction of physiological motion effects in fMRI: RETROICOR. Magn Reson Med. 2000;44(1):162-7. Epub 2000/07/14. doi: 10.1002/1522-2594(200007)44:1<162::AID-MRM23>3.0.CO;2-E [pii]. PubMed PMID: 10893535.
2. Beall EB, Lowe MJ. Isolating physiologic noise sources with independently determined spatial measures. Neuroimage. 2007;37(4):1286-300. Epub 2007/08/11. doi: S1053-8119(07)00585-X [pii]
Figures