2873
Differentiating Brachytherapy and Intraprostatic Gold Fiducial Markers with Varying Off-Resonant Frequency Offsets1School of Biomedical Engineering, McMaster University, Hamilton, ON, Canada, 2Juravinski Cancer Centre, Hamilton, ON, Canada, 3Electrical and Computer Engineering, McMaster University, Hamilton, ON, Canada
Synopsis
The dual-plane co-RASOR sequence is able to differentiate between a LDR brachytherapy seeds and gold fiducial markes used in prostatic imaging, by exploiting signal pileups and rewinding them radially inwards using different off-resonant frequency offsets and has the potential to avoid a radiological CT scan that’s clinically used to differentiate the two in boost therapy.
Introduction
Magnetic Resonance Imaging is increasingly used in the integration of image guided radiation therapy planning [1]. Geometric and dosimetric accuracy of MR-only workflows have also been recently reported [2]. Two current issues in MR-only workflows are identifying implanted gold fiducial markers (FMs) with positive contrast, and differentiating the FMs from brachytherapy seeds in patients undergoing external beam boost [3]. An MR pulse sequence, developed for visualizing low-dose rate brachytherapy seeds with positive contrast, centre-out radial sampling with off-resonance reception (co-RASOR) [4], is proposed here to differentiate the two seeds as they have different magnetic susceptibilities, with gold being diamagnetic (χm < 0) and the platinum layer of the brachytherapy seed being paramagnetic (χm > 0). This will alter the B0-magnetic field inhomogeneity patterns observed in the co-RASOR signal model as the signs of ΔBz are opposite for each seed. The diamagnetic FMs can reconstructed with positive contrast using positive off-resonant frequency offsets to rewind their signal pileups to their geometric centre, whereas the paramagnetic brachytherapy seed can similarly use a negative frequency offset.Methods
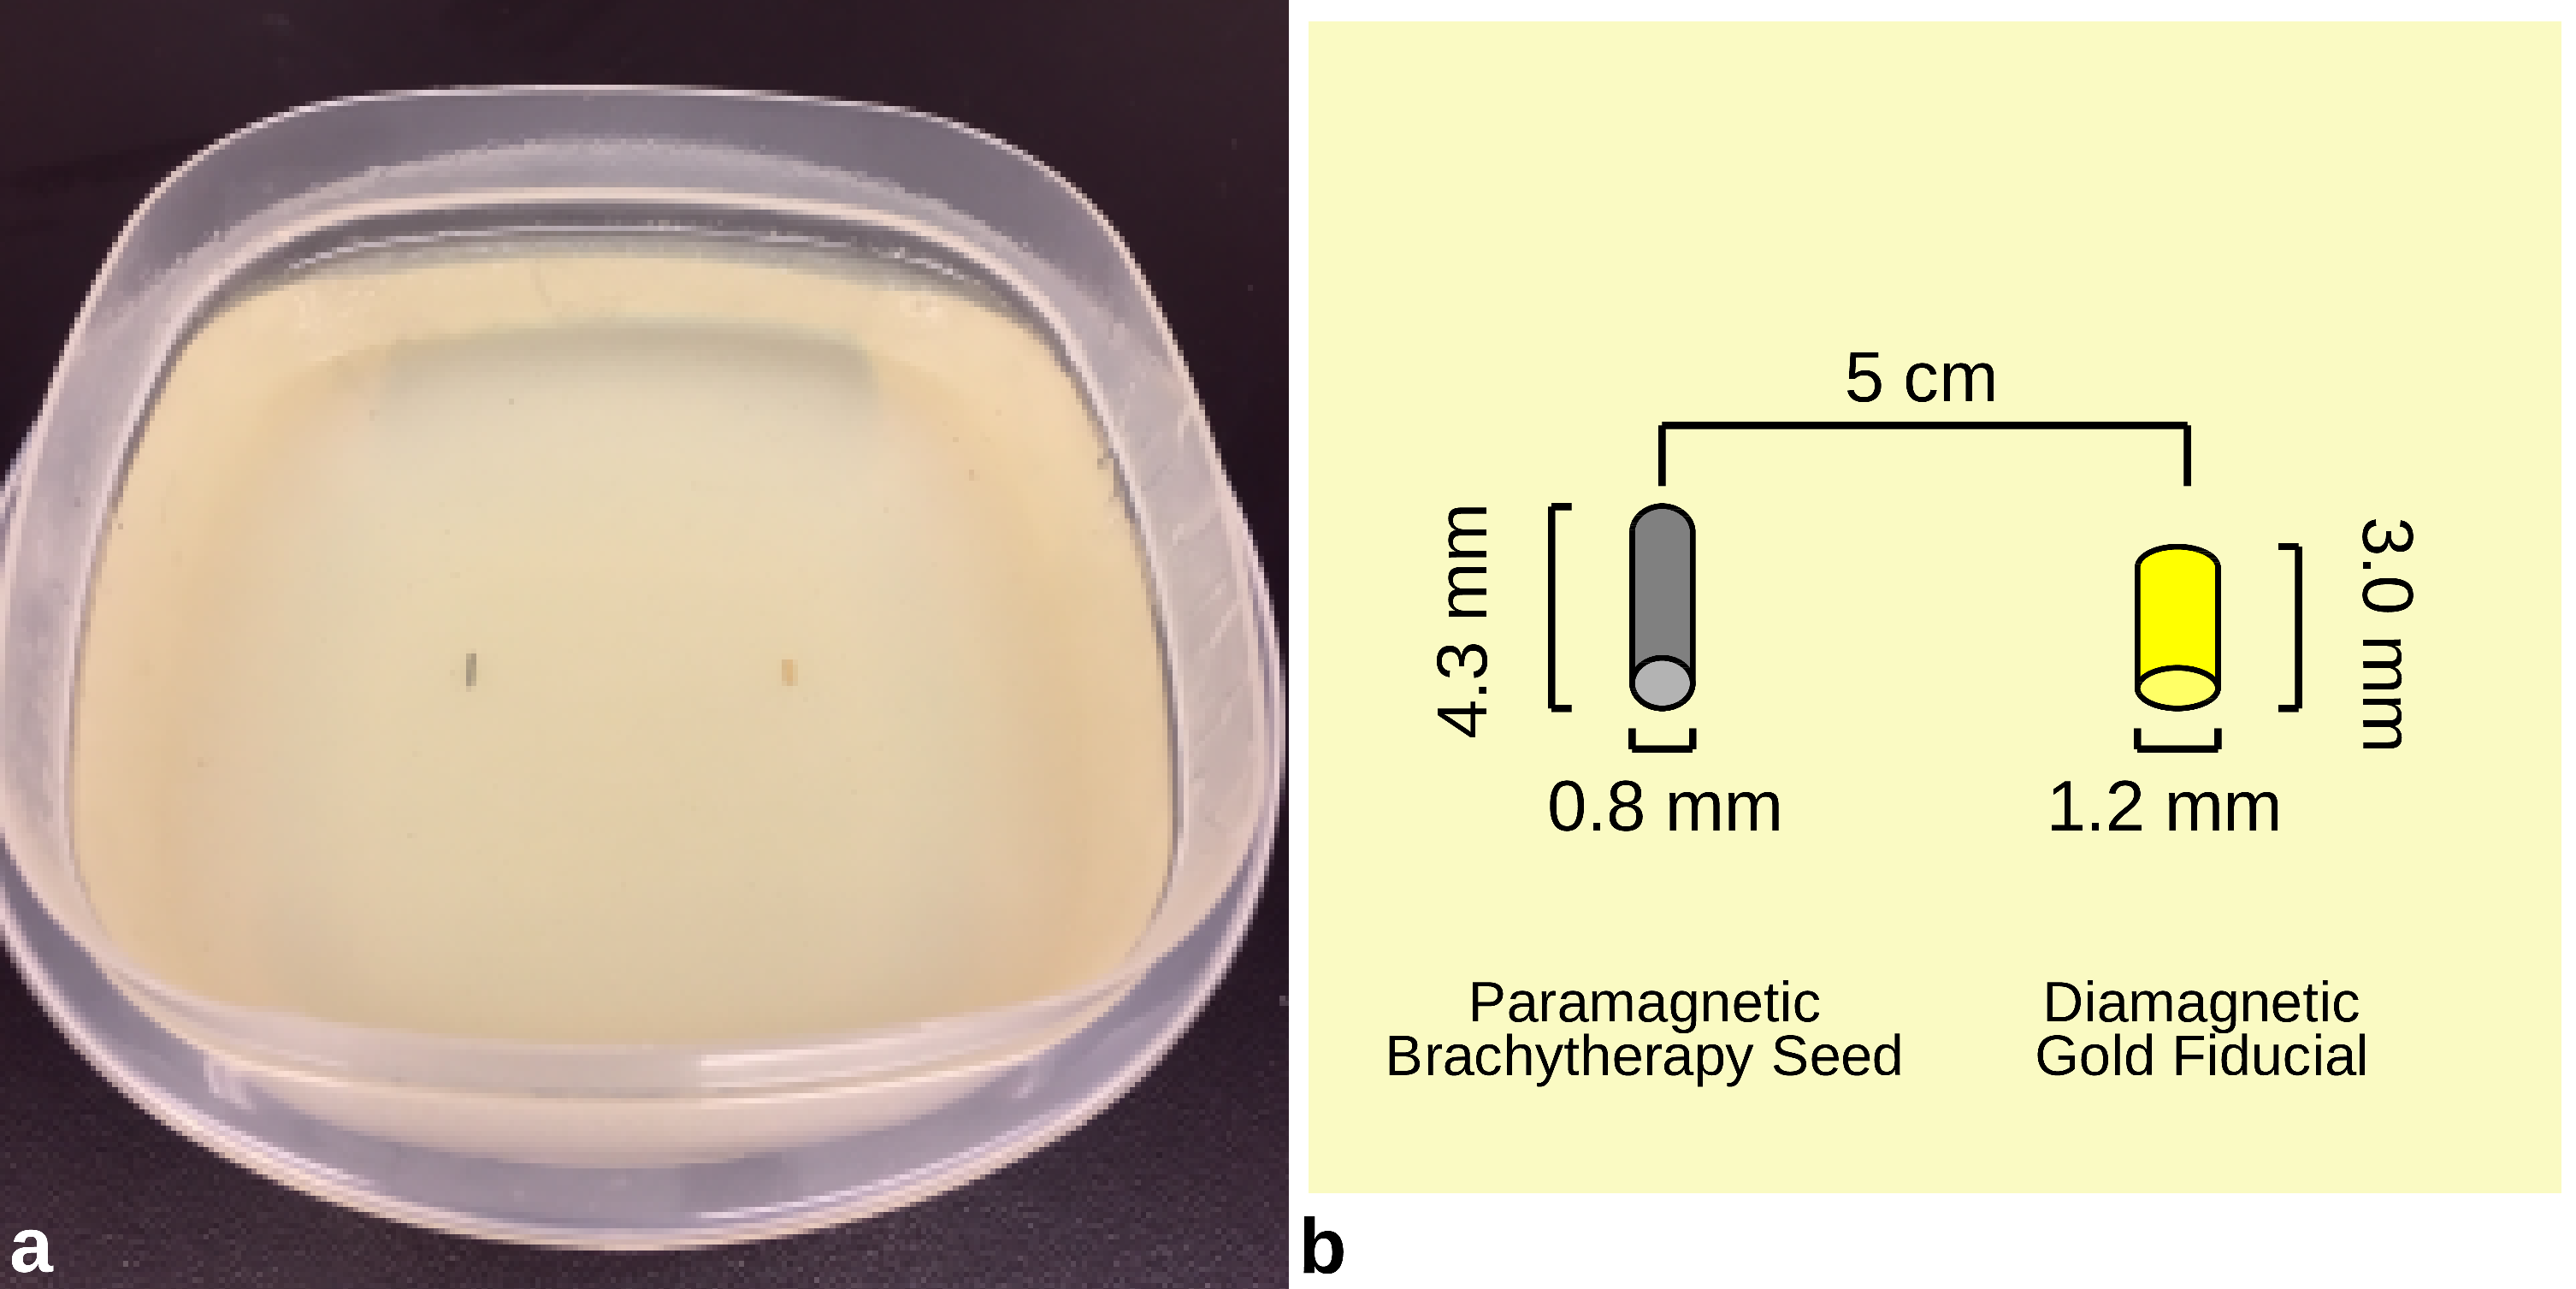
A gel phantom (3% agarose) was constructed in two layers where two seeds were placed between layers parallel to the B0-magnetic field approximately 5 cm apart (Figure 1a). The left seed is a 125I LDR brachytherapy seed (DraxImage Model LS-1, Quebec, Canada) of diameter 0.8 mm and length 4.5 mm containing a 10% platinum outer layer. The right seed is a gold fiducial marker (IZI Medical Products, MD, USA) of diameter 1.2 mm and length 3.0 mm (Figure 1b). The MR acquisition protocol used a GE 3T Discovery 750 and a 32-channel head coil and consisted of the following scans: a negative contrast 3D axial bSSFP (TE/TR=1.3/3.5ms, bandwidth=488Hz/pixel, FOV=16.0cm2x11cm, 256x256, thickness=1.0mm, NSA=2, flip=20, scan time=2min 11s); 2D dual-plane co-RASOR (TE/TR=2.8/25ms; FOV=16.0cm; thickness=3.0mm; matrix=256x804; bandwidth=250 Hz/pixel, flip=30, scan time=40s). Each co-RASOR acquisition was reconstructed with off-resonant frequencies from +/- 1.25 kHz in 50 Hz steps resulting in 51 offsets. A projection using all frequency offsets was used to view both seeds in axial and coronal planes. A smaller positive frequency range, centred about 500 Hz +/ 50 Hz, was used to rewind signal pileups from the gold fiducial marker, whereas a negative frequency range, centred at -600 Hz, was used for the brachytherapy seed.
Results
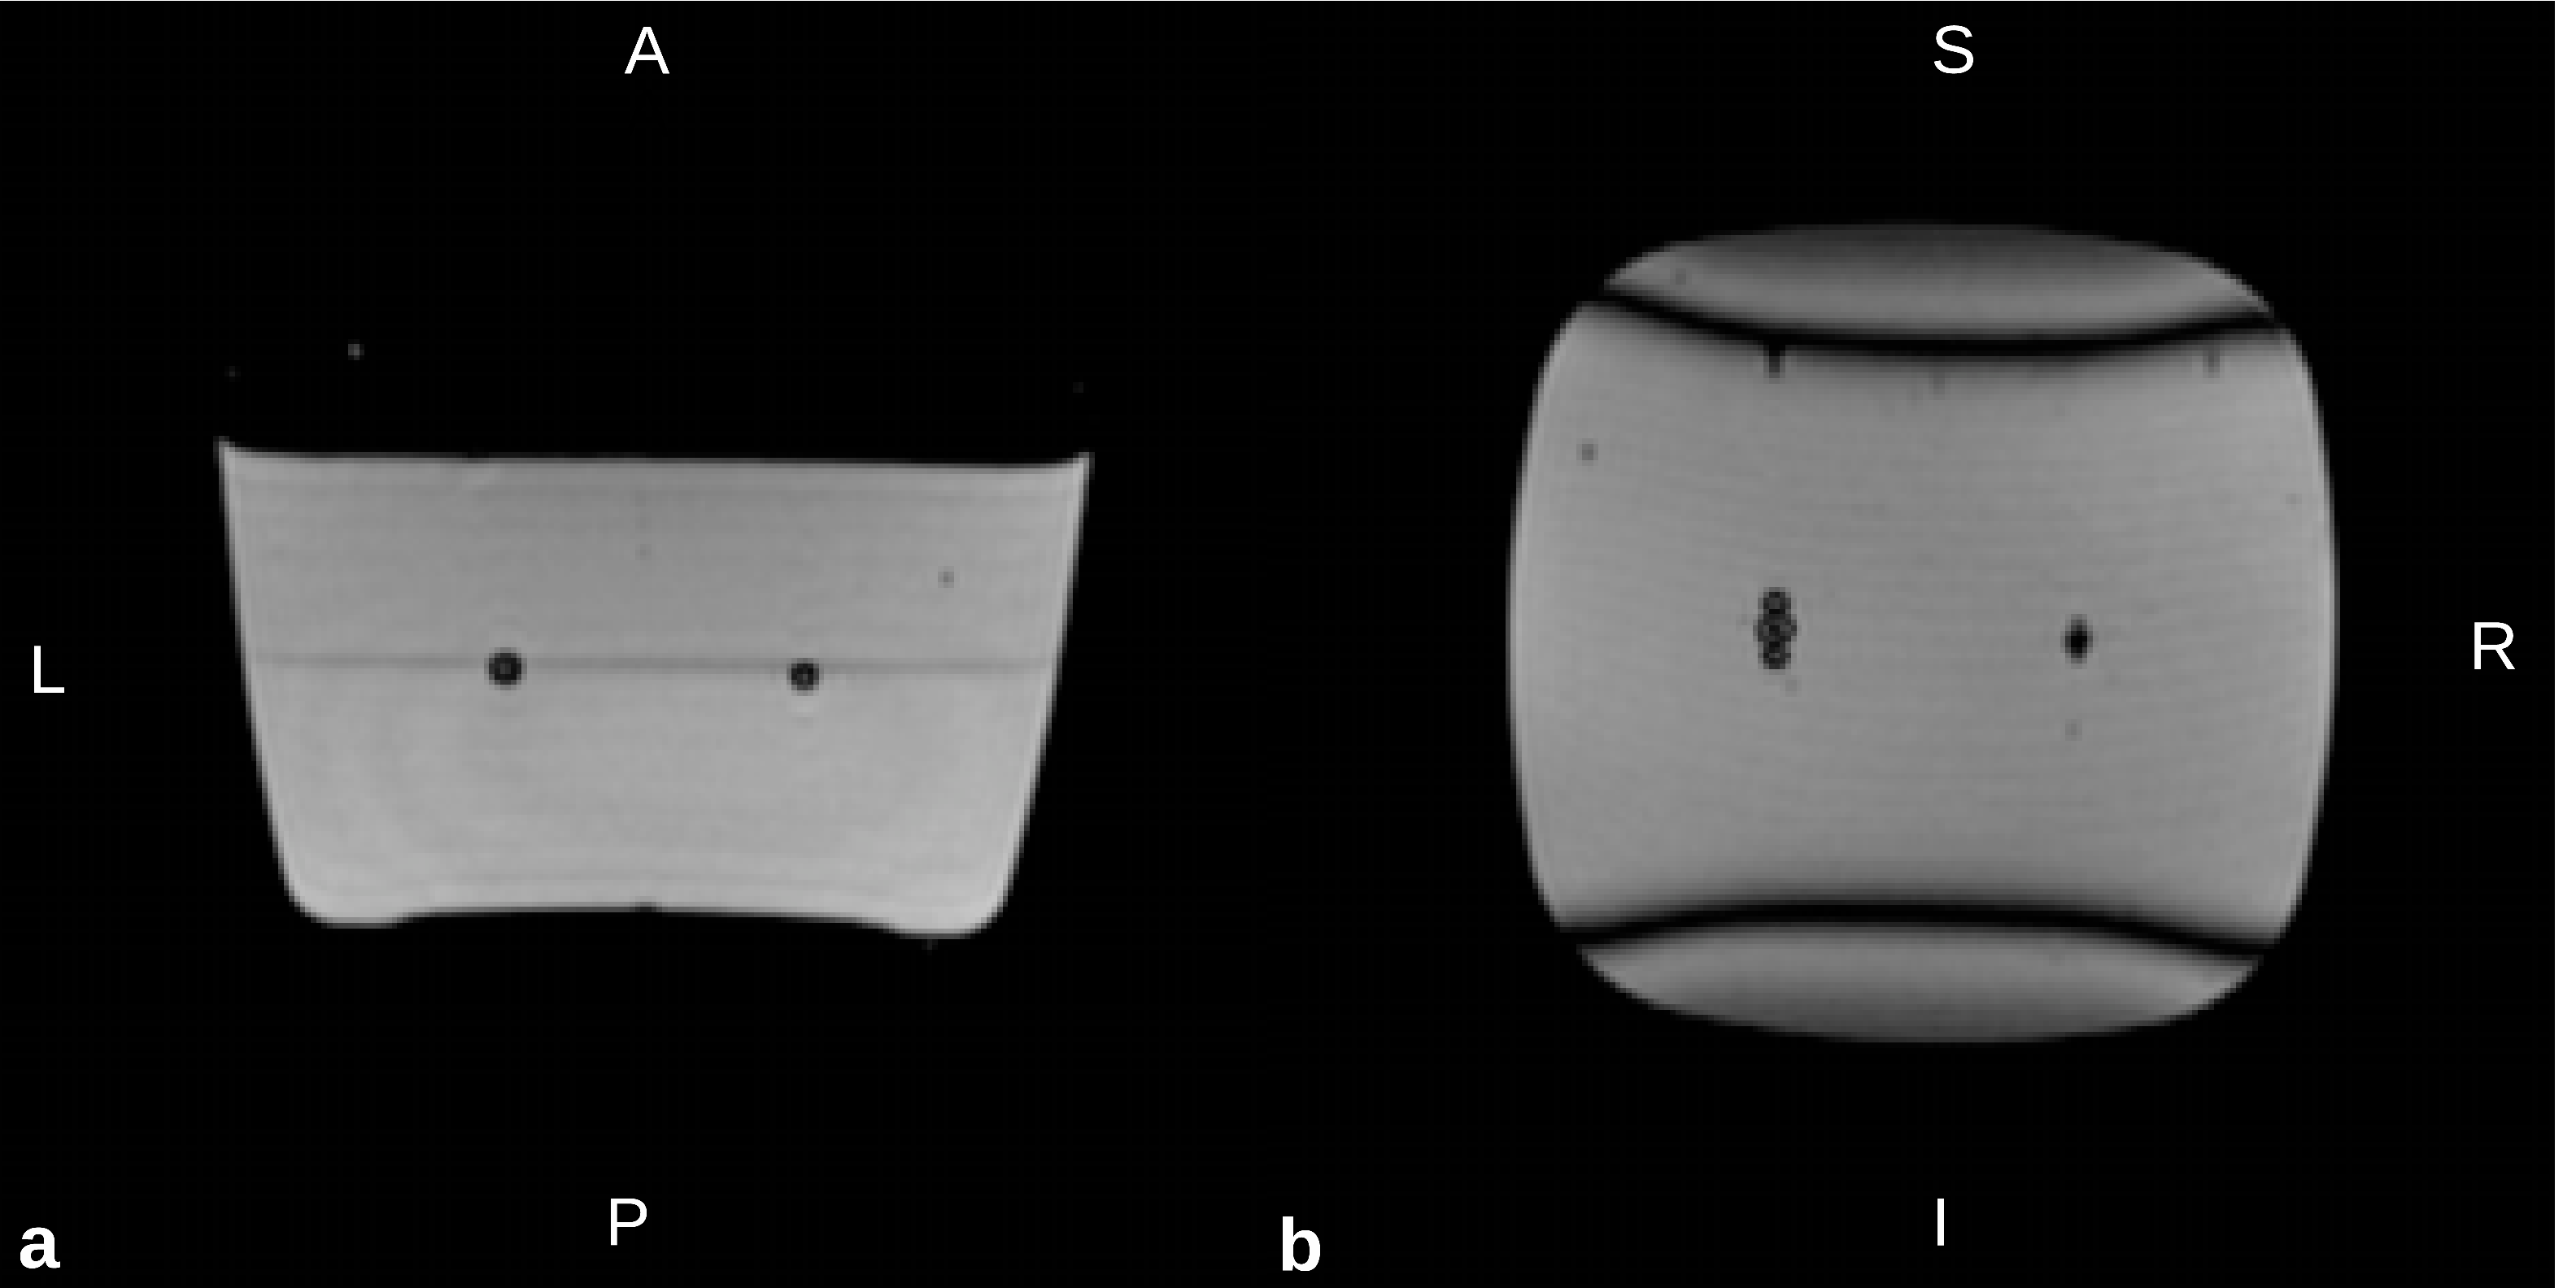
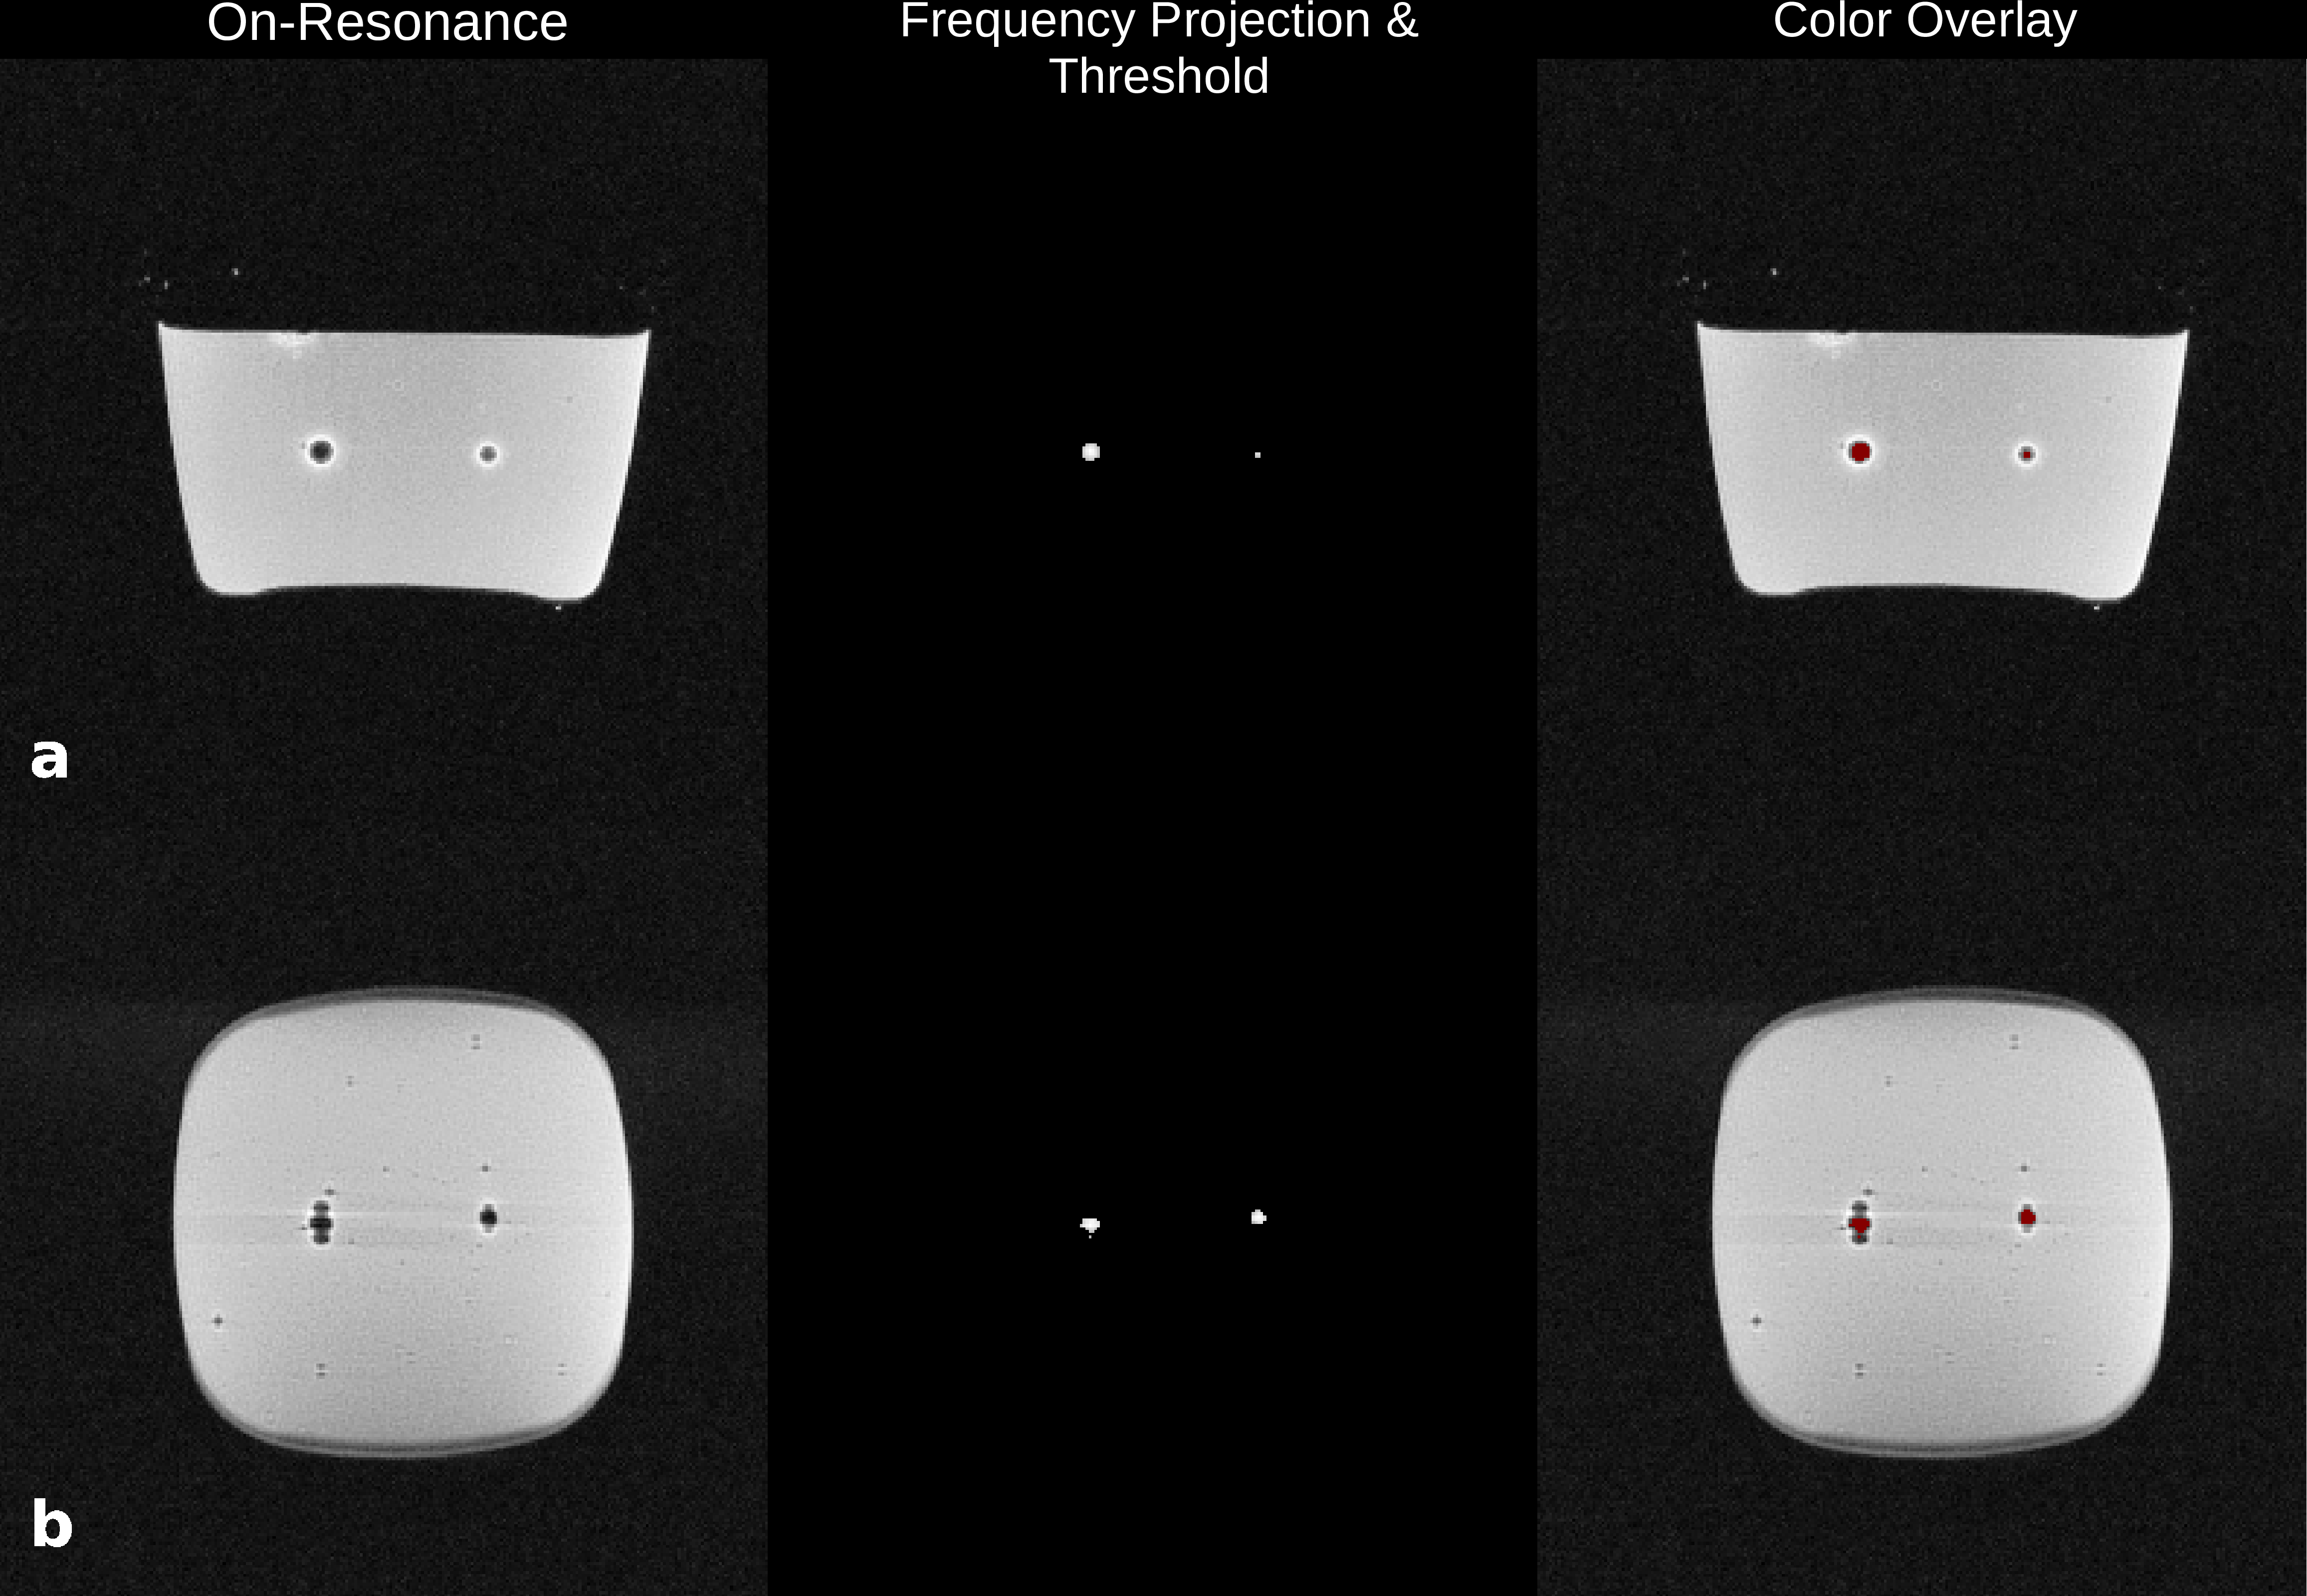
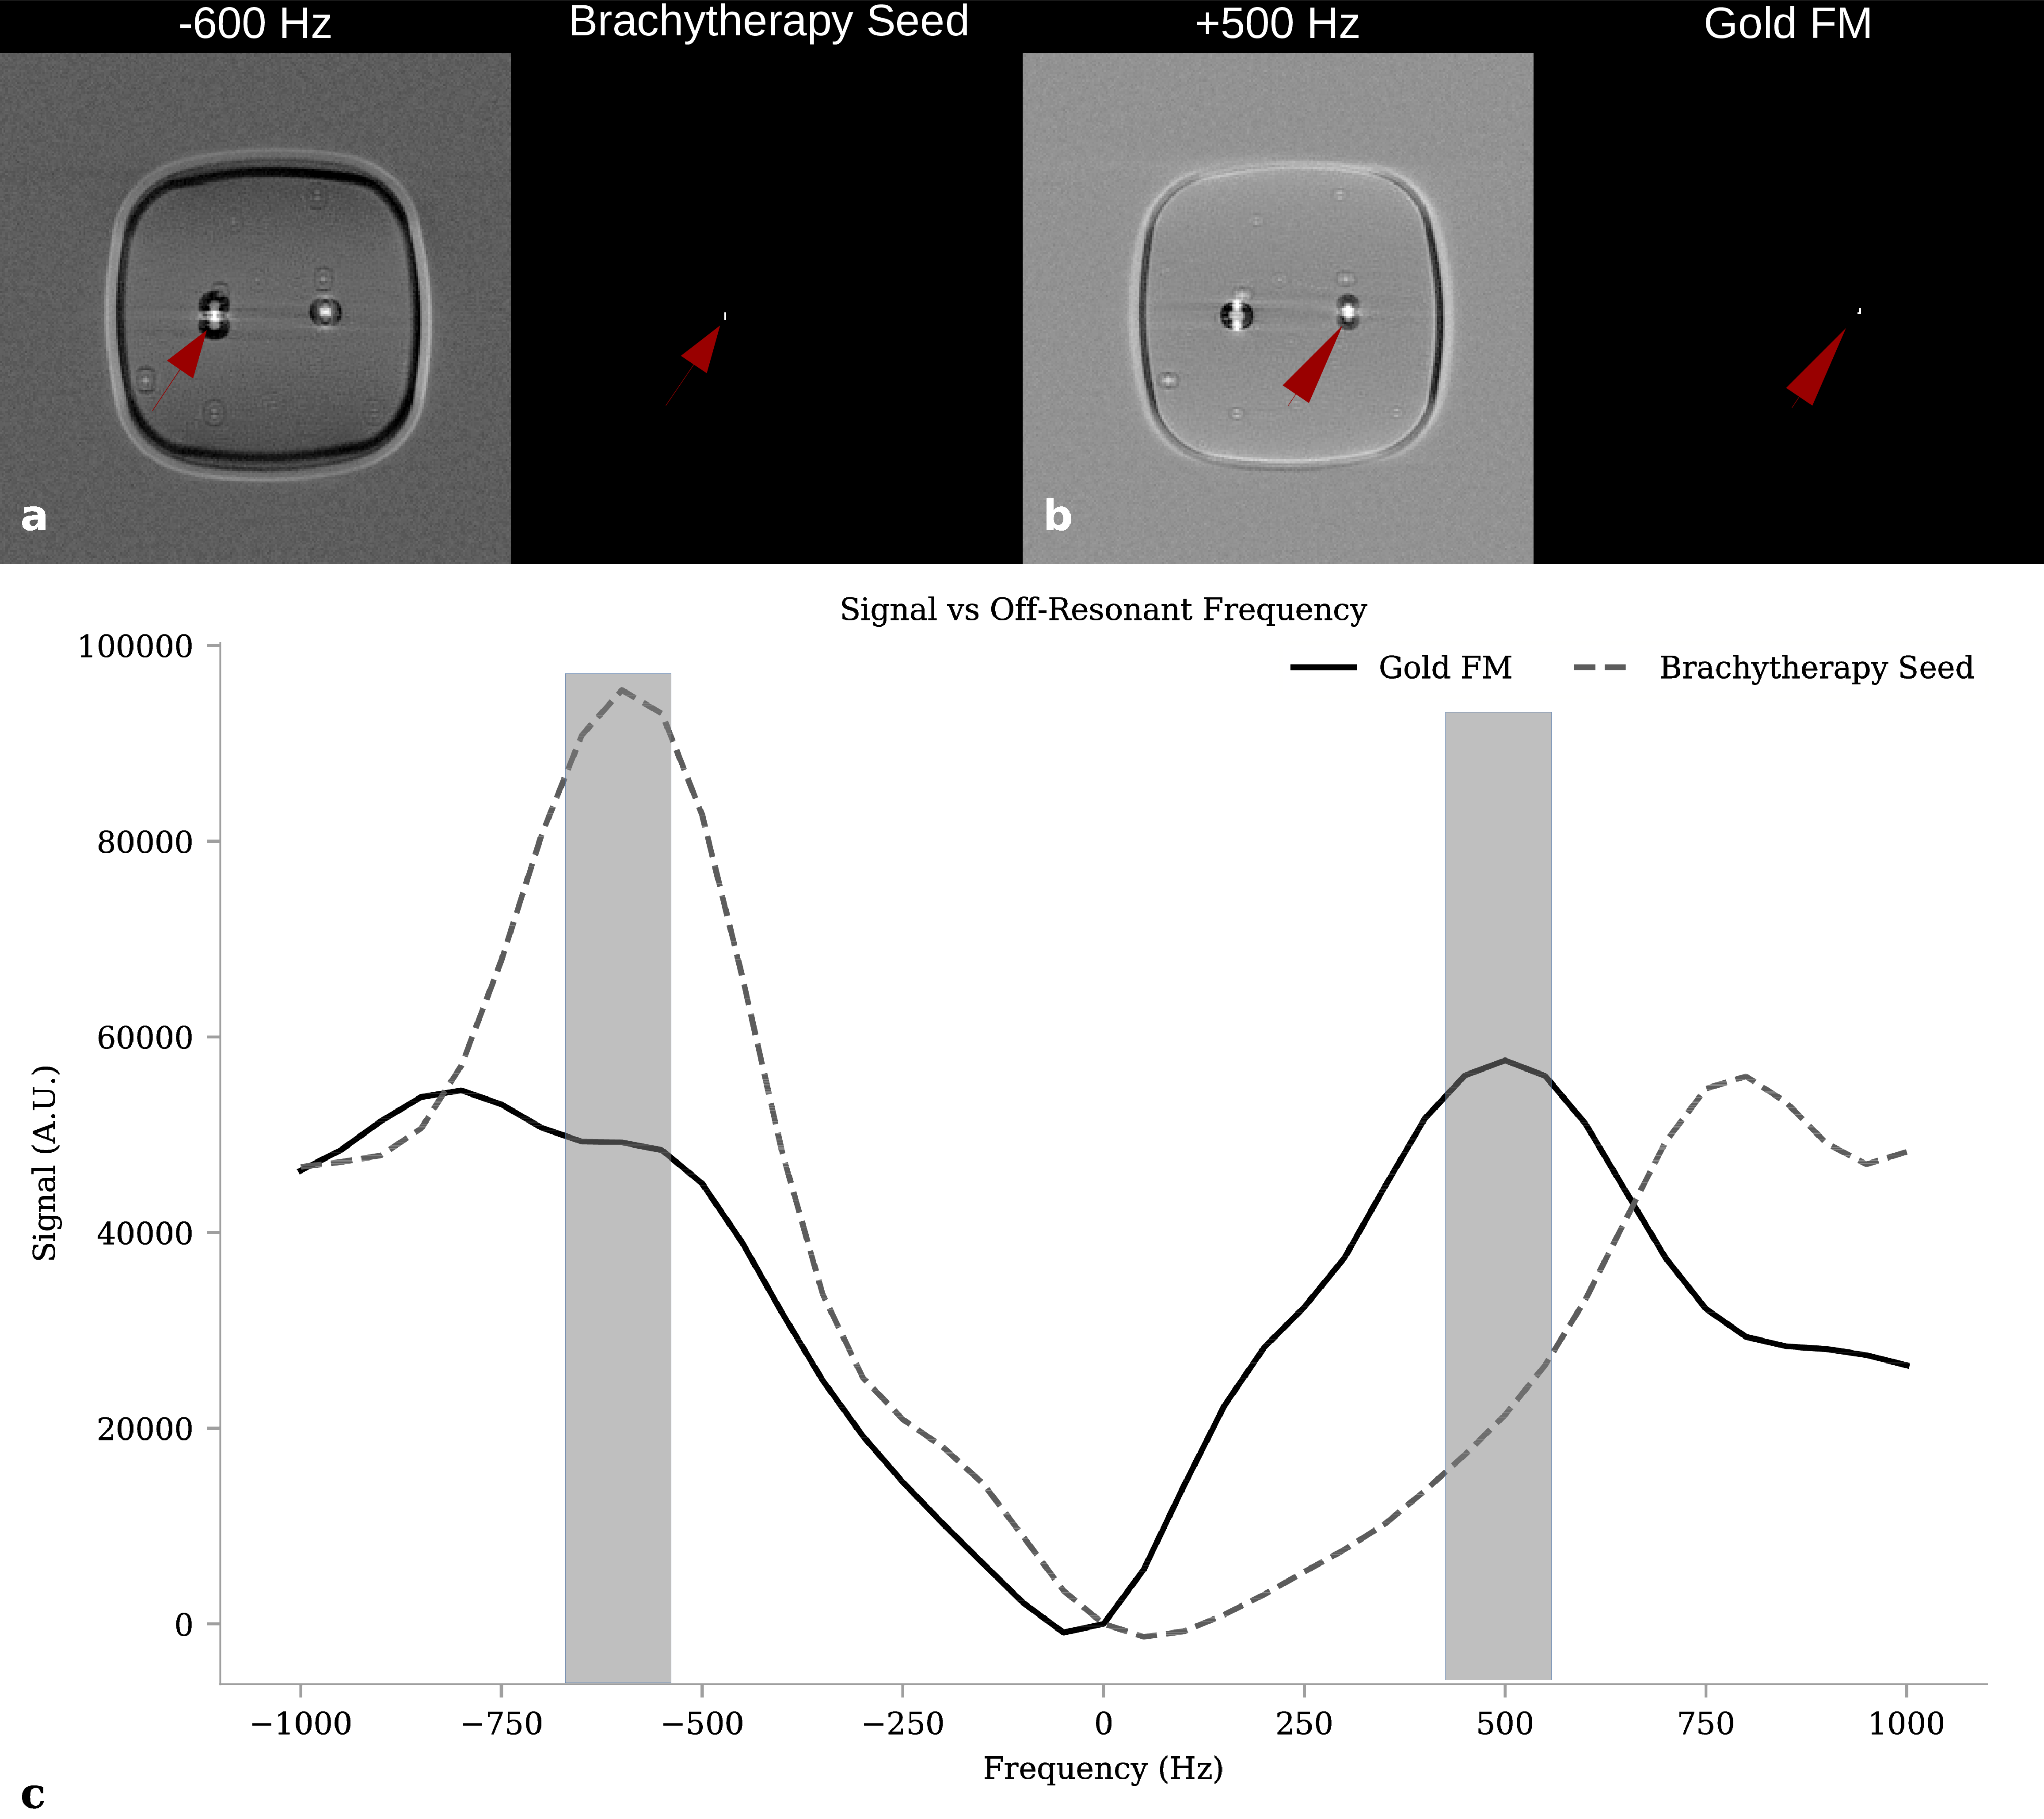
The clinical MR scan, used for negative contrast scan identification of signal voids due to the FMs is shown as a reference (Figure 2). The increased signal void of the brachytherapy seed is due to its stronger magnitude of susceptibility, however specificity of the true seed location is reduced. A projection through all frequency offsets followed by a maximum intensity projection through the slices, and 80% thresholding yields both seeds with positive contrast (Figure 3). Finally, when applying a smaller range of frequency offsets centred about -600 and +500 Hz, each seed can be individually identified (Figure 4a,b). The MR signal vs frequency offset of a small ROI placed in the centre of the brachytherapy seed and gold FM shows the signal maxima for each seed (Figure 4c).Discussion
The dual-plane co-RASOR sequence is able to differentiate the two seeds based on their susceptibility difference, as this causes the signal pileups to have unique patterns around the seeds, seen in the on-resonant images. Different frequency offsets are able to bring into focus the hyperintensities at the geometric centre for a single marker, as shown by the red arrows in Figure 4. When reconstructed at -600 Hz, the brachytherapy seed has a much higher local signal intensity (red arrow Fig 4a) and can be isolated by thresholding, whereas at 500 Hz, the gold FM has the highest local signal and is also isolated by thresholding. The signal vs frequency plot reveals that each seed has a signal maxima which is used to tune the off-resonant frequency offsets. One limitation is that the hyperintensities must have distinct patterns. In the axial plane (Fig. 3a) the hyperintensities show a ring pattern around the signal voids and rewind approximately equally with similar frequency offsets. The coronal plane (Fig 3b) has signal pileups in a characteristic dipole pattern with opposite positive and negative lobes which was exploited to rewind signal pileup at its centre for different frequencies.Conclusion
The dual-plane co-RASOR sequence is able to differentiate between the LDR brachytherapy seed and gold FM by exploiting signal pileups and rewinding them radially inwards using different off-resonant frequency offsets. This has the potential to avoid a radiological CT scan that’s clinically used to differentiate these seeds in boosting therapy.Acknowledgements
This project is based upon work supported by the Ontario Graduate Scholarship (OGS). The authors also thank the financial contributions by Mr. Robert Dunsmore.References
[1]: Baumann et al. (2016) Nature Reviews Cancer 16:234-249 [2]: Tyagi et al. (2017) Phys. Med. Biol. 62:2961-2975 [3]: Tyagi et al. (2017) Radiation Oncology 12:119 [4]: Seevinck et al. (2011) MRM; 65:146Figures