2872
Cerebral vasoreactivity latency correction: a clinical case study1I2FH - CHU Gui de Chauliac, Montpellier, France
Synopsis
In MR cerebral vasoreactivity (CVR) experiments, responses to the gas stimuli are expected to be with no major time lag. However, it has been shown that different brain regions could respond with different timing during a vasoreactivity. The presence of potential latencies could lead to a misinterpretation of the resulting CVR maps. We attempt to correct CVR maps for physiological latency differences, and propose an alternative way to display both corrected CVR and CVR latency. The data from a Moya Moya patient highlight that even without a strong perfusion alteration, the vasoreactivity is strongly delayed or even completely disrupted.
Introduction
In fMRI the BOLD signal is sensitive to the neural activity through the neurovascular-coupling, but it is also sensible to the vascular state1-4. In cerebral vasoreactivity (CVR) experiments, responses to the gas stimuli are expected to be with no major time lag. However, it has been shown that different brain regions can respond with different timing. Indeed, the underlying vasculature affects the dynamics and magnitude of the BOLD signal5-6. The presence of potential latencies could lead to a misinterpretation of the resulting CVR maps. Some approaches tried to correct for this modified delays7. In the present study, we attempt to correct CVR maps for latency differences, and propose an alternative way to display both corrected CVR as well as CVR latency.Methods
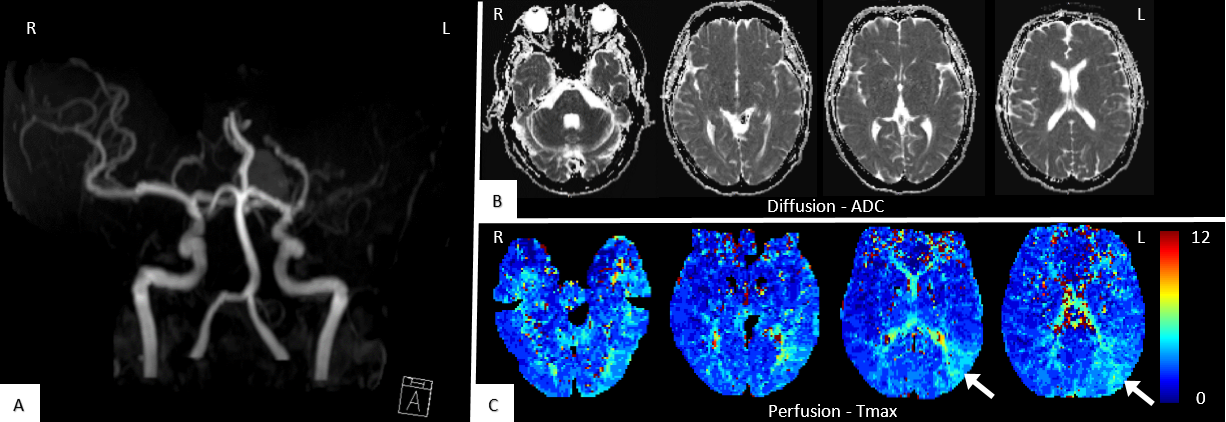
To investigate the feasibility and interest of this new approach, we examined a 60 years old subject with an occlusion of the left middle cerebral artery (Figure 1A) and a suspected Moyamoya disease. No arguments for a chronic ischemia, no coronary history, no evidences of previous stroke/transient cerebral ischemia or headaches, and no known arterial risk factors. No major sign of asymmetric perfusion was identified. We also display the results for a healthy subject.
Neuroimaging data were collected at 3T (MAGNETOM Skyra, Siemens Healthcare) using a 32-channel head coil. A hypercapnic challenge was performed during the MR scan to measure CVR. The paradigm of inhalation involved a shift between air and carbon-dioxid-enriched gas (BACTAL®, 8% of carbone dioxid). A MAGLIFE system (Maglife, Schiller medical) measured physiologic parameters such as mean arterial blood pressure, heart rate, and arterial oxygen saturation. The corresponding MRI data were acquired using an EPI sequence (262 volumes, 3 gas blocks). A time-of-flight angiography was included to check for vascular abnormalities. Finally, for the patient, a susceptibility based MR perfusion sequence (Gadolinium based) and a diffusion sequence were performed. Tmax maps were estimated from prefusion images using RAPID software (RAPID 4.7.1.1).
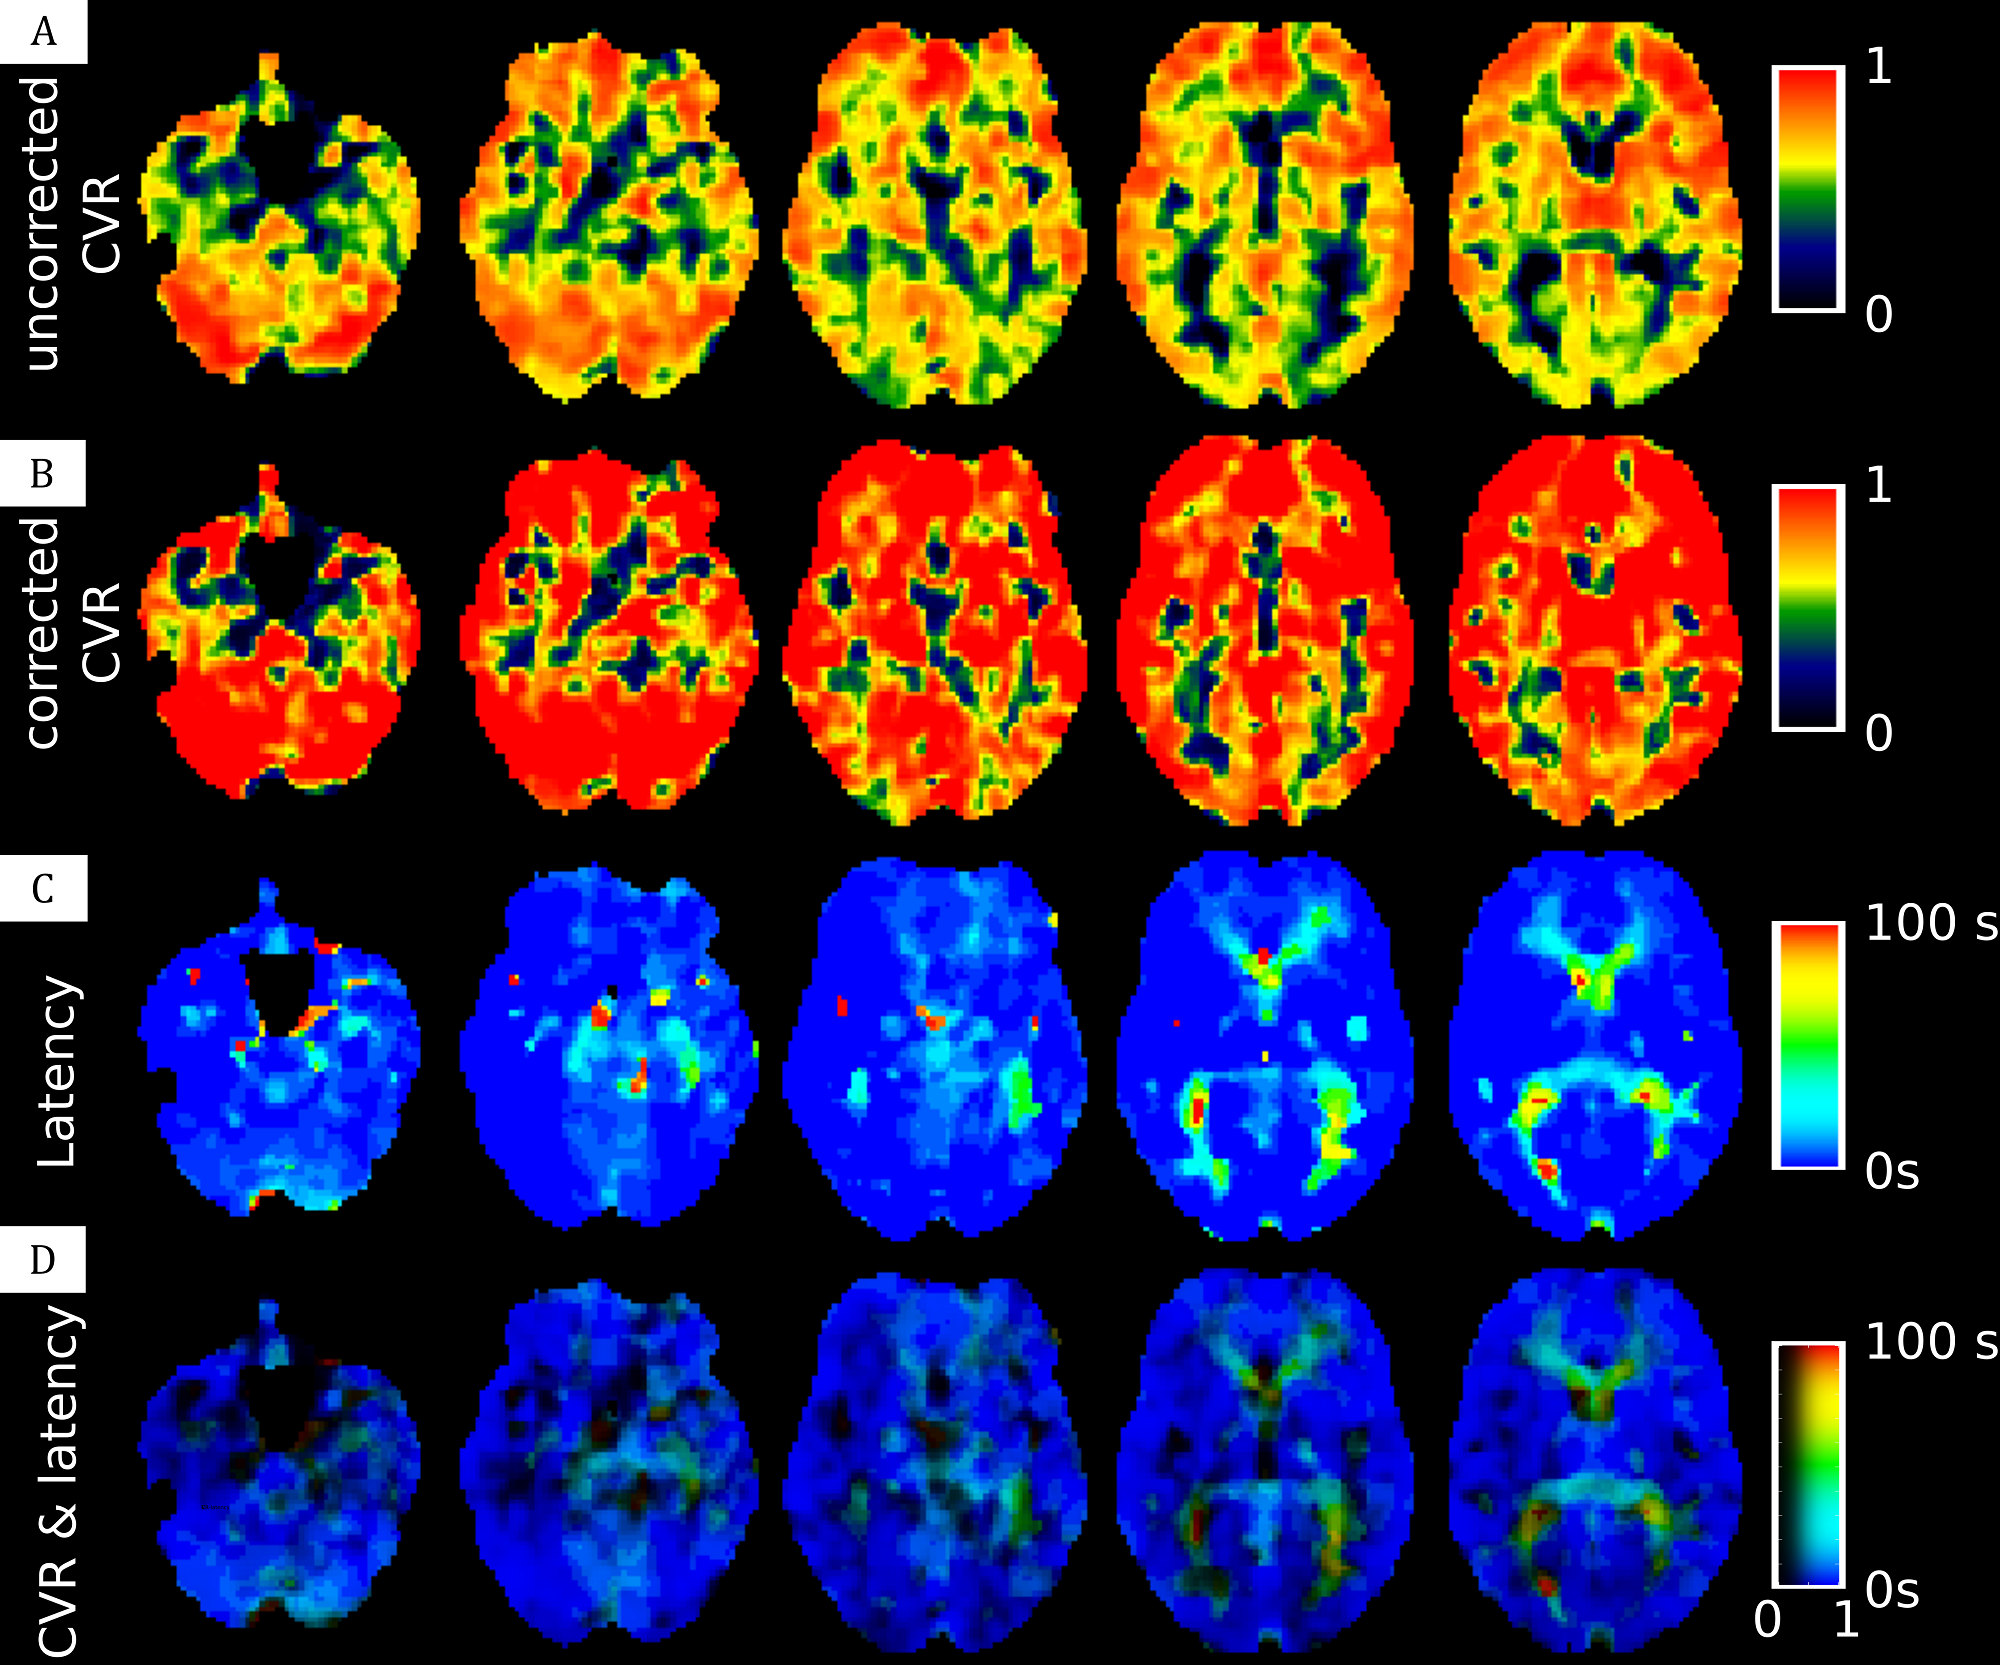
The data was processed with MATLAB (R2014a) using the SPM12 toolbox. The CVR-latency map was created first by estimating the delay between mean end tidal CO2 obtained on a standard population and BOLD signal of each voxel based on the maximum value of the cross-correlation. The corrected CVR maps are created using a two step procedure, first temporal realignment is achieved according to the CVR-latency map, then a pearson-correlation is implemented between etCO2 and each voxel timecourse intensity. The corrected CVR map indicates this correlation value. Finally, a RGB map is generated for the corrected CVR, with the color indicating the delay and the brightness the “confidence” in this result (degree of correlation).
Results
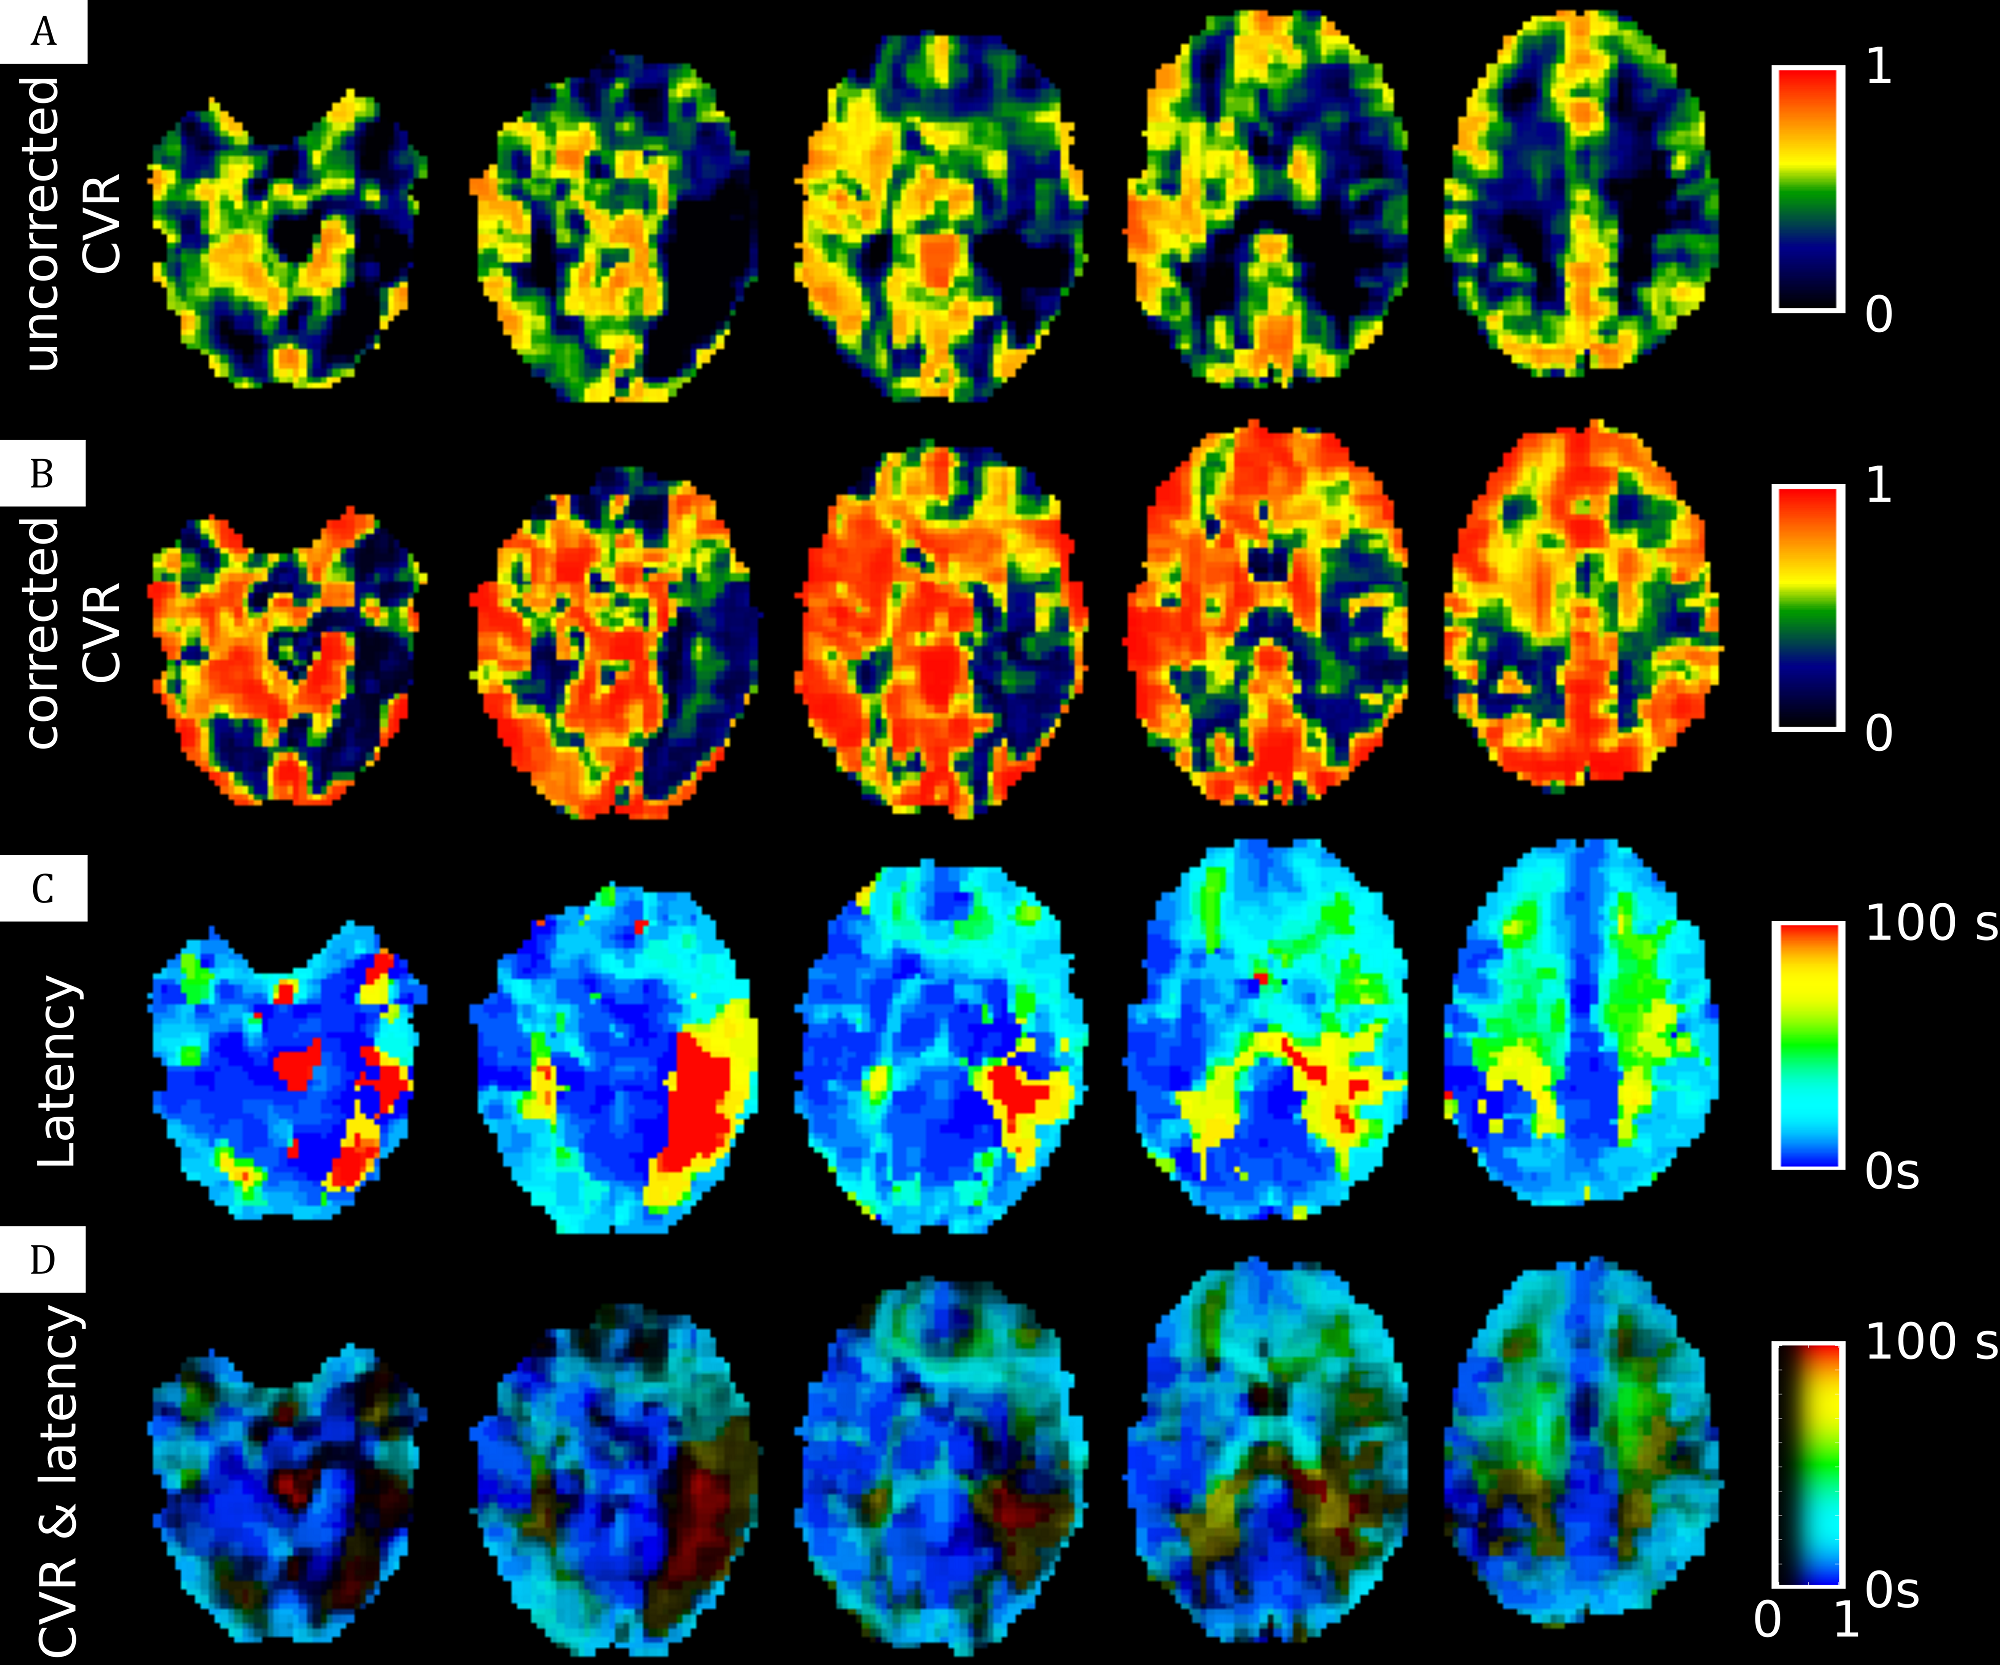
In the healthy subject (Figure 2) we can distinguish two kind of delay, one very short for gray matter and one slightly longer for white matter. The Moyamoya patient appears to have a slight perfusion alteration (but still < 6 sec) with nothing visible on ADC map (Figure 1). The uncorrected CVR map highlight a very poor CVR in left posterior junctional territory (LPJT, Figure 3A). Analysis of CVR latency shows an increased delay in these areas (close to 100sec, Figure 3C). After correction for this delay, CVR appears to be noticeably increased in the whole brain, including in LPJT (Figure 3B). Using our RGB map, we are able to see these two information at the same time, we see that there are two sub regions in LPJT, one in red with still some vasoreactivity, and another in black around this area which appears to have no vasoreactivity.Discussion
In this study we shown a pipeline procedure to estimate the vasoreactivity delay in each voxel and correct the CVR map for this delay, while providing a map to investigate the CVR as well as the confidence in this CVR. In healthy control subject, we see an increased delay in white matter compared to gray matter. It is well known that blood arrival time are longer in white matter, which explain this result. The data from our patient highlight that even without a strong perfusion alteration, the vasoreactivity is strongly delayed or even completely disrupted. For this patient we may hypothesize that the tissues in these areas are already in a compensation status and therefore cannot respond properly to another stress represented by the increased CO2. Of course, it is possible that the vasoreactivity is not completely disrupted is dark areas but that the delay is superior to the duration of one of our paradigm block.Acknowledgements
No acknowledgement found.References
[1] Bandettini, P.A.,Wong, E.C., Hinks, R.S., Tikofsky, R.S., Hyde, J.S.,1992. Time course EPI of human brain function during task activation. Magn. Reson. Med. 25, 390–397.
[2] Kwong, K.K., Belliveau, J.W., Chesler, D.A., Goldberg, I.E.,Weisskoff, R.M., Poncelet, B.P., Kennedy, D.N., Hoppel, B.E., Cohen, M.S., Turner, R., 1992. Dynamic magnetic reso- nance imaging of human brain activity during primary sensory stimulation. Proc. Natl. Acad. Sci. U.S.A. 89, 5675–5679.
[3] Logothetis, N.K., Pauls, J., Augath, M., Trinath, T., Oeltermann, A., 2001. Neurophysio- logical investigation of the basis of the fMRI signal. Nature 412, 150–157.
[4] Ogawa, S., Tank, D.W., Menon, R., Ellermann, J.M., Kim, S.G., Merkle, H., Ugurbil, K.,1992. Intrinsic signal changes accompanying sensory stimulation: functional brain map- ping with magnetic resonance imaging. Proc. Natl. Acad. Sci. U.S.A. 89, 5951–5955.
[5] Bandettini, P.A., 1999. The temporal resolution of MRI. Functional MRI 205–220.
[6] Lee, A.T., Glover, G.H., Meyer, C.H., 1995. Discrimination of large venous vessels in time- course spiral blood-oxygen-level-dependent magnetic-resonance functional neuroimaging. Magn. Reson. Med. 33, 745–754
[7] C. Chang, M. E. Thomason, and G. H. Glover, “Mapping and correction of vascular hemodynamic latency in the BOLD signal,” Neuroimage, vol. 43, no. 1, pp. 90–102, 2008.
Figures