2871
Matrix analysis of Hybrid Multidimensional MRI for the diagnosis of prostate cancer1Department of Radiology, University of Chicago, Chicago, IL, United States, 2Department of Pathology, University of Chicago, Chicago, IL, United States, 3Department of Urology, University of Chicago, Chicago, IL, United States
Synopsis
This study investigates the feasibility of diagnosing prostate cancer through matrix analysis of Hybrid Multidimensional MRI (HM-MRI) data. Data was acquired with all combinations of TE (47,75,100ms) and b-values (0,750,1500s/mm2), resulting in a 3×3 matrix associated with each voxel. Matrix analysis parameters: trace, eigenvalues and eigenvectors were calculated for benign tissue and prostate cancer. Prostate cancer showed significantly increased trace, eigenvalue 1, eigenvector components v12 and v13 and reduced v11 compared to normal tissue. PCa diagnosis is feasible using matrix analysis of HM-MRI data with parameters showing good differentiation between PCa and benign prostatic tissue (AUC 0.80-0.96 on ROC analysis).
Introduction
MRI is increasingly being used for diagnosing and guiding biopsies for prostate cancer (PCa). However, PCa diagnosis is problematic in the transition and central zones; benign features such as benign prostatic hyperplasia (BPH), prostatitis, etc. can mimic PCa on conventional T2-weighted and diffusion weighted images (1). Hybrid Multidimensional MRI (HM-MRI) measures the change in ADC and T2 as a function of echo time (TE) and b-value, respectively. Recent work demonstrates that the measured ADC’s and T2’s are strongly interdependent, and that this interdependence is different for different tissues. These changes can be used as a source of information about the underlying tissue (2,3). This study investigates the feasibility of diagnosing prostate cancer through matrix analysis of HM-MRI data.Methods
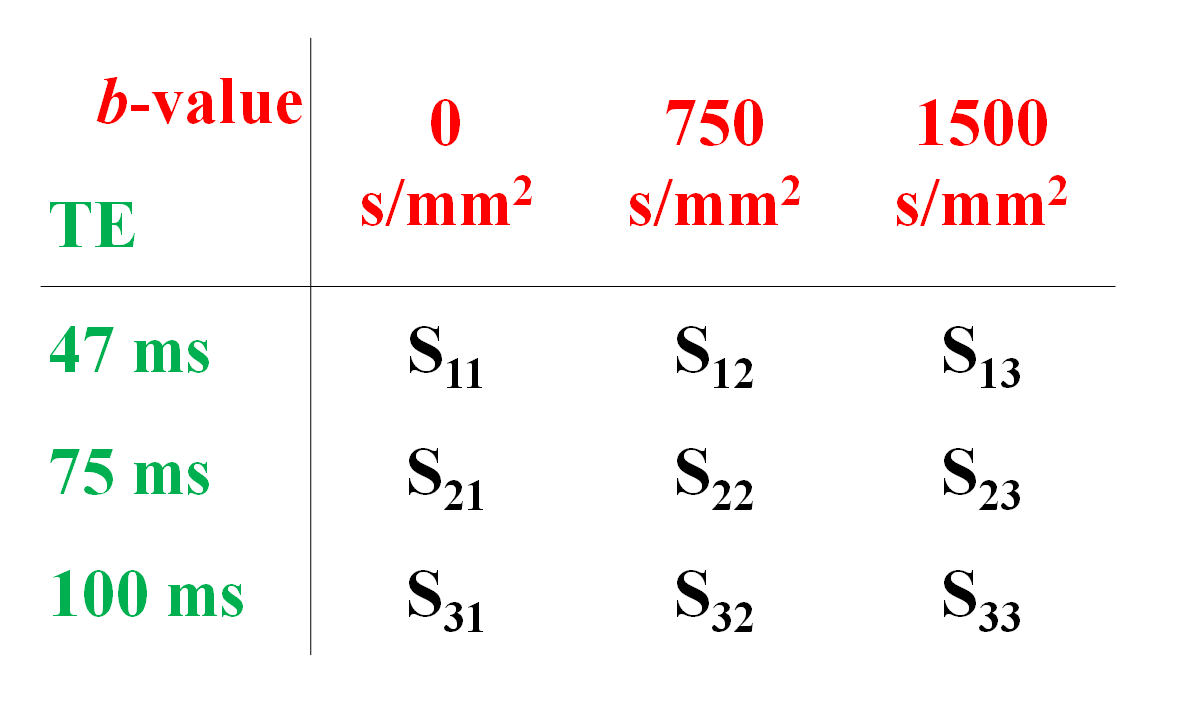
Twenty patients (mean age 65 years, mean PSA 6.9 ng/ml) with histologically confirmed PCa underwent preoperative MRI with a 3T Philips Achieva MR system prior to undergoing radical prostatectomy. Detailed patient and pathology information are shown in Table 1. Axial images using HM-MRI were acquired with all combinations of TE = 47, 75, 100 ms and b-values of 0, 750, 1500 s/mm2, resulting in a 3×3 matrix of data associated with each voxel (see Figure 1). The signal intensity of each matrix entry was normalized by S11. Matrix analysis parameters: the eigenvalues (λ), eigenvectors (v) and trace of the matrix were calculated on a voxel-by-voxel basis in MATLAB (Mathworks). Since eigenvalue 1 (λ1) was the dominant eigenvalue, the associated eigenvector components (v11, v12, v13) were used to generate subsequent maps.
The prostatectomy specimen was sectioned approximately in the same plane as MR images and H&E stained. PCa lesions were graded and outlined by an experienced pathologist. MR images were co-registered with histology and regions-of-interests were placed on sites of prostatectomy verified malignancy (n=27, 11 Gleason 3+3, 11 Gleason 3+4, 3 Gleason 4+3, 2 Gleason 4+5) and normal tissue (n=67, 19 PZ, 18 TZ, 16 CZ, 14 AFMS) from different zones by an experienced radiologist to calculate the above mentioned metrics for subsequent statistical analysis.
The difference between means was assessed by a one-way ANOVA with post hoc Tukey’s HSD test. Receiver operating characteristic (ROC) analysis was used to evaluate the performance of the various parameters in differentiating cancer from normal prostatic tissue in different prostate zones.
Results
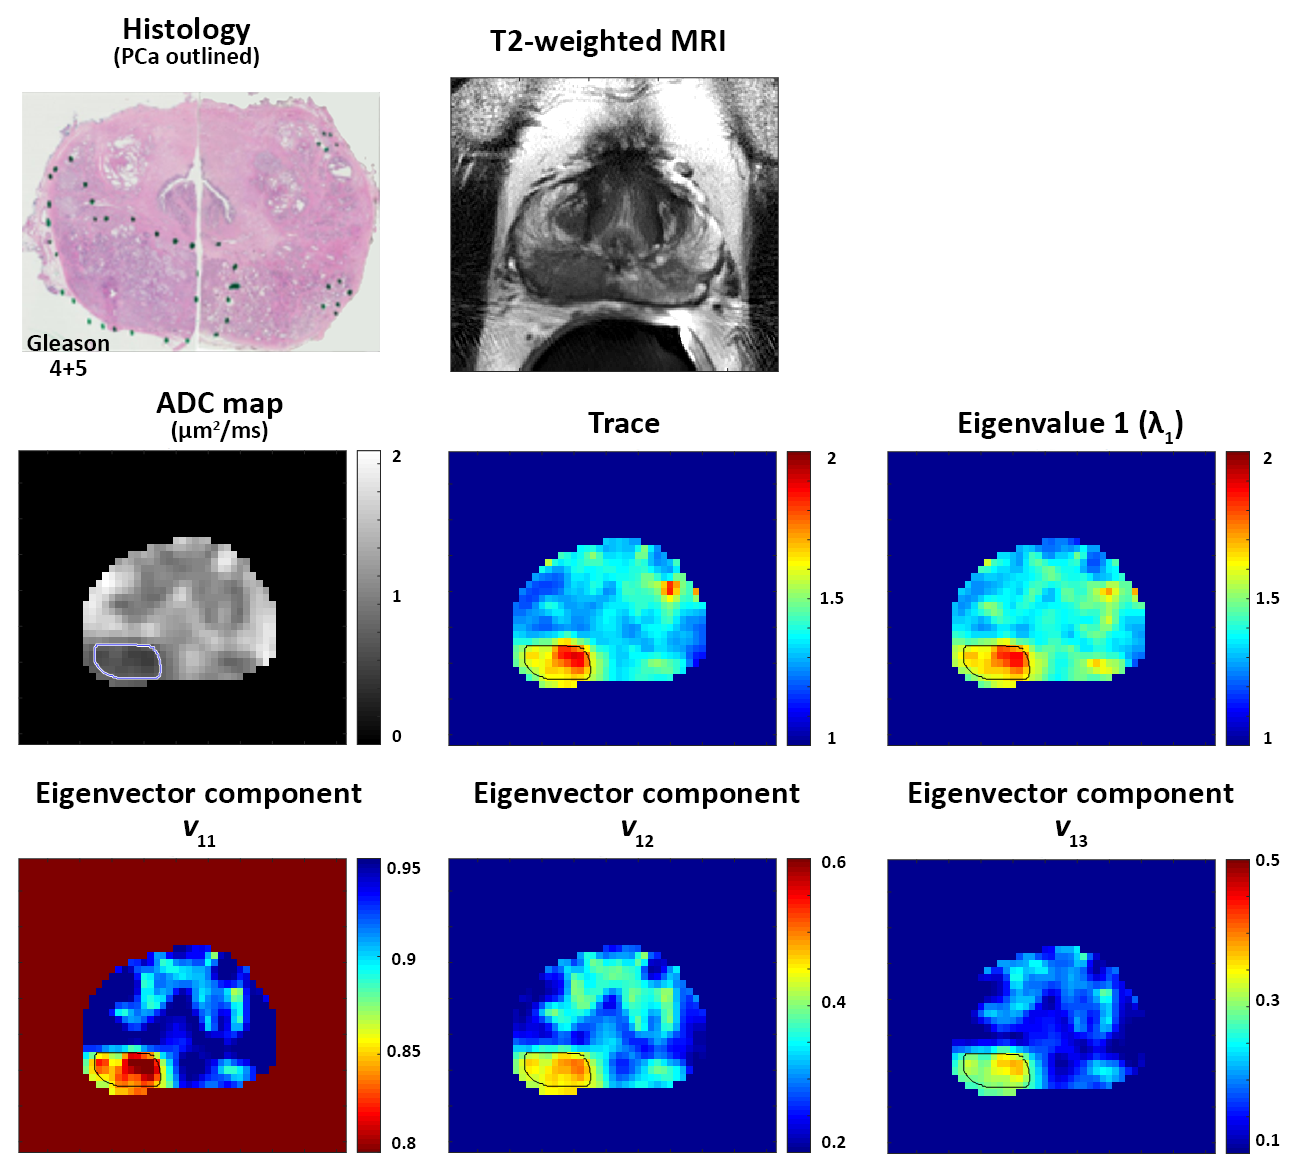
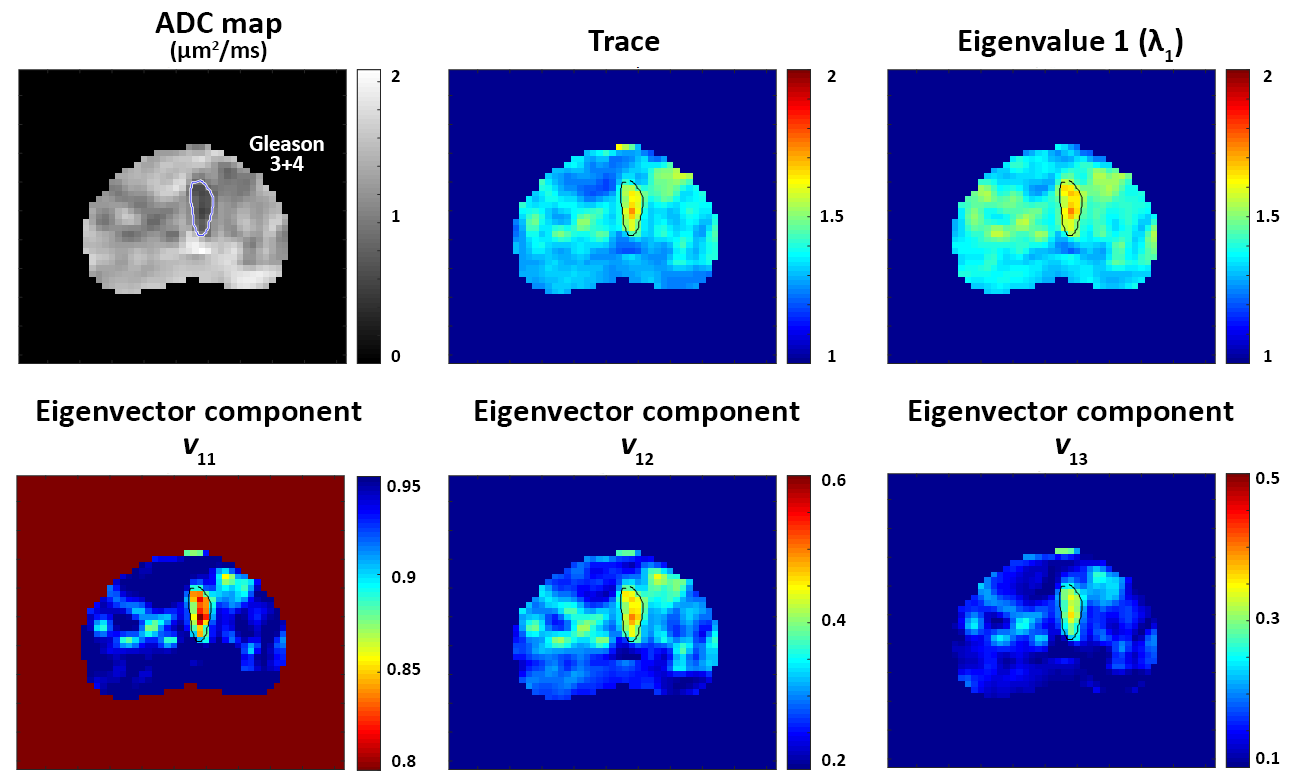
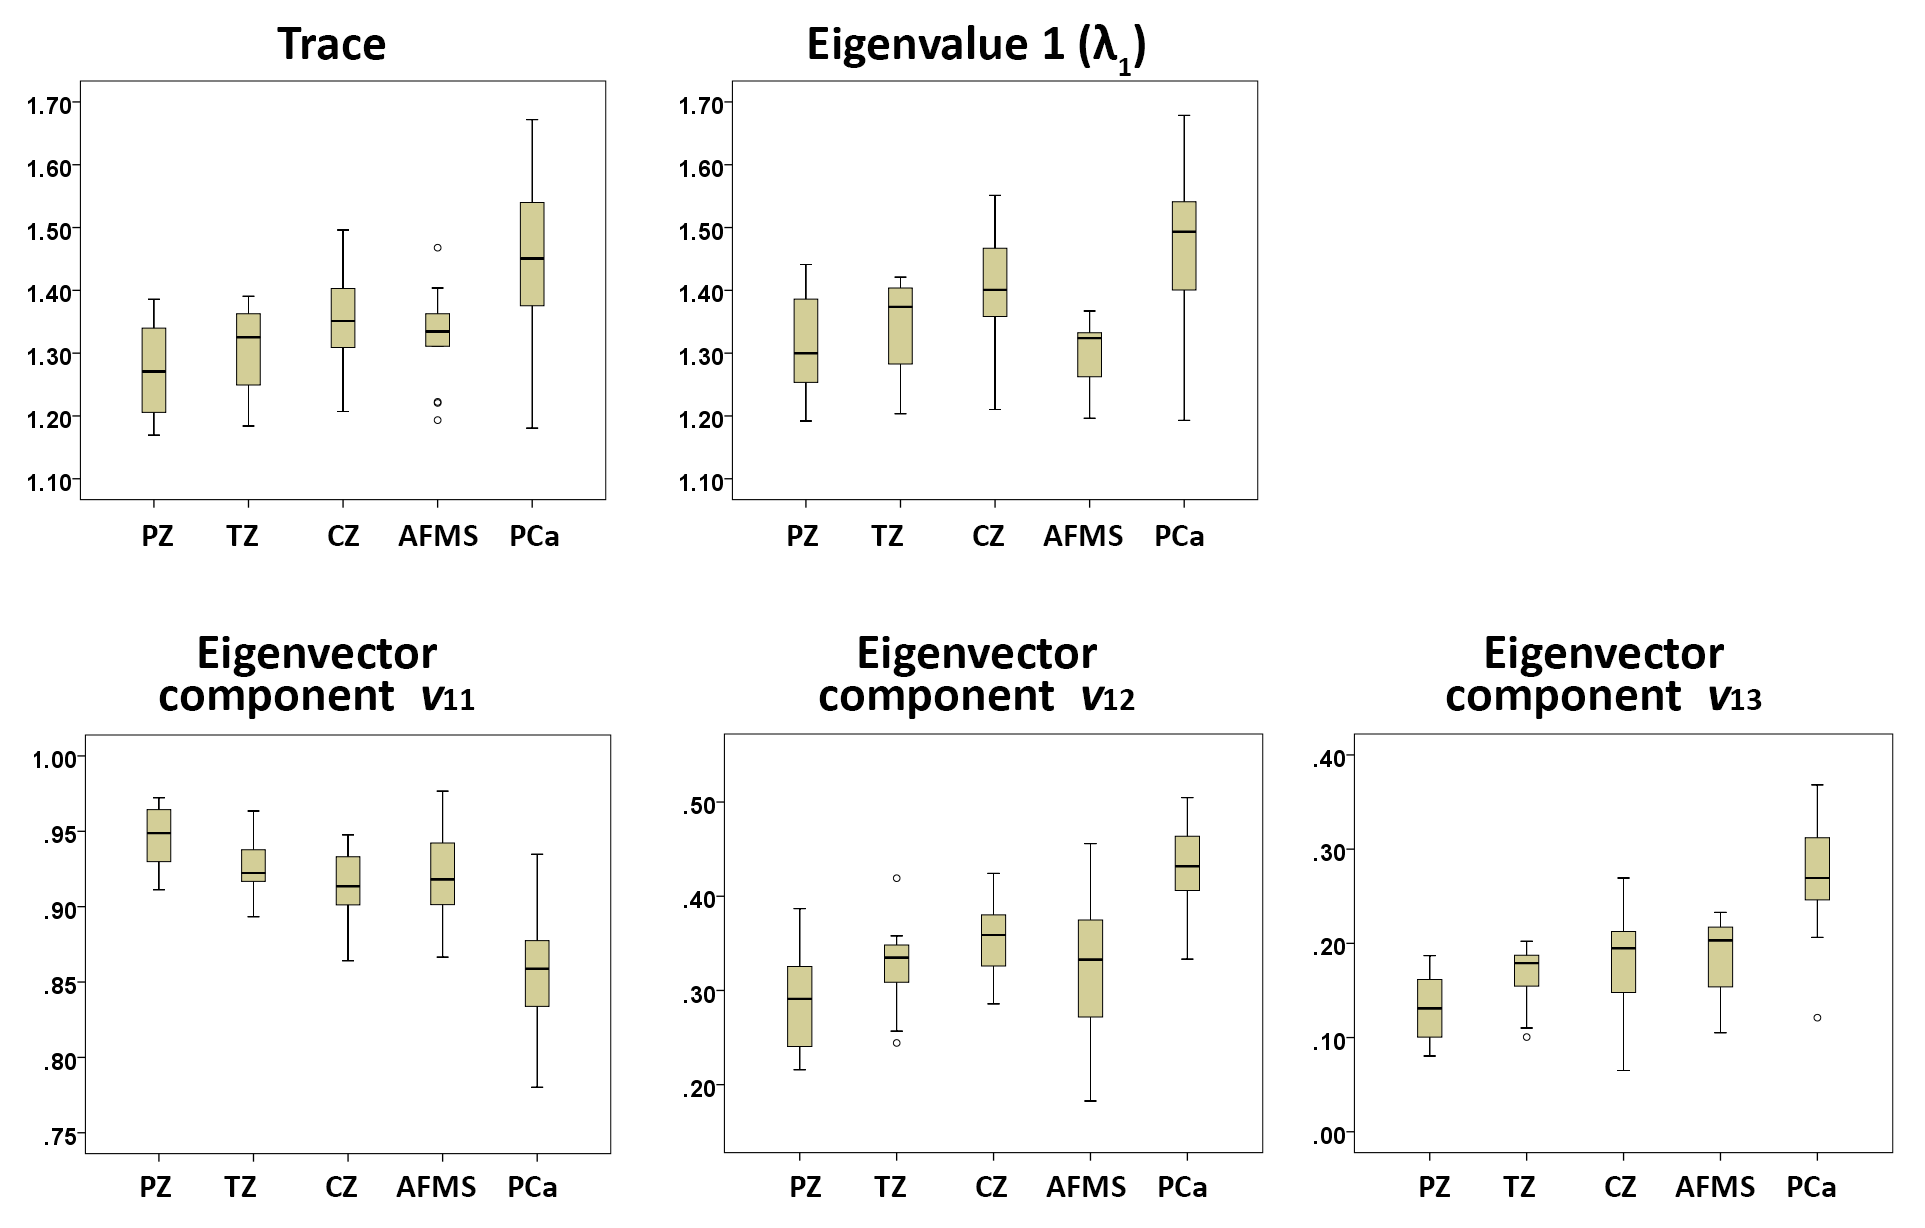
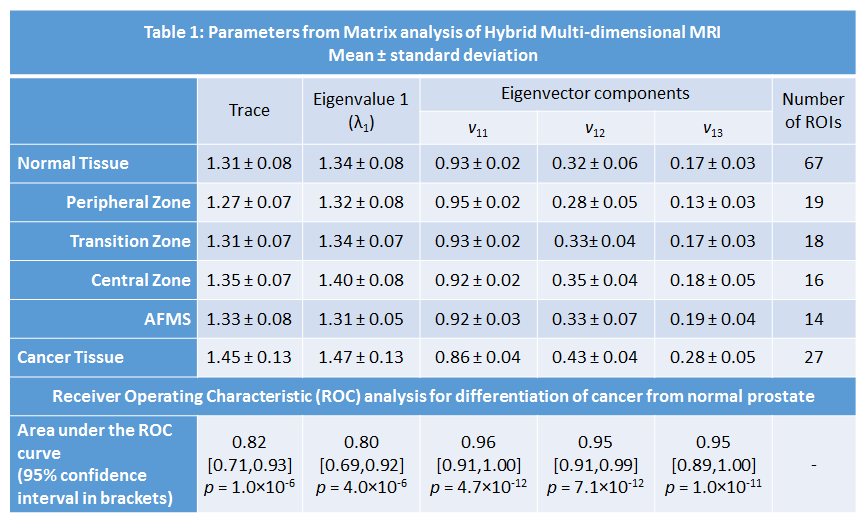
Figures 2 and 3 show representative examples of PCa diagnosis using matrix analysis of HM-MRI data. The matrix analysis of 3×3 HM-MRI data show that prostate cancers have significantly (p<0.05) increased trace (1.45±0.13 vs 1.31±0.08), λ1 (1.47±0.13 vs 1.34±0.08) and eigenvector components v12 (0.43±0.04 vs 0.32±0.06) and v13 (0.28±0.05 vs 0.17±0.03) compared to normal tissue, whereas v11 (0.86±0.04 vs 0.93±0.02) was significantly reduced in prostate cancer. However, post-hoc analysis did not find any significant difference between trace and λ1 of PCa and normal tissue in the central zone (see box plots on Figure 4). Detailed results are shown in Table 1.
ROC analysis showed matrix analysis parameters provide very good differentiation between PCa and benign prostatic tissue. Area under the ROC curve (AUC) for differentiation of cancer from normal prostate was highest for eigenvector components (0.95-0.96), followed by trace of the matrix (0.82), and eigenvalue (0.80).
Discussion
The results show that PCa diagnosis is feasible using matrix analysis of HM-MRI data with parameters showing good differentiation between PCa and benign prostatic tissue evidenced by ROC analysis showing high AUC values. The matrix parameters, specifically eigenvector components, are highly effective in diagnosing PCa in the transition and central zones where PCa diagnosis is limited using conventional MRI. In addition, the computation time required for this analysis is significantly lower than for conventional ADC and T2 mapping.
In T2W imaging, PCa loses signal more rapidly with increased TE, while in diffusion weighted imaging normal tissue loses signal more rapidly with increased b-value. The trace of the HM-MRI matrix measures the relative loss of signal with increasing TE and b-value. For this specific imaging protocol, PCa showed higher trace than benign tissue, suggesting the relatively higher loss of signal in PCa compared to benign tissue. This may be due to the larger range of b-values used compared to TE. In the future, a truncated sequence with just the diagonal elements could potentially be used for guiding biopsies and focal therapy.
Conclusion
This study shows that PCa diagnosis is feasible using matrix analysis of HM-MRI data with parameters showing good differentiation between PCa and benign prostatic tissue. In the future, matrix analysis of HM-MRI could be used to guide biopsy and reliably reduce false positives due to benign features such as BPH.Acknowledgements
The study was funded by Philips Healthcare, The University of Chicago Medicine Comprehensive Cancer Center and National Institutes of Health (NIH R01 CA172801 and NIH 1S10OD018448-01).References
1. Kitzing YX, Prando A, Varol C, Karczmar GS, Maclean F, Oto A. Benign Conditions That Mimic Prostate Carcinoma: MR Imaging Features with Histopathologic Correlation. RadioGraphics 2016;36(1):162-175.
2. Sadinski M, Karczmar G, Peng Y, Wang S, Jiang Y, Medved M, Yousuf A, Antic T, Oto A. Pilot Study of the Use of Hybrid Multidimensional T2-Weighted Imaging–DWI for the Diagnosis of Prostate Cancer and Evaluation of Gleason Score. American Journal of Roentgenology 2016;207(3):592-598.
3. Wang S, Peng Y, Medved M, Yousuf AN, Ivancevic MK, Karademir I, Jiang Y, Antic T, Sammet S, Oto A, Karczmar GS. Hybrid multidimensional T2 and diffusion‐weighted MRI for prostate cancer detection. Journal of Magnetic Resonance Imaging 2014;39(4):781-788.
Figures