2868
Spatially regularized multi-exponential transverse relaxation times estimation from magnitude MRI images under Rician noise.1ECN, LS2N UMR CNRS 6004, Nantes, France, 2IRSTEA, UR OPAALE, Rennes, France
Synopsis
This work aims at improving the estimation of multi-exponential transverse relaxation times from noisy magnitude MRI images. A spatially regularized Maximum-Likelihood estimator accounting for the Rician distribution of the noise was introduced. This approach is compared to a Rician corrected least-square criterion with the introduction of spatial regularization. To deal with the large-scale optimization problem, a majoration-minimization approach was used, allowing the implementation of both the maximum-likelihood estimator and the spatial regularization. The importance of the regularization alongside the rician noise incorporation is shown both visually and numerically on magnitude MRI images acquired on fruit samples.
Purpose
Multi-exponential relaxation times $$$T_2$$$ and their associated amplitudes $$$I_0$$$ in an MRI image provide very useful information for assessing the constituents of the imaged sample. Typical examples are the detection of water compartments of plant tissues1 and the quantification of myelin water fraction for multiple sclerosis disease diagnosis2 . The estimation of the multi-exponential signal model from magnitude MRI images faces the problem of a relatively low signal to noise ratio (SNR), with a Rician distributed noise and a large-scale optimization problem when dealing with the entire image. Actually, $$$T_2$$$ maps are composed of coherent regions with smooth variations between neighboring voxels. This study proposes an efficient reconstruction method of $$$T_2$$$ values and amplitudes from magnitude images by incorporating this information in order to reduce the noise effect. The main feature of the method is to use a regularized maximum likelihood estimator derived from a Rician likelihood and a Majorization-Minimization approach coupled with the Levenberg-Marquardt algorithm to solve the large-scale optimization problem. Tests were conducted on apples and the numerical results are given to illustrate the relevance of this method and to discuss its performances.
Methods
For each voxel $$$j$$$ of the MRI image, the measured signal $$$y_j(\tau)$$$ at echo time $$$\tau$$$ is represented by a multi-exponential model:
$$M_j(\tau,\theta _j)=\sum_{c=1}^{N_c}I_{0_{(c,j)}} e^{-\frac{\tau}{T_{2_{(c,j)}}}}$$
with $$$\theta_j=[I_{0_{(1,j)}},T_{2_{(1,j)}}...I_{0_{(N_c,j)}},T_{2_{(N_c,j)}}]$$$
The data are subject to an additive Gaussian noise in the complex domain and therefore magnitude MRI data follows a Rician distribution3:
$$P_{Rician}\left(y_j\left(\tau\right),M_j\left(\tau,\theta _j\right),\sigma\right)=\frac{y_j\left(\tau\right)}{\sigma^2}e^{-\left[\frac{y_j\left(\tau\right)^2+M_j\left(\tau,\theta _j\right)^2}{2\sigma^2}\right]}J_0\left(\frac{y_j\left(\tau\right)M_j\left(\tau,\theta _j\right)}{\sigma^2}\right)$$
$$$J_0$$$ is the first kind modified Bessel function of order 0 and $$$\sigma$$$ is the standard deviation of the noise which is usually estimated from the image background.
For an MRI image with $$$N_v$$$ voxels, the model parameters are usually estimated by minimizing the least-squares (LS) criterion $$$\sum_{j=1}^{N_v}\left\| y_j\left(\tau\right)-M_j\left(\tau,\theta _j\right) \right\|_2^2$$$ under the assumption of a Gaussian noise using nonlinear LS solvers such as Levenberg-Marquardt (LM). However, this approach does not yield satisfying results when applied to magnitude data5. Several solutions to overcome this issue are proposed by adding a correction term to the LS criterion3,4. In this study, the retained correction uses the expectation value of data model under the hypothesis of Rician distribution5 since it outperforms the other correction strategies:
$$J_{RCLS}=\sum_{j=1}^{N_v}\left\| y_j\left(\tau\right)-E_{rice}\left[M_j\left(\tau,\theta _j\right),\sigma \right] \right\|^2_2,$$
$$$\|\cdot\|^2_2$$$ stands for the sum of squares. We refer to this method as Rician corrected LS (RCLS).
A more direct way for solving this estimation problem is to use a maximum likelihood (ML) estimator5 which comes down to minimize:
$$J_{ML}=\sum_{j=1}^{N_v}\sum_{\tau=\tau_0}^{\tau_n}\left[\frac{M_j\left(\tau,\theta _j\right) ^2}{2\sigma^2}-\log\left( J_0\left(\frac{y_j\left(\tau\right)M_j\left(\tau,\theta _j\right)}{\sigma^2}\right)\right)\right].$$
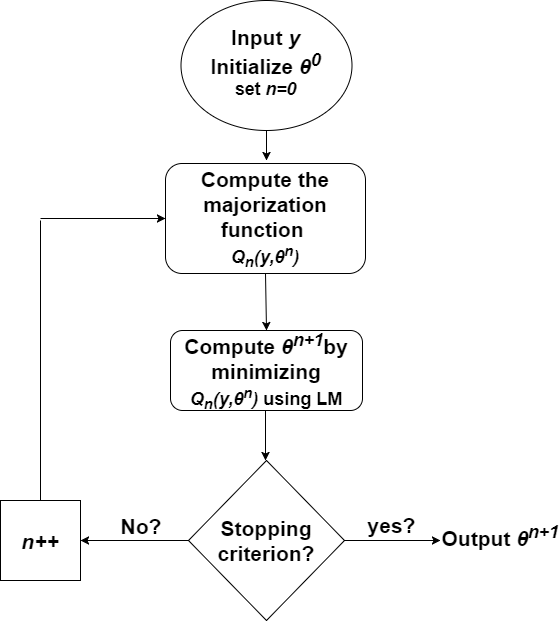
To solve this optimization problem when dealing with the entire image, a majorization-minimization (MM) technique was adopted6. The resulting MM-ML algorithm is summarized in figure 1, the LM algorithm used in this method minimizes a set of LS criteria derived from the quadratic majorization strategy.
A spatial regularization term based on a cost function $$$\psi(\theta_j(i)-\theta_k(i))$$$ was also added to both criteria ($$$J_{ML}$$$ and $$$J_{RCLS}$$$) to ensure spatial smoothness of the estimated maps. In order to reduce the numerical complexity by maintaining variable separability between each voxel $$$j$$$ and it's neighboring voxels $$$k$$$, the function $$$\psi$$$ is majorized by7 :
$$\psi(\theta_j(i)-\theta_k(i)) \leq \frac{1}{2}\psi(2\theta_j(i)-(\theta_j^n(i)+\theta_k^n(i)))+\frac{1}{2}\psi(2\theta_k(i)-(\theta_j(i)^n+\theta_k(i)^n)) \ for \ i=1,2...2*N_c$$
where $$$n$$$ stands for the iteration number of the iterative optimization algorithm.
The criterion to be minimized at each iteration $$$n$$$ of the MM algorithm is thus given by :
$$(J_{RCLS} \ or \ J_{ML})+\sum_{i=1}^{2*Nc}\sum_{j=1}^{Nv}\sum_{k\in V_j}\beta(\theta(i))\psi(2\theta_{j}(i)-(\theta_{j}(i)^n+\theta_{k}(i)^n))$$
$$$V_j$$$ contains the indices of voxel $$$j$$$'s neighboors
The resulting methods are refereed to by RCPLS and MM-PML. The regularization function $$$\psi$$$ and the weight vector $$$\beta$$$ should be adapted to each problem.
Results
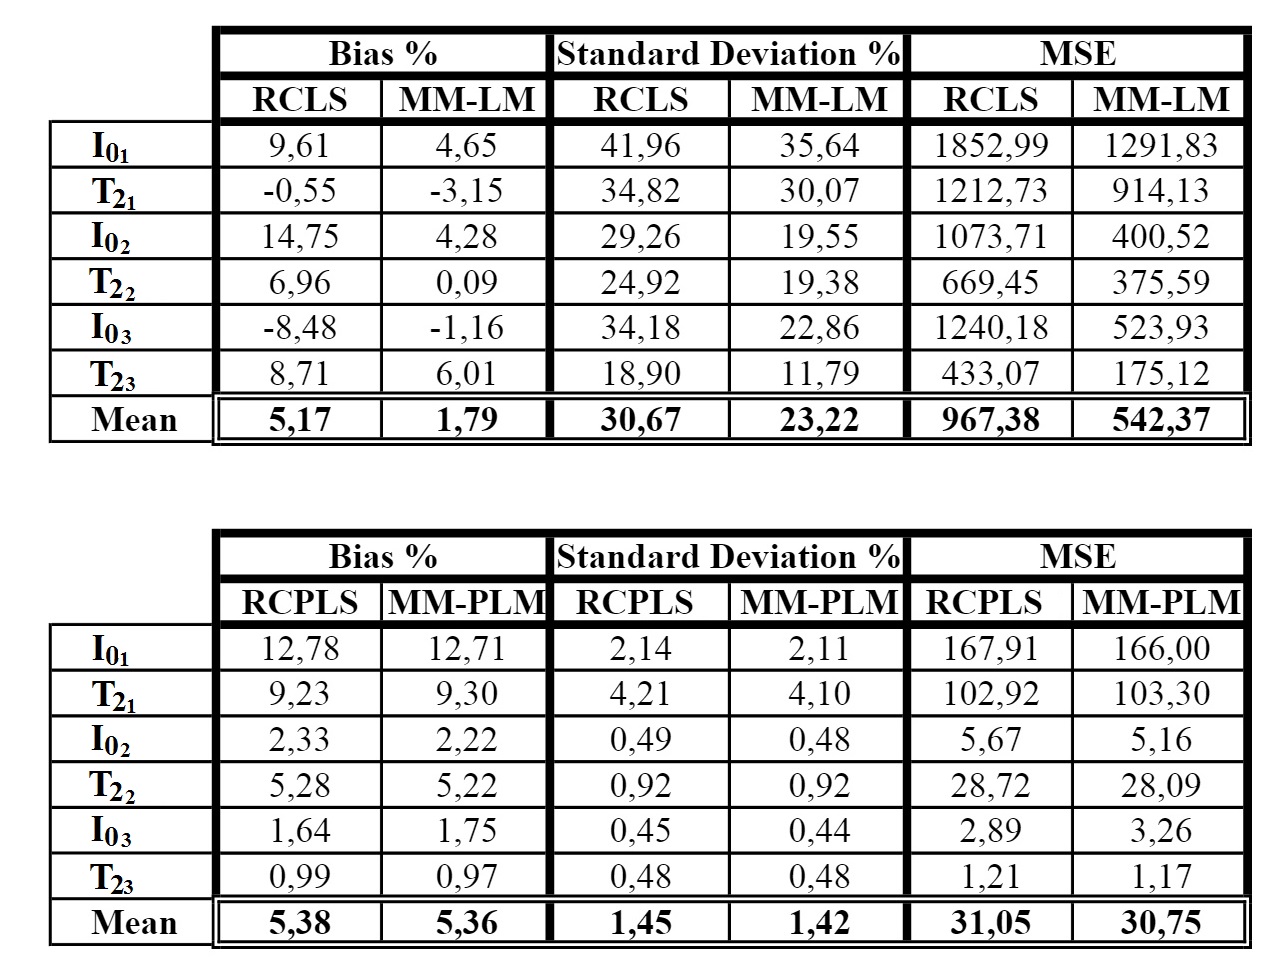
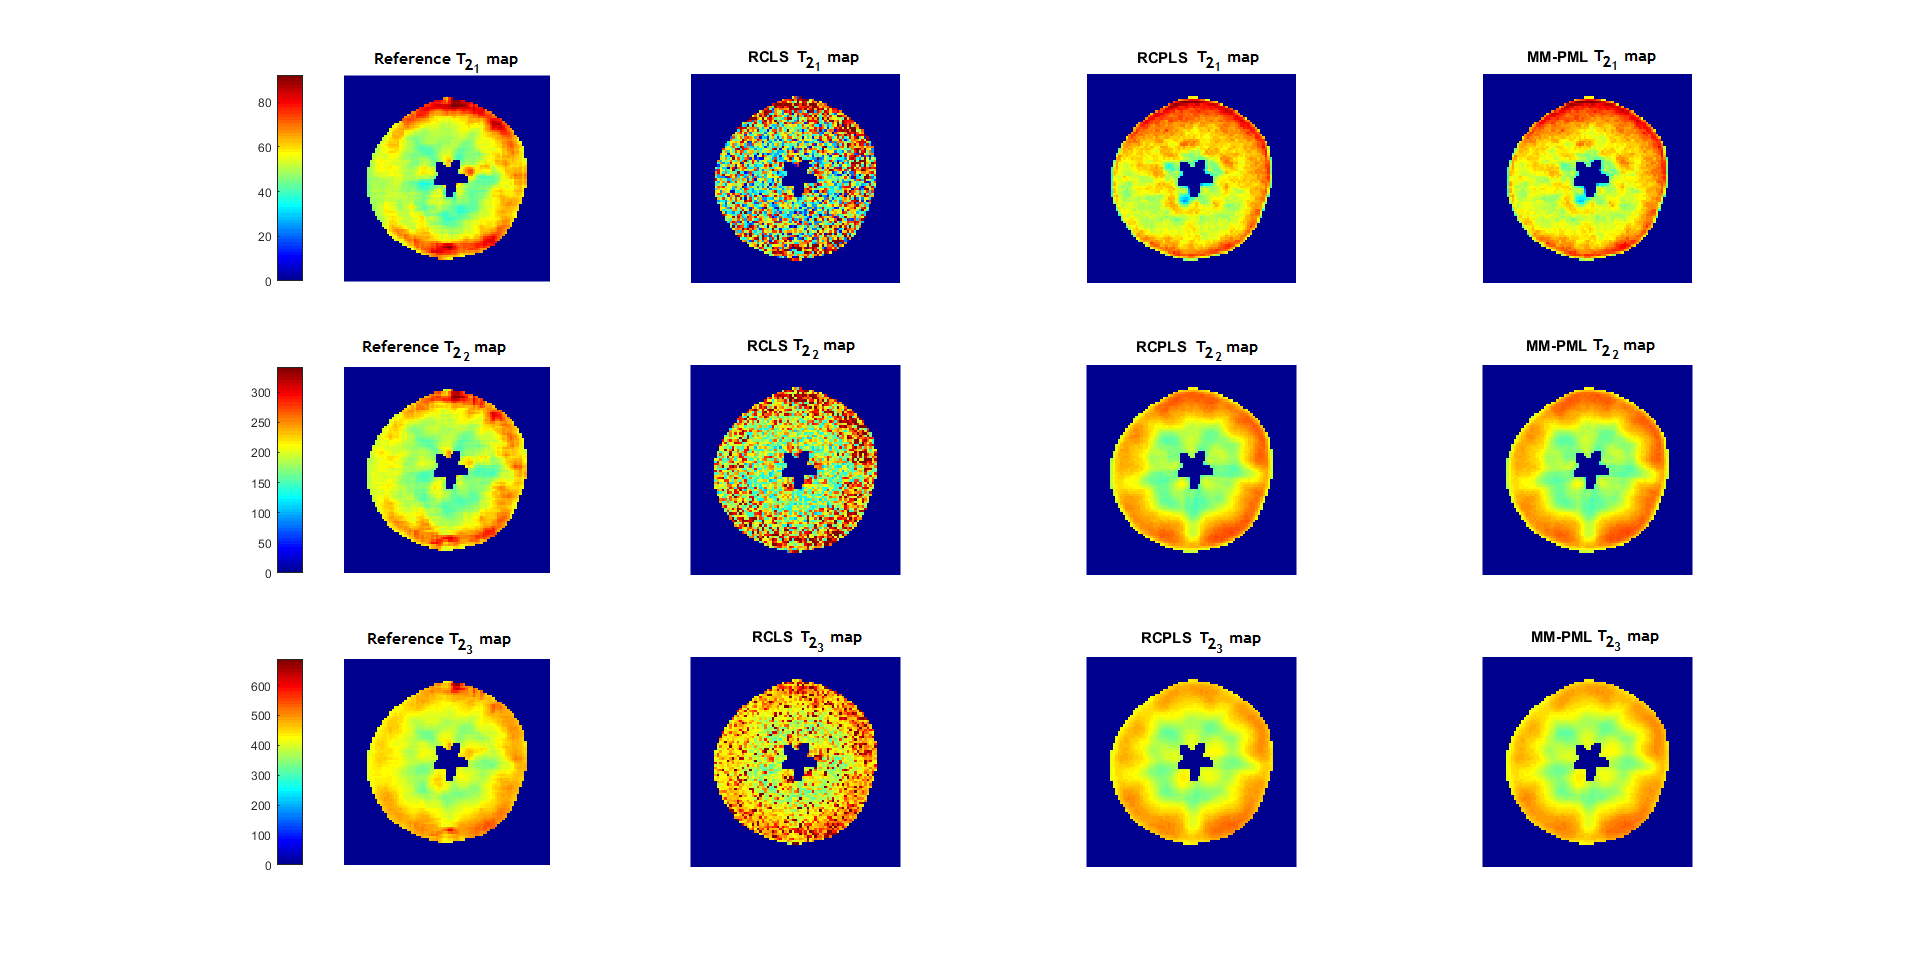
We first acquired very high SNR images (128*128 voxels) on an apple with a 1.5T MRI (Avanto, Siemens) using a multiple-spin echo sequence8 allowing the acquisition of up to 512 echo times per relaxation decay. Then we estimated the reference tri-exponentiels $$$T_2$$$ and $$$I_0$$$ maps which were used afterwards for 100 Monte-Carlo signal simulations with a SNR of 108. Four methods were compared : RCLS, MM-ML, RCPLS and MM-PML. A quadratic penalty function $$$\psi$$$ was used with $$$\beta=0.16*10^{-2}$$$ for all the variables. Figure 2 gives the relative bias, the relative standard deviation and the relative MSE per parameter. Figure 3 shows the reference $$$T_2$$$ maps and the estimated ones.
Results in figure 2 show that even though the bias is higher in the regularized version, the standard deviation was reduced significantly yielding to lower MSE. Figure 3 confirms the results by showing that the regularized version yields to visually better results. The fruit structures can thus be identified, and the $$$T_2$$$ maps are no longer drowned in the noise.
Concerning the numerical complexity, the MM-PML algorithm ran faster (41.5 s) than the RCPLS (107.96 s).
Acknowledgements
Christian EL HAJJ was supported in part by a scholarship from Brittany Region (France)
The work is funded by the GDR 720 ISIS as part of a call for exploratory projects 2016
References
1. Winisdorffer G, Musse M, Quellec S, Devaux MF, Lahaye M, Mariette F. MRI investigation of subcellular water compartmentalization and gas distribution in apples. Magnetic Resonance Imaging. 2015;33(5):671-80.
2. MacKay A, Laule C, Vavasour I, Bjarnason T, Kolind S, Mädler B. Insights into brain microstructure from the $$$T_2$$$ distribution. Magnetic Resonance Imaging. 2006 ;24(4):515-25.
3. McGibney G, Smith MR, Nichols ST, Crawley A. Quantitative evaluation of several partial Fourier reconstruction algorithms used in MRI. Magnetic Resonance in Medicine. 1993;30(1):51-9.
4. Gudbjartsson H, Patz S. The Rician distribution of noisy MRI data. Magnetic Resonance in Medicine. 1995 Dec 1;34(6):910-4.
5. Karlsen OT, Verhagen R, Bovée WM. Parameter estimation from Rician‐distributed data sets using a maximum likelihood estimator: Application to $$$T_1$$$ and perfusion measurements. Magnetic Resonance in Medicine. 1999 ;41(3):614-23.
6. Varadarajan D, Haldar JP. A majorize-minimize framework for Rician and non-central chi MR images. IEEE Transactions on Medical Imaging. 2015 ;34(10):2191-202.
7. Erdogan H, Fessler JA. Ordered subsets algorithms for transmission tomography. Physics in Medicine and Biology. 1999 ;44(11):2835
8. Adriaensen H, Musse M, Quellec S, Vignaud A, Cambert M, Mariette F. MSE-MRI sequence optimisation for measurement of bi-and tri-exponential $$$T_2$$$ relaxation in a phantom and fruit. Magnetic Resonance Imaging. 2013;31(10):1677-89
Figures