2867
A Tailored Functional Form for Increased Accuracy in CEST B1 Calibration Curves1Graduate Group in Biochemistry and Biophysics, Perelman School of Medicine, University of Pennsylvania, Philadelphia, PA, United States, 2Center for Magnetic Resonance and Optical Imaging, Perelman School of Medicine, University of Pennsylvania, Philadelphia, PA, United States, 3Department of Radiology, Perelman School of Medicine, University of Pennsylvania, Philadelphia, PA, United States
Synopsis
Correction for the amplitude of B1 (RF pulse) in CEST experiments is currently done using calibration curves fitted ad hoc with polynomial functions. We have previously found that these polynomial-based correction curves sometimes produce unreasonable results, especially in measurements with large B1 variation. Here, we use Bloch-McConnell simulations of CEST as a function of B1 strength to demonstrate a new, Lorentzian-type functional form and fitting strategy, expected to lead to an increase in both accuracy and precision in processing of CEST data.
Introduction
Chemical Exchange Saturation Transfer (CEST) magnetic resonance imaging aims to quantify the concentration of small molecules of biochemical importance1. The accuracy of the measurements depends on the ability to correct for, among other factors, the variability in B1 field strength throughout the field of view. A pragmatic strategy for B1 correction developed and used in our group has relied on fitting experimentally measured CEST contrast data with polynomial functions2. While this method was an improvement over more simplistic approaches, it sometimes produced results inconsistent with known or hypothesized physiology. We were thus motivated to use Bloch-McConnell simulations of CEST contrast to assess the theoretical accuracy of this polynomial fit and potentially improve upon it.Theory
As a potential alternative to the polynomial, we tested the strategy of fitting to a functional form composed of Lorentzian-like terms, based loosely on a theoretical treatment of CEST signal contributions3. This first attempt at a “multi-quasi-Lorentzian” (MQL) fit uses 18 parameters that include one direct saturation term (2 parameters), one MT term ( 4 parameters) and three terms of the ‘CEST’ type, each with 4 parameters.
$$Y_{Total} = Y_{DS}+\sum_{i=1}^3 Y_{CEST_i} +Y_{MT} $$ (1)
where $$Y_{CEST_i}= \frac{A_{i} (x^2+ B_i)}{C_{i} x^4+ D_{i} x^2} $$ (1a)
$$Y_{DS}=\frac{A_D}{A_D+B_D x^2 } $$ (1b)
$$Y_{MT}= \frac{A_M}{B_M x^4+ C_M x^2+D_M} $$ (1c)
In the equations shown, “Y” represents the signal in either the positive or negative offset experiment, and “x” represents the strength of the B1 field. A, B, C, D represent only numerical fit parameters; at this point we are interested only reproduction of the CEST(B1) functional form, and are not attempting to extract physical parameters from the fit parameters.
Results
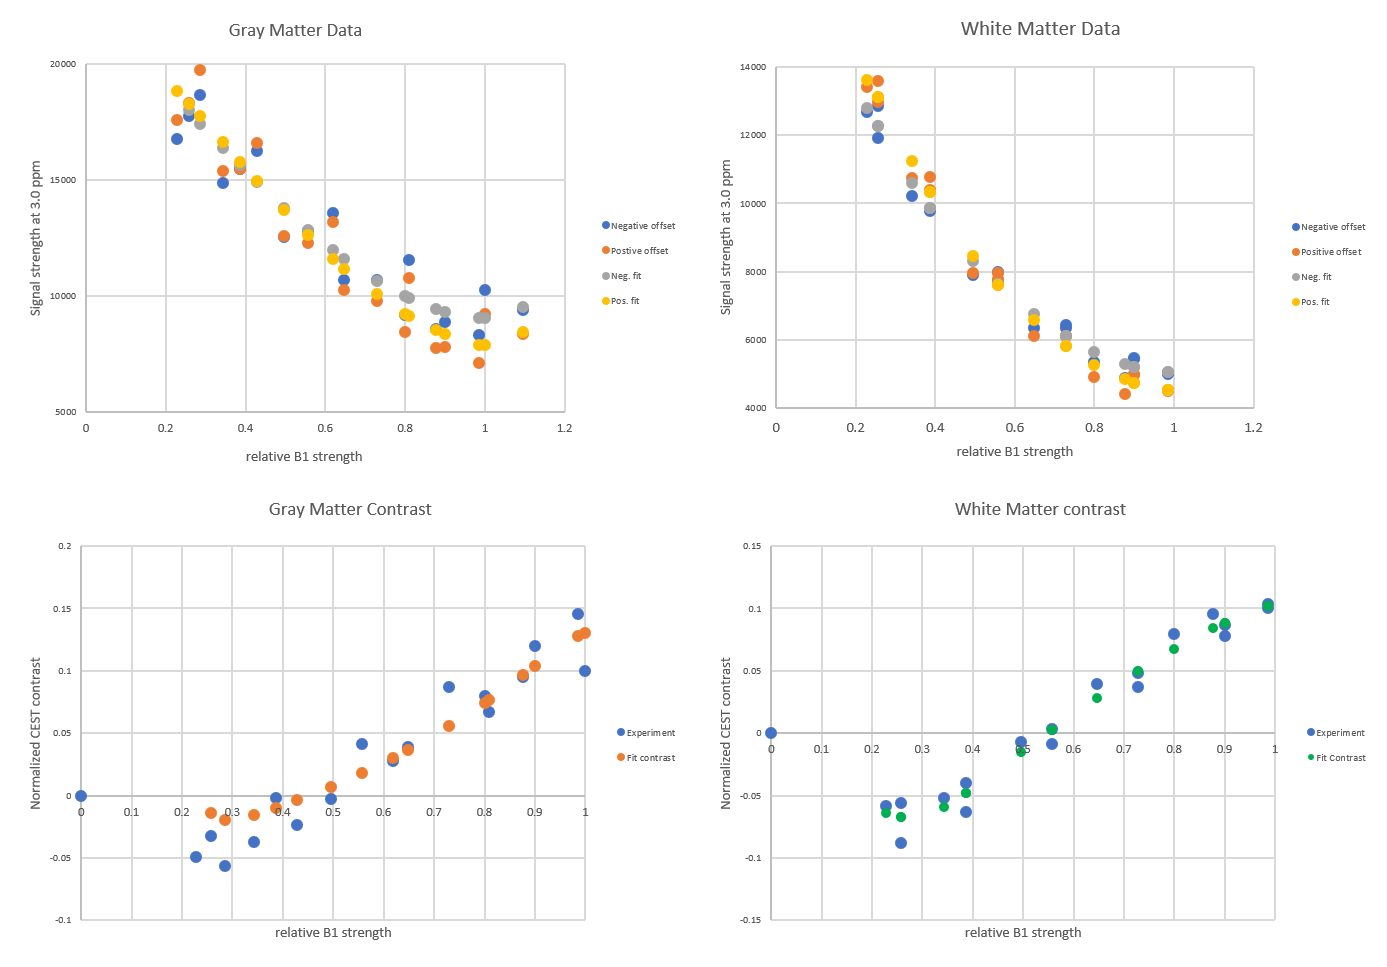
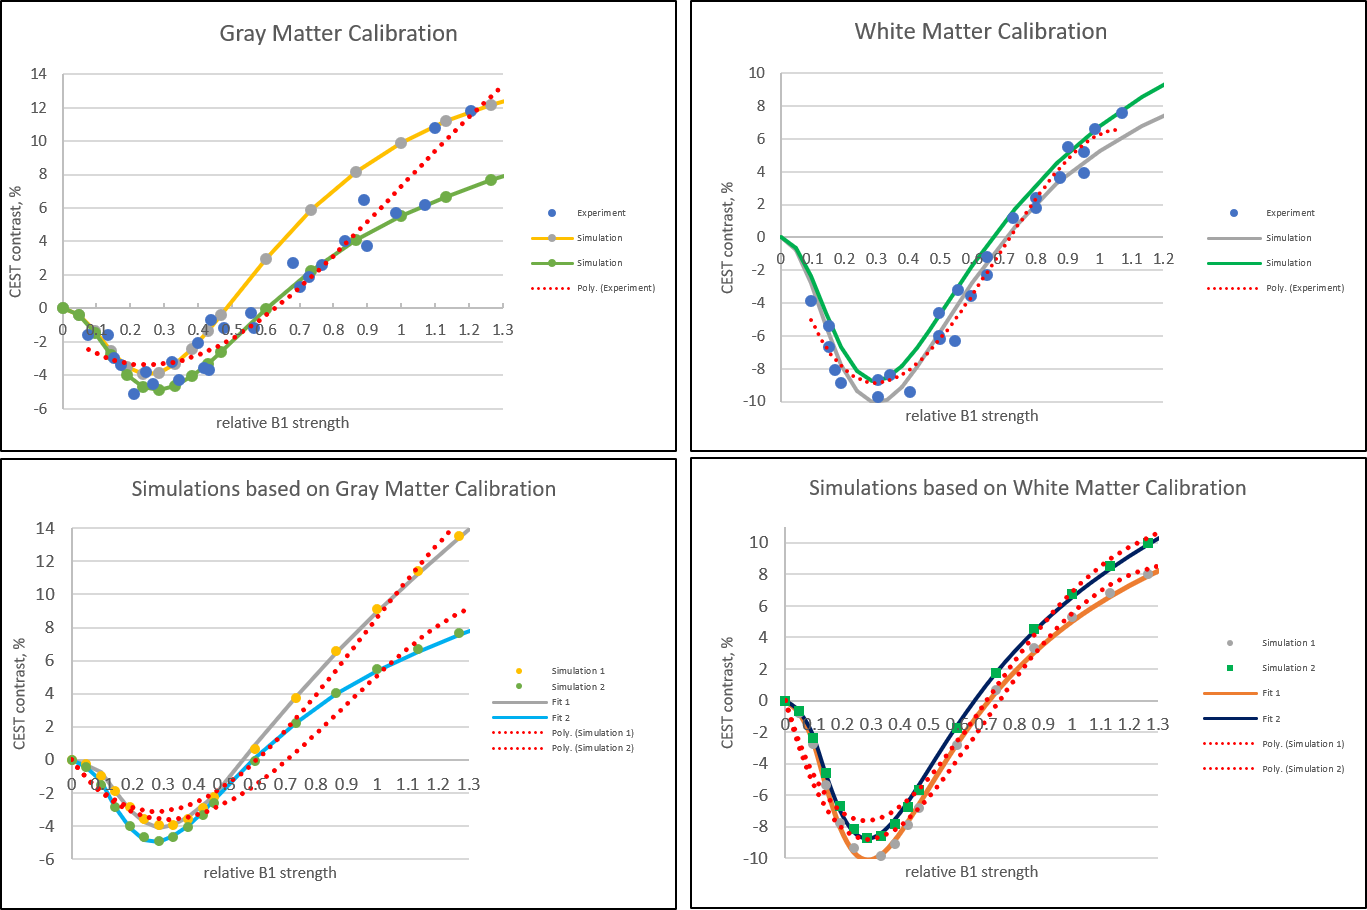
Our simulations showed that, while polynomial functions may be suitable under certain conditions, they are not generally appropriate to fit CEST signal as a function of B1 strength -- either with respect to the individual positive/negative offset measurements, or the contrast calculated from their difference. Since our working protocol for generating B1 calibration curves involves integrating data from several different regions of interest (ROIs), the statistically “good” fit of a polynomial may be a deceptive result when heterogeneity is averaged by the numerically robust polynomial fit. ‘Noisy’ data from a single experimental curve may in fact represent physically diverse ROIs for which B1 calibration needs to be done separately (figure A, top). This variability between ROIs was not taken into account by the previous polynomial fits.
We find that this MQL fit is far superior to the polynomial fit at reproducing the functional form of simulated CEST (B1) (Figure A, bottom). In contrast to the polynomial fit, the MQL fit requires treating the positive and negative offset data separately and directly, and will not tolerate erroneous concatenation of data from dissimilar ROIs. We reexamined two sets of experimental data from two different scanners using the MQL fit. At each scanner, data from five gray matter ROIs and five white matter ROIs were collected at six different set B1 strengths. The values of the set B1 were corrected for each ROI by multiplying by its relative B1, as measured separately in a B1 map.
When they were originally collected and processed, all four resulting B1 calibration curves appeared to give a reasonably good fit to a third-order polynomial. However, it was clear from examination of the negative and positive offset data that in some cases, ROIs treated as equivalent examples of gray or white matter in fact represented distinct physical environments (figure B, top). The success of the MQL fit to the data directly reflected the homogeneity or lack thereof of the measurements (figure B, bottom). This finding supports the proposition that the MQL fit represents an improved functional form for a CEST(B1) curve but that current experimental ‘curves’ are actually composites of multiple single functions.
Indications for Future Work
We intend now to collect full calibration curve measurements from single ROIs, rather than assume the identity of different ROIs to the categories ‘gray matter’ or ‘white matter’. We anticipate this data to result in high-quality fits using MQL. This will confirm the correctness of the MQL fit, and open the door for creation of an ‘atlas’ of highly accurate B1 calibration curves for key ROIs in the human brain. Further work will also endeavor to narrow the MQL fitting space and map remaining fitting parameters back to physical parameters, so that a true correspondence with theory can be established.Acknowledgements
Thank you to Catherine De Brosse and Ravi P.R. Nanga for providing the B1 calibration experimental data.References
1. Kogan F, Hariharan H, Reddy R. Chemical Exchange Saturation Transfer (CEST) Imaging: Description of Technique and Potential Clinical Applications. Curr Radiol Rep. 2013; 1 (2): 102-114.
2. Singh A, Cai K, Haris M, Hariharan H, Reddy R. On B1 inhomogeneity correction of in vivo human brain glutamate chemical exchange saturation transfer contrast at 7T. Mag Res Med. 2012; 69 (3): 818- 824.
3. Zaiss M, Zu Z, Xu J, Schuenke P, Gochberg DF, Gore JC, Ladd ME, Bachert P. A combined analytical solution for chemical exchange saturation transfer and semi-solid magnetization transfer. NMR Biomed. 2015; 28: 217-230.
Figures