2856
Single Image Super-Resolution using the Similarity of Sub-Images in FREBAS Transformed Space1Research Division of Intelligence and Infromation Science, Graduate School of Engineering, Utsunomiya University, Utsunomiya, Japan
Synopsis
In this paper, we propose a new fast image interpolation method involving super-resolution effects. We use FREBAS transform to obtain multi-directional multi-resolution sub-images. By using the similarity of sub-images between different size images, sub-images beyond the Nyquist frequency is estimated using the FREBAS transformed images corresponding scaling parameter. Experiments showed that obtained images have much more sharpened structure than super resolution method based on dictionary learning. PSNR and SSIM are improved and calculation cost is very small compared to learning based method.
Purpose
We
propose a novel single image fast super-resolution (SR) without using any
learning process. Our method uses multi-directional multi-resolution sub images
and utilize the similarity of those decomposed images between two different size
images.Method
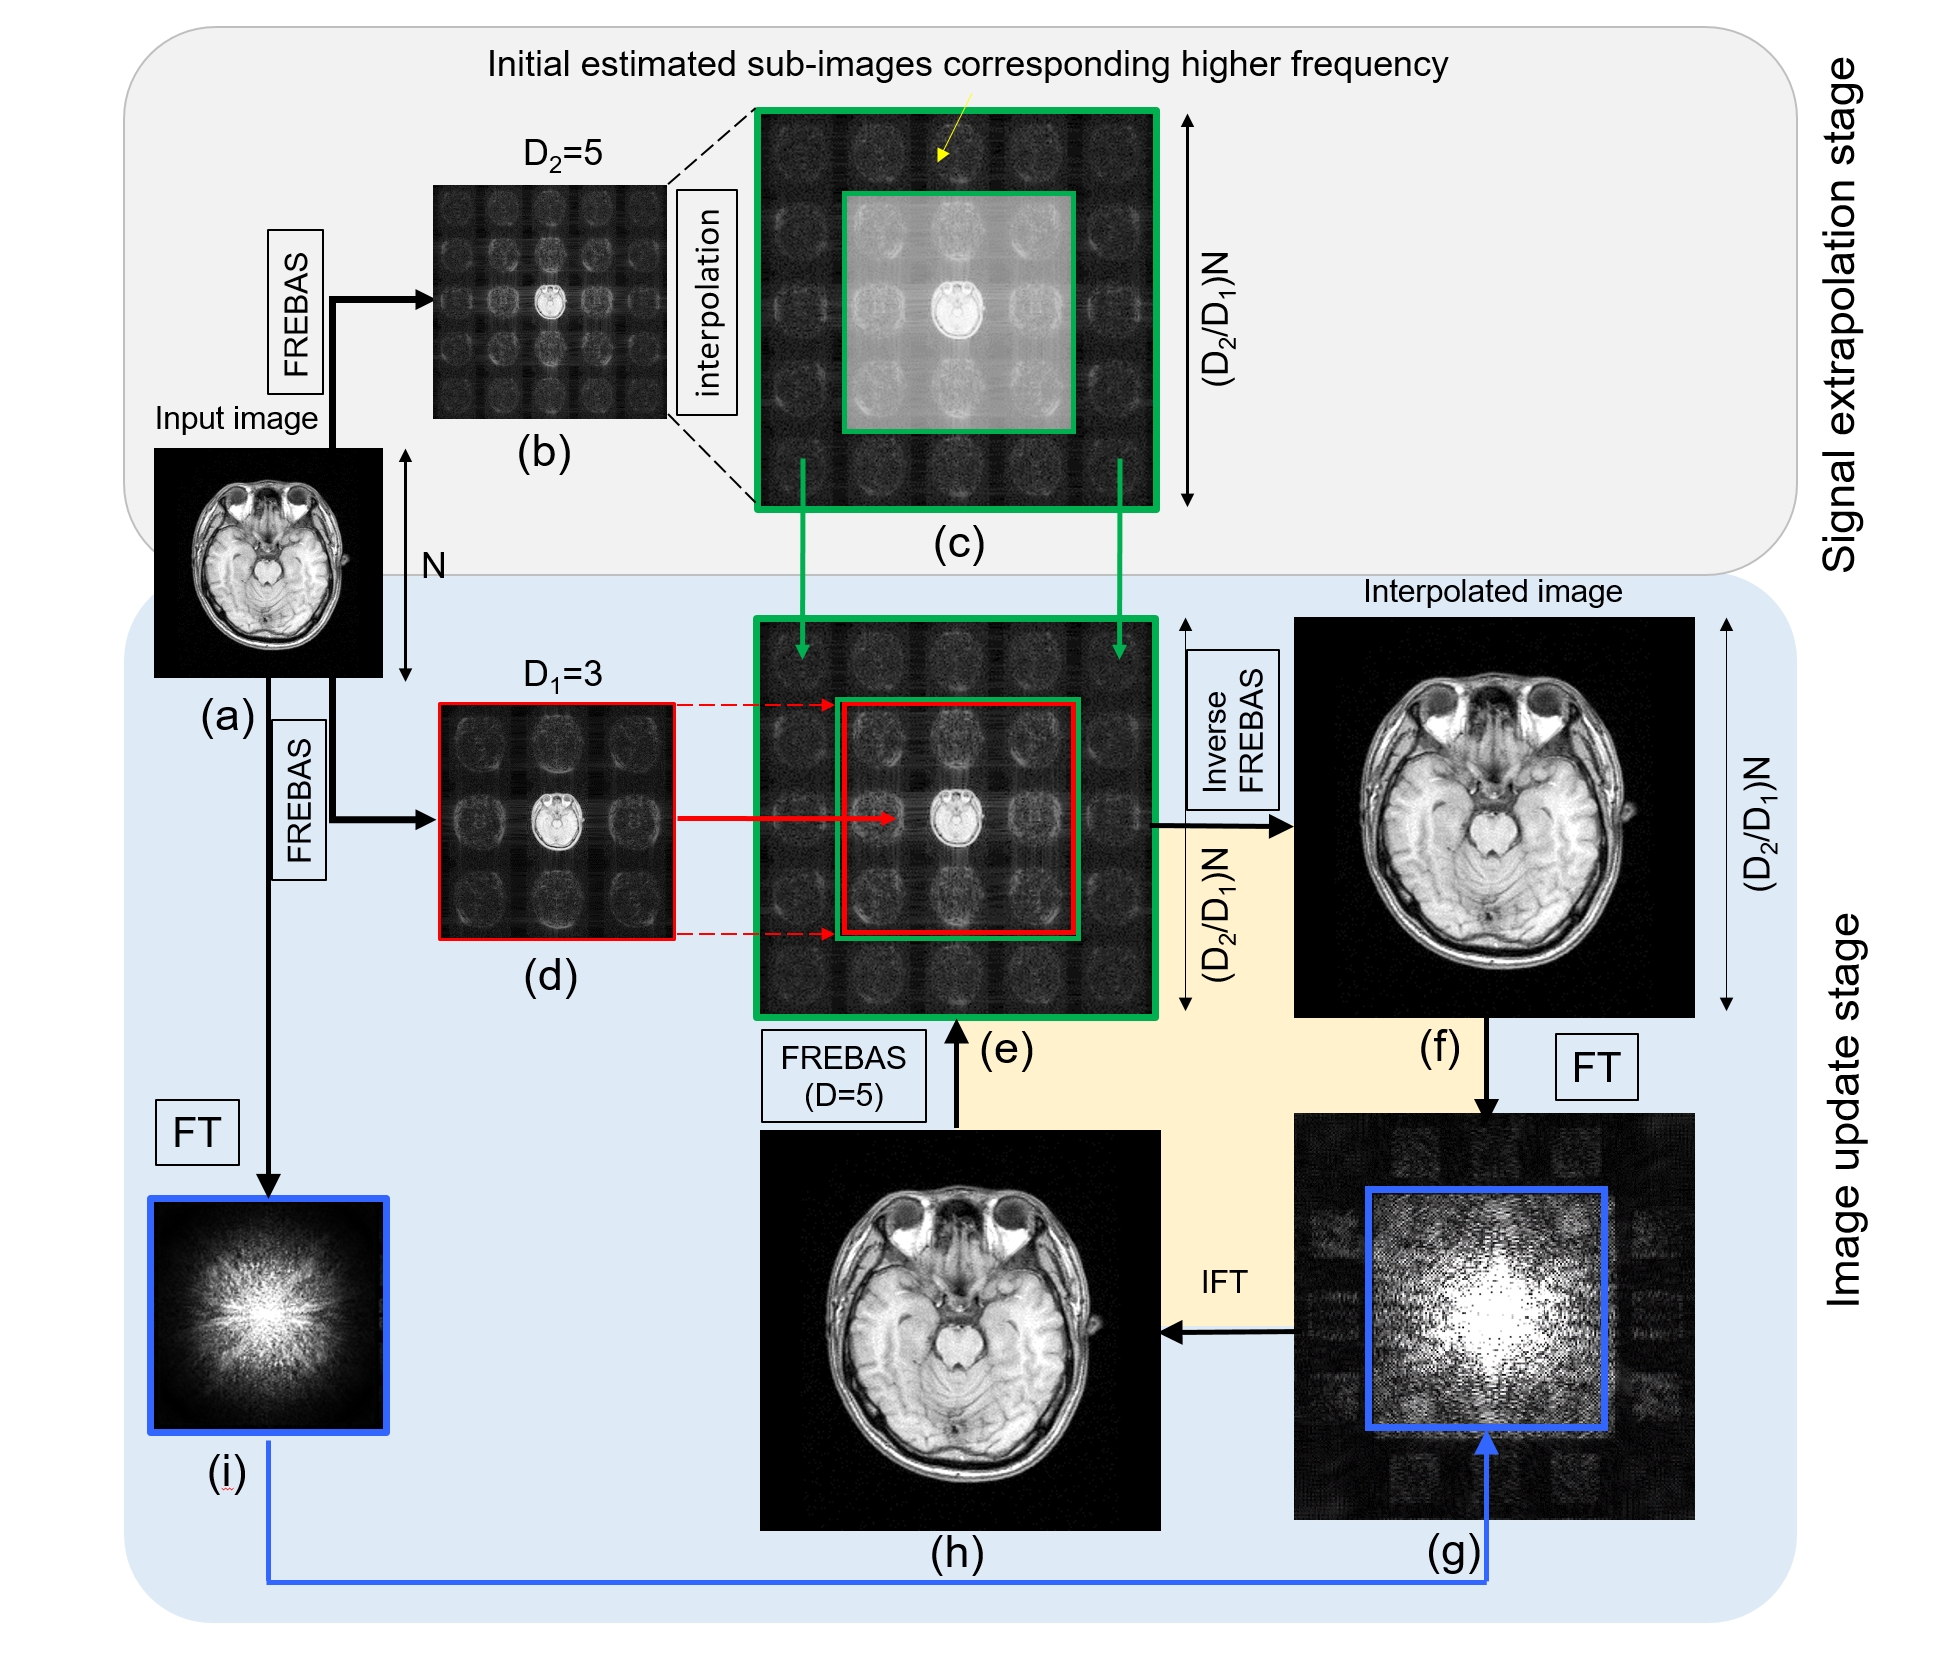
Image interpolation involving super-resolution (SR) is executed in multi-resolution image decomposed space, which we call FREBAS (Fresnel Band Split method) transform[1]. If the outer band beyond the maximum of Nyquist frequency is extrapolated, image SR will be realized. FREBAS transform with scaling parameter D decompose the input image into DxD number of sub-images, each of which corresponds to frequency band (1/D) of input image. A decomposed sub-image $$$\rho(m,x)$$$ in the FREBSAS domain can be described equivalently as a convolution integral written as: $$\rho \left( m, x \right) = \rho( x\!-\! m D \! N \! \Delta x) \ast {\rm sinc}\left( \frac{2 \pi x}{D \Delta x} \right) e^{-j \left( \frac{2 \pi m x}{D \Delta x} \right)} $$ where $$$\rho(x)$$$ an image, $$$\Delta x$$$ is the pixel width, $$$D$$$ is the scaling parameter, and $$$m$$$ is an index of sub-images. Since FREBAS transform is described as convolutional integral with object function and directional kernels, decomposed sub-images have similarity even though the size of input image is different. Figure 1 shows the FREBAS transformed signal using different size images (256, 180). Distribution of FREBAS domain sub images resembles each other as shown in Figs.(e) and (f). Figure 2 show the schematic of proposed method using a scaling parameter $$$D_1=3$$$ and $$$D_2=5$$$ for example. Input image (a)(pixel size N) is FREBAS transformed using $$$D_1$$$=3 (Fig.(d)), and the extrapolation of sub-image outside the red square region in Fig.(d) is the topic of this method. We use the similarity of distribution between sub-images at different size of input images, i.e. input image is FREBAS transformed using $$$D_2=D_1+2 (=5)$$$ (Fig.(b)) and then that is interpolated to $$$(D_2/D_1) N$$$ pixels (Fig.(c)) . The interpolated FREBAS transformed sub-images is expected to have similarity with unknown sub-images, so the outer-band sub-images surrounded by green line are used as an initial estimate of outer sub-band of (d) as shown in Fig.(e). Inverse FREBAS transform of signal is applied to (e), followed by Fourier transform (Fig.(g)). The center NxN region of signal (g) is replaced by original FT signal (i), and the replaced signal is inversely Fourier transformed to obtain updated image(h). The image update process from (e) to (h) is repeated iteratively.Results & Discussions
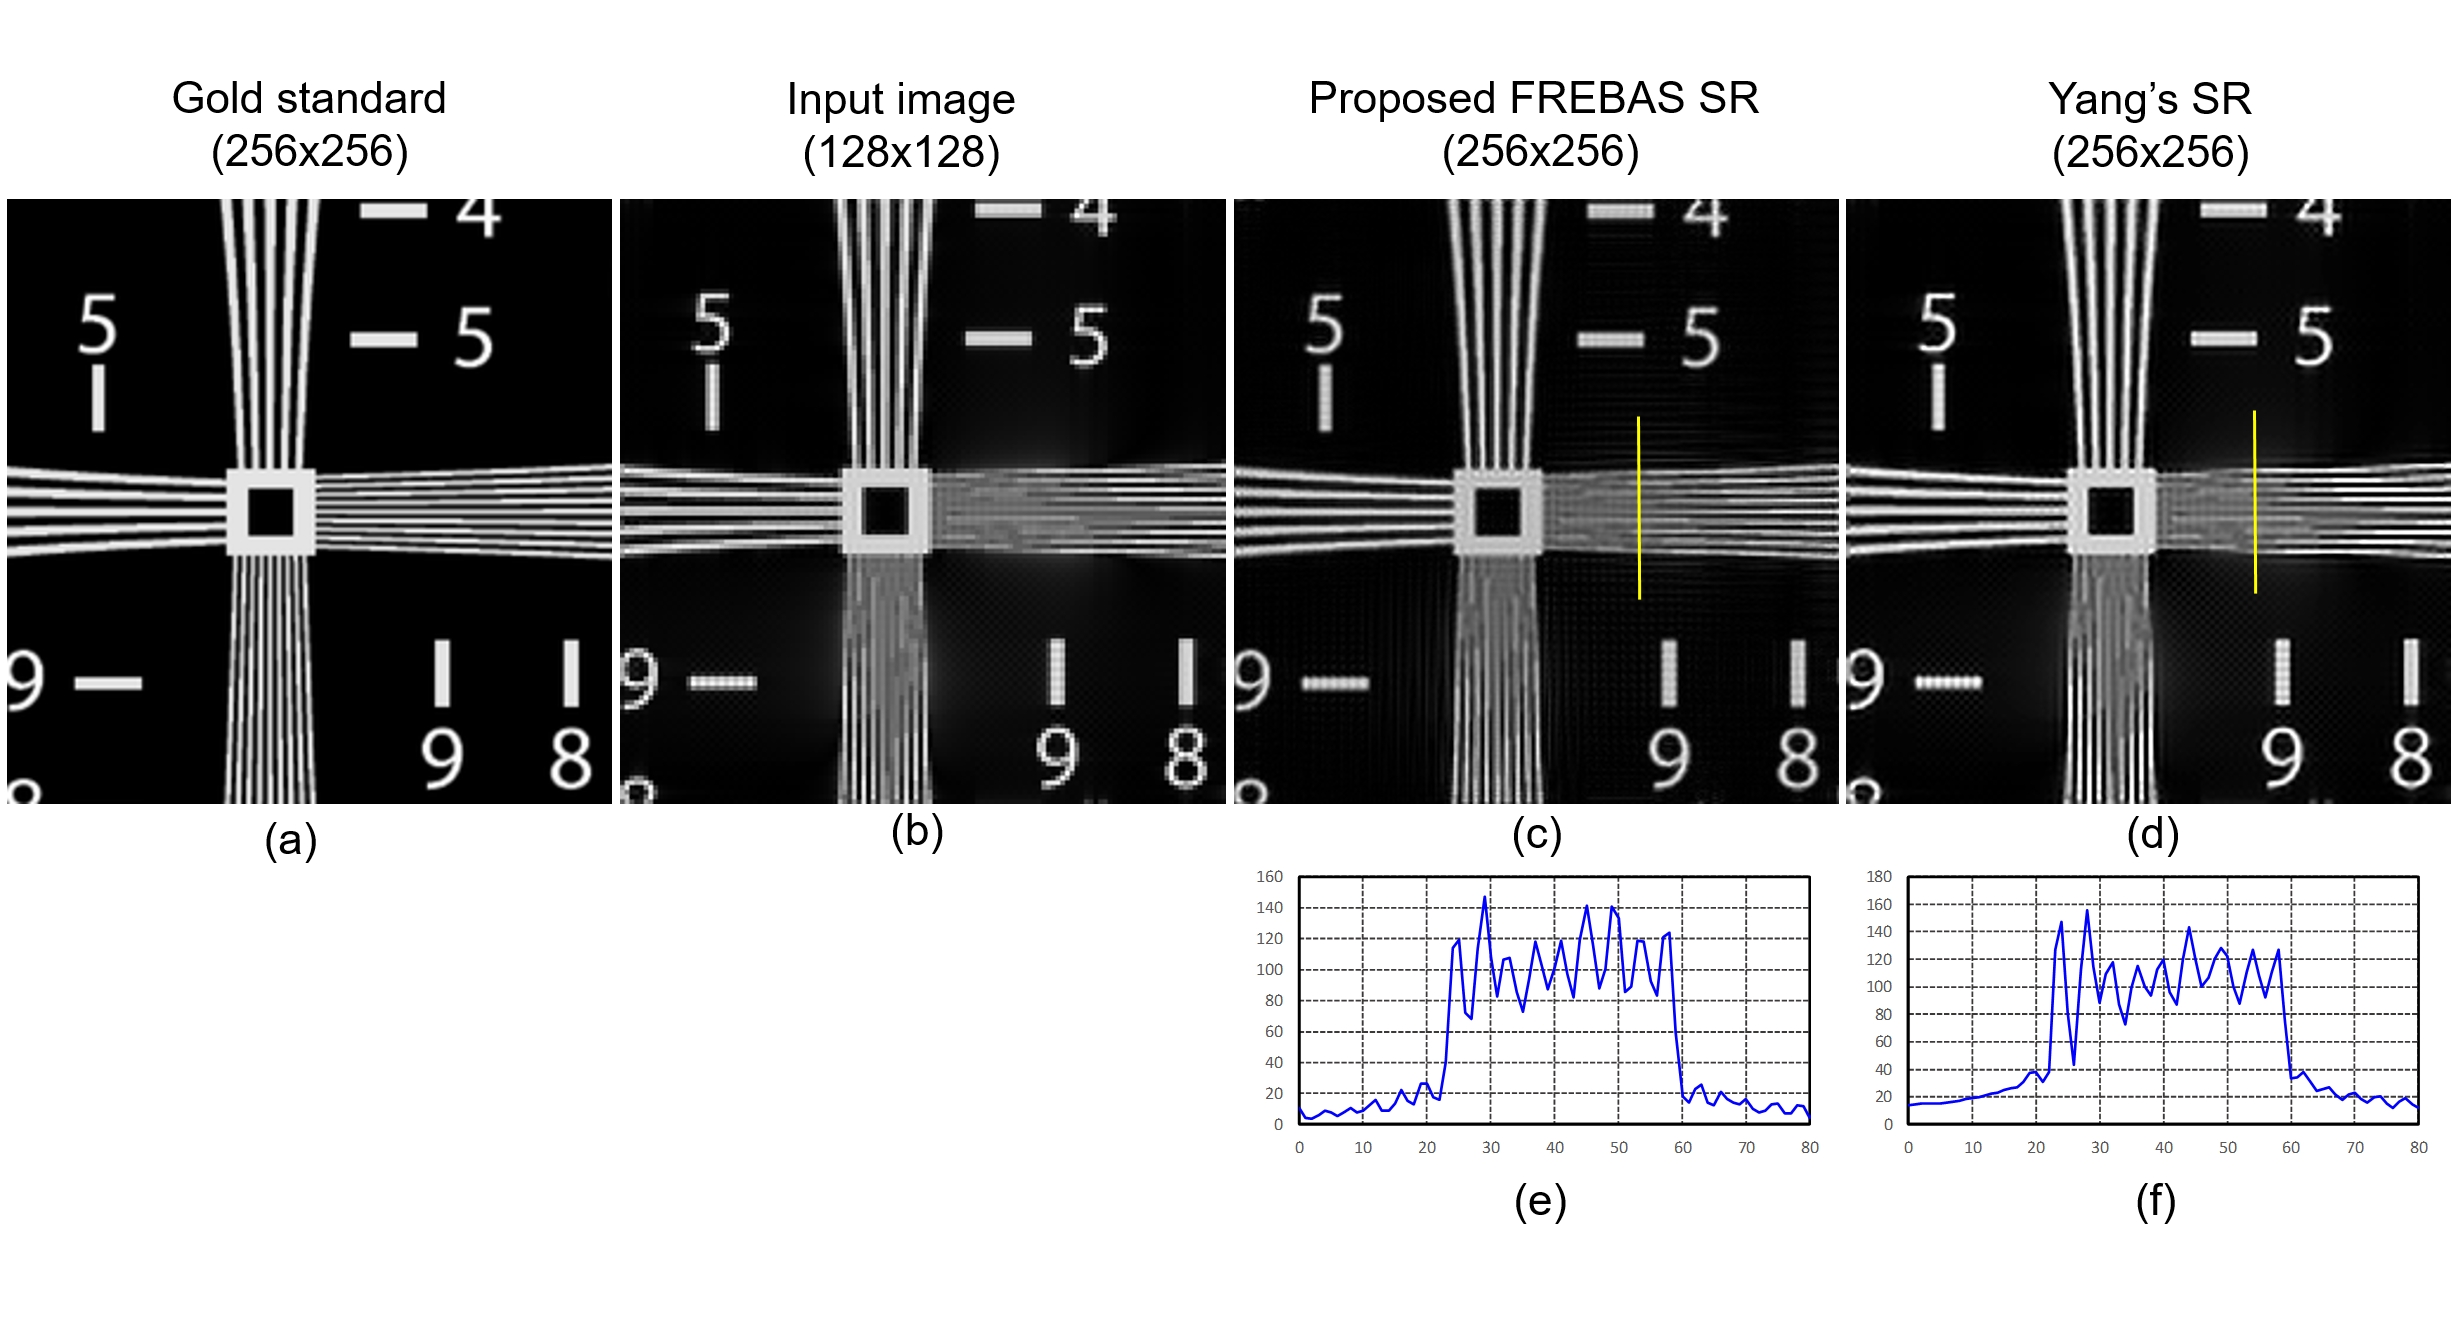
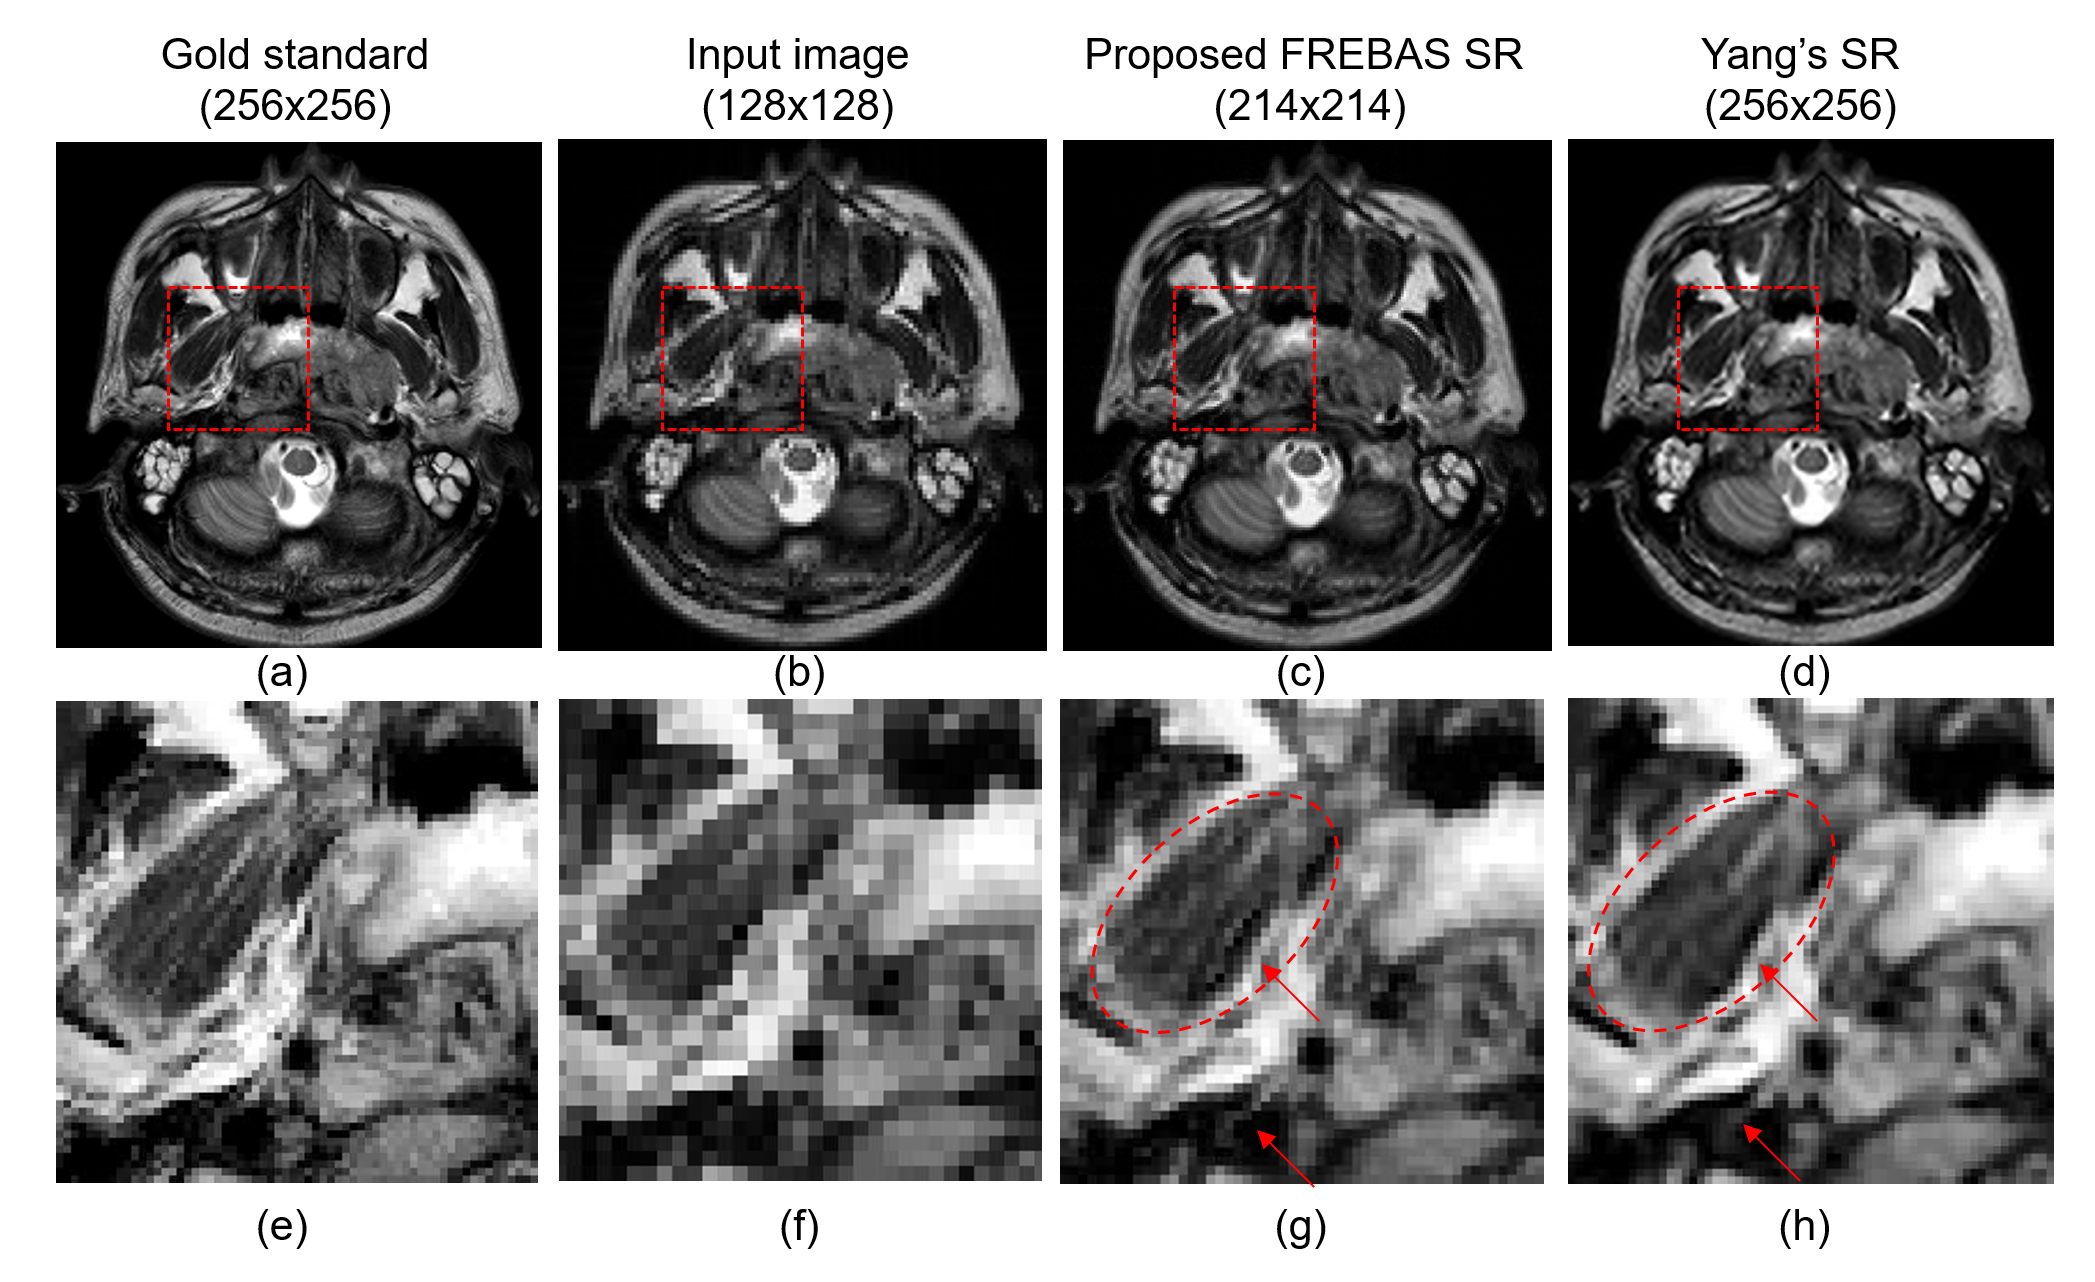
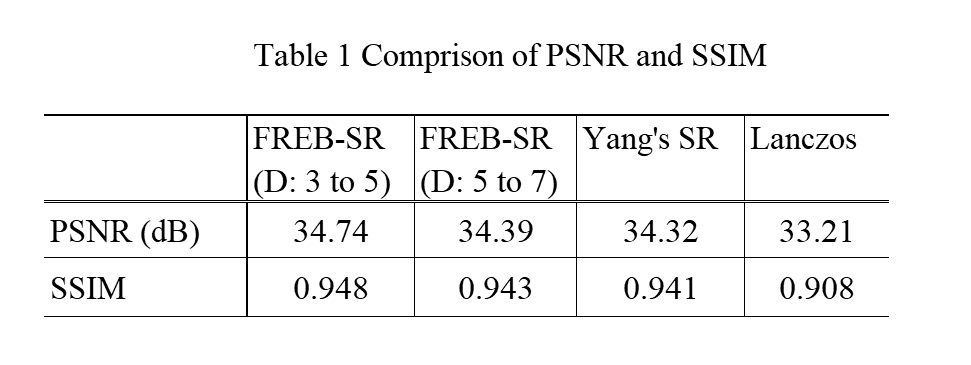
Figure 3 shows the demonstration of proposed method using resolution chart. Scaling parameters $$$D_1=3$$$, $$$D_2=5$$$ was used in proposed method. Figures (a) and (b) show the gold standard(256x256) and its band limited images (128x128) in spatial frequency space, respectively. Figures (b), (c) show the interpolated images using proposed method and Yang’s SR[2]. We used interpolation by sinc function to expand sub-image (b) to (c). Bottom column (d), (e) show the 1-dimensional profiles on the yellow line. Yang’s SR image (c) simply expand the input image (a) and shows small SR effects. On the other hand, stripes extending along the horizontal axes is deeply separated in proposed method as shown in Figs(d), (e). These results indicate that SR effect is induced by extrapolating the sub-images estimated by another size of image. Figure 4 shows the application to MR image using the same conditions with Fig.3. Comparing (c) and (d), edges of image are much more sharpened in proposed method (c) and details are more preserved as shown in close-up images (g), (h). Table 1 shows the comparison of PSNR and SSIM among proposed method, Yang’s SR and Lanczos interpolation. Other combinations of scaling parameters were considered e.g. $$$(D_2/D_1) =7/5, 9/7$$$ and so on. The size of image matrix of interpolated images become maximum at $$$ (D_2/D_1) =5/3$$$, so proposed method is most effective when $$$ (D_2/D_1) $$$ is selected 5/3. Similar interpolation method using FREBAS transform was proposed in 2010[3], however the preceding method do not use the similarity of sub-images and SR effects are small for band-limited signal like MR signal, that do not contain aliased signal. Sharpness of interpolated images is promoted by using the similarity of sub-images in FREBAS domain, however sharpness of obtained image is slightly enhanced compared to original image model, so the improvements of PSNR and SSIM are small compared to Yang’s method. Proposed method has an advantage in the sense of calculation cost. It takes about 1s to obtain 256 squared size of images from 128 squared image in our method, whereas Yang’s method takes 46s on a computer with Intel Core i7-6850K at 3.6 GHz and Matlab.Conclusion
A new fast image interpolating method involving super-resolution effect is proposed and demonstrated.Acknowledgements
This study was supported in part by JSPS and JSPS&MEXT KAKENHI(16K06379, 16H01530). We would like to thank TOSHIBA Medical Systems.References
1. Ito S, et al., IEEE ICIP2003, Barcelona, Spain, Map8.7, 2003
2. Yang J, et al., IEEE Trans. Image Proc., vol. 19, pp.2861-2873, 2010
3. Ito S, et al., ISMRM2010, Stockholm, Sweden 2936, 2010
Figures
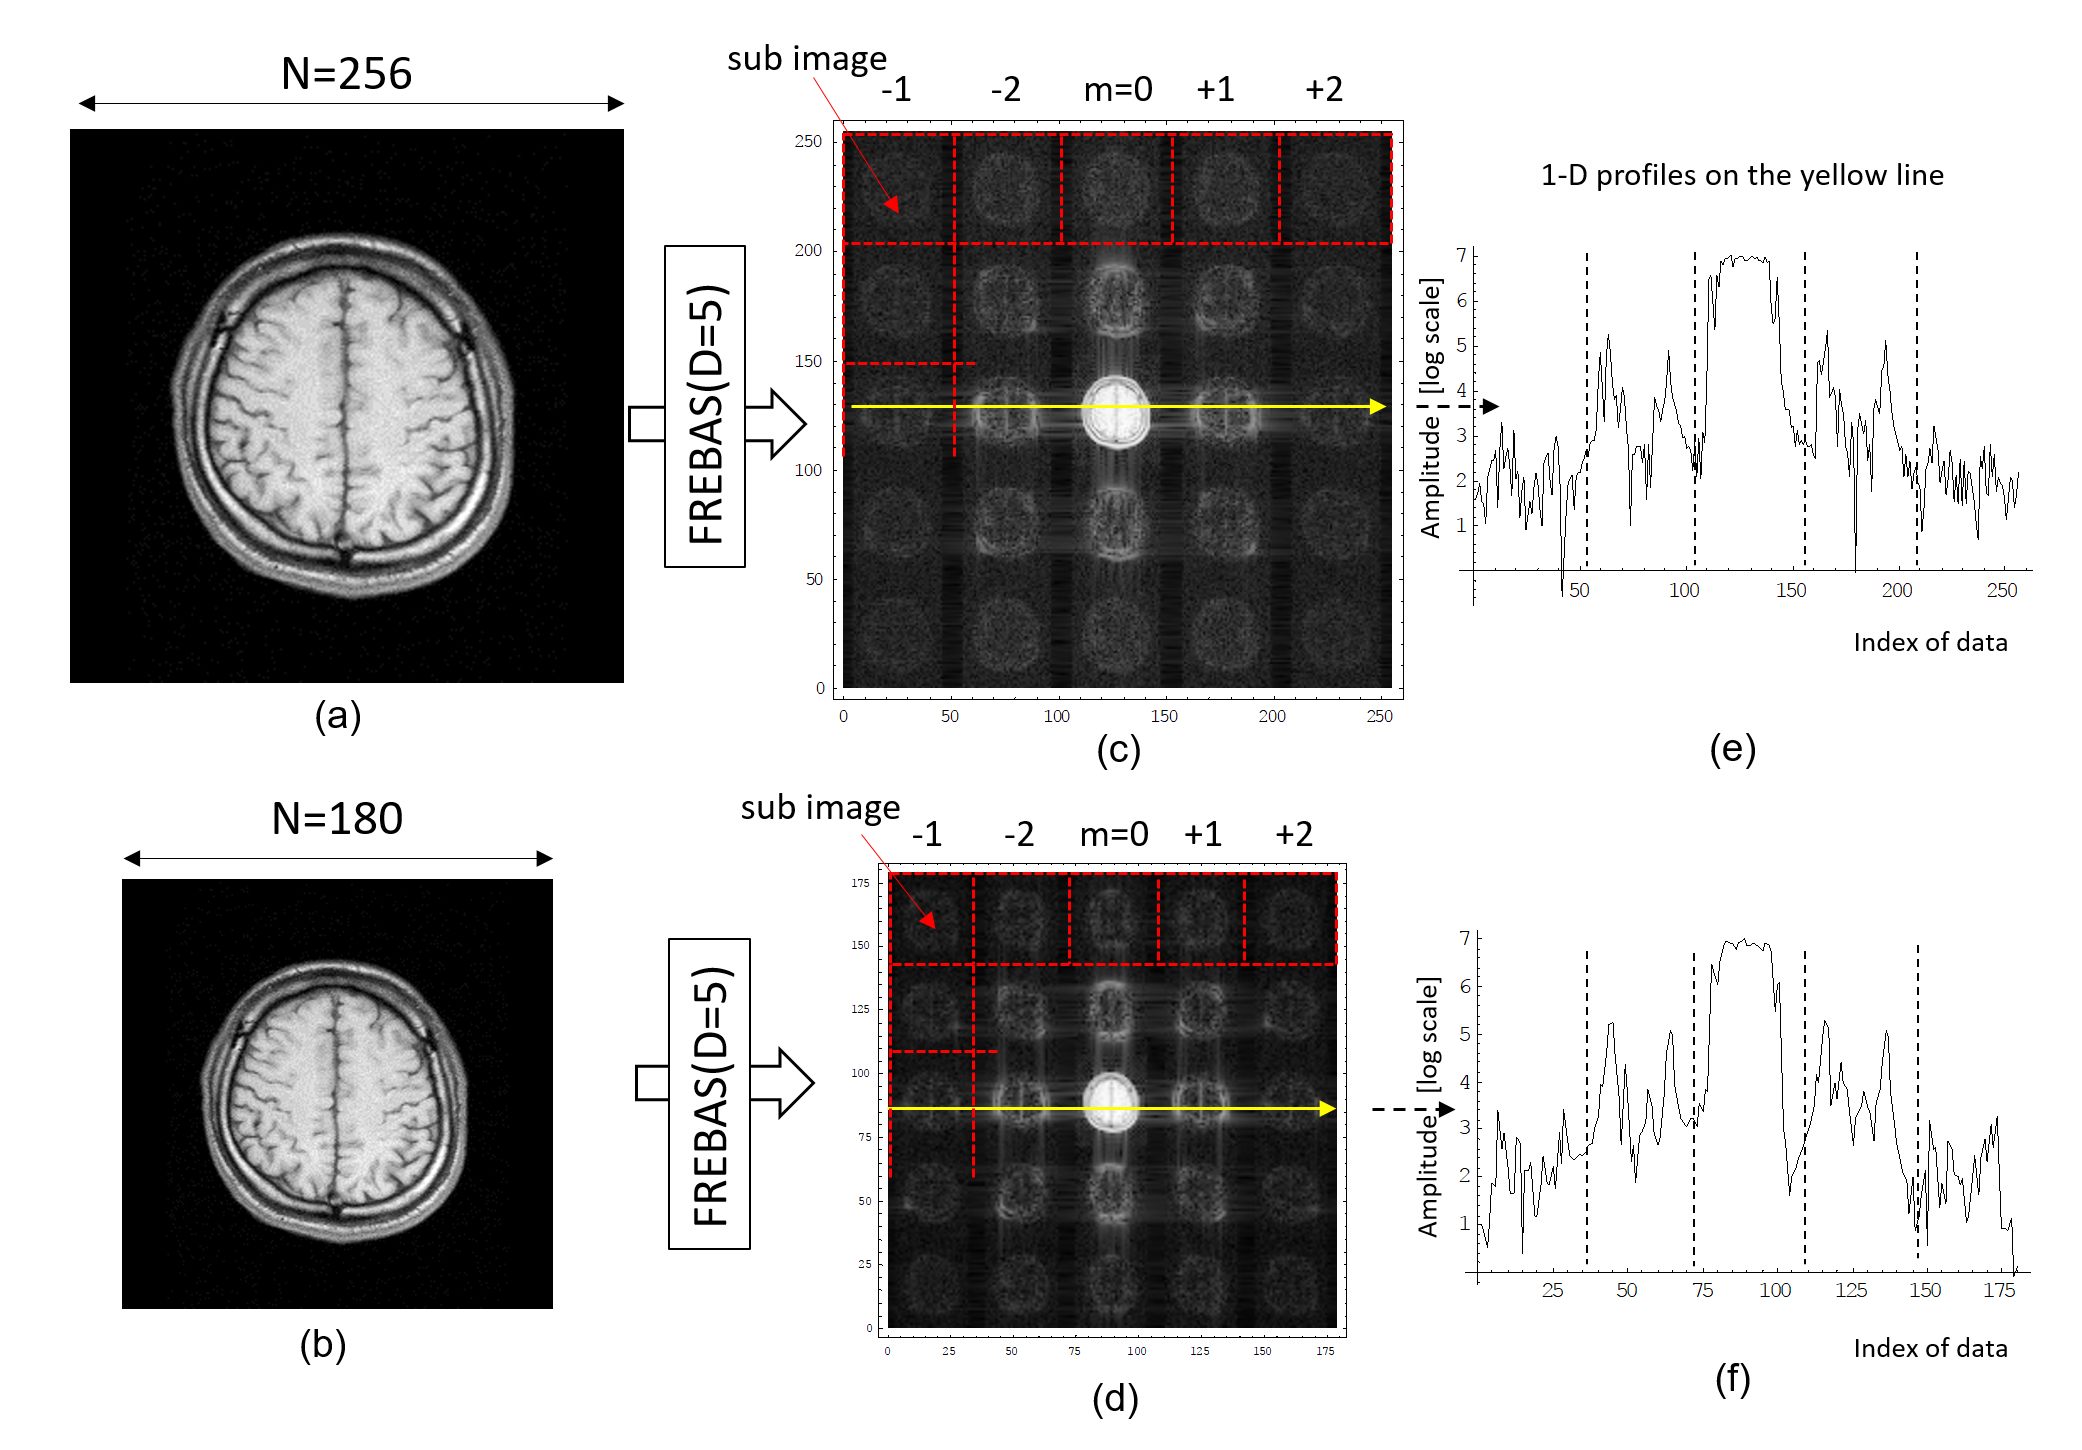
Similarity of sub-images in FREBAS transformed
domain. Different sized images (a) and (b) are FREBAS transformed using the
same scaling parameter D=5 (c), (d). One-dimensional profiles of yellow lines
are shown in (e) and (f). It was shown that distribution of sub-images resembles
each other.