2854
Quantitative Imaging Toolkit: Software for Interactive 3D Visualization, Data Exploration, and Computational Analysis of Neuroimaging Datasets1Laboratory of Neuro Imaging, USC Stevens Neuroimaging and Informatics Institute, Keck School of Medicine of USC, Los Angeles, CA, United States, 2Department of Computer Science, Brown University, Providence, RI, United States
Synopsis
Computational tools are increasingly important to MR imaging research, as they can make experiments more reproducible, improve our ability to share our findings and methods, and facilitate hypothesis generation. We aim to contribute a software package to the research community named the Quantitative Imaging Toolkit (QIT). QIT was developed to provide tools for 3D visualization, data exploration, and computational analysis of neuroimaging datasets. While meant to be generally useful for neuroimaging, the tools have extensively developed features for analyzing diffusion MRI data, running large population imaging analyses, and developing new algorithms.
Introduction
Computational tools are increasingly important to MR imaging research, as they can make experiments more reproducible, improve our ability to share our findings and methods, and facilitate hypothesis generation. We aim to contribute a software package to the research community named the Quantitative Imaging Toolkit (QIT). QIT was developed to provide tools for 3D visualization, data exploration, and computational analysis of neuroimaging datasets. Beyond this, it is also meant to serve as a platform the development of new methods that can be translated to neuroimaging studies. While meant to be generally useful for neuroimaging, the tools have extensively developed features for diffusion MRI and analyzing large population imaging datasets. Below, we describe the design and relevant features of QIT.
Design
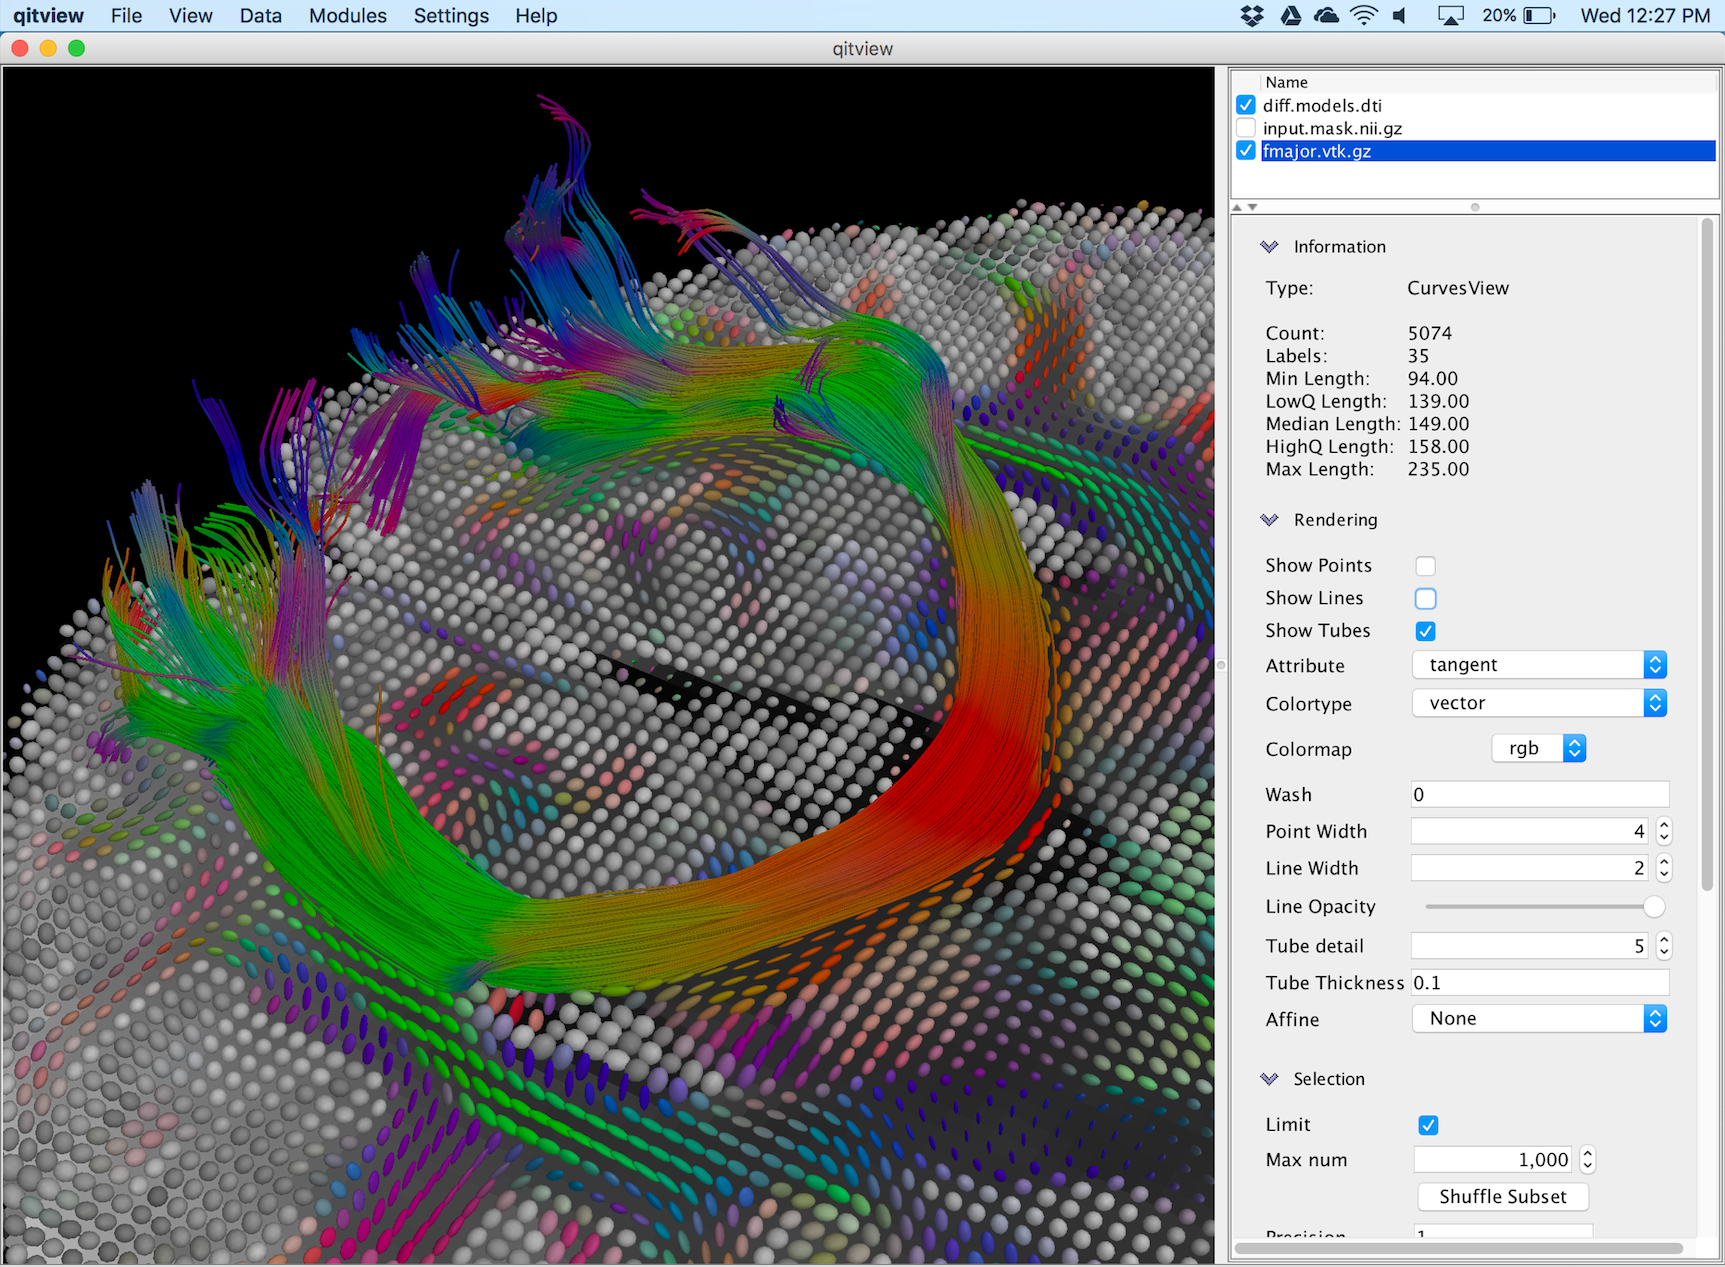
QIT is written in Java and OpenGL and is compatible with macOS, Windows, and GNU/Linux. It includes an interactive 3D rendering application qitview, a command line program qit, and a collection of utilities for processing large datasets. Many data types are supported, including multi-channel volumes, multi-label masks, curves, triangle meshes, vectors, deformation fields, affine transforms, tabular data stores, geometric primitives (boxes and spheres).
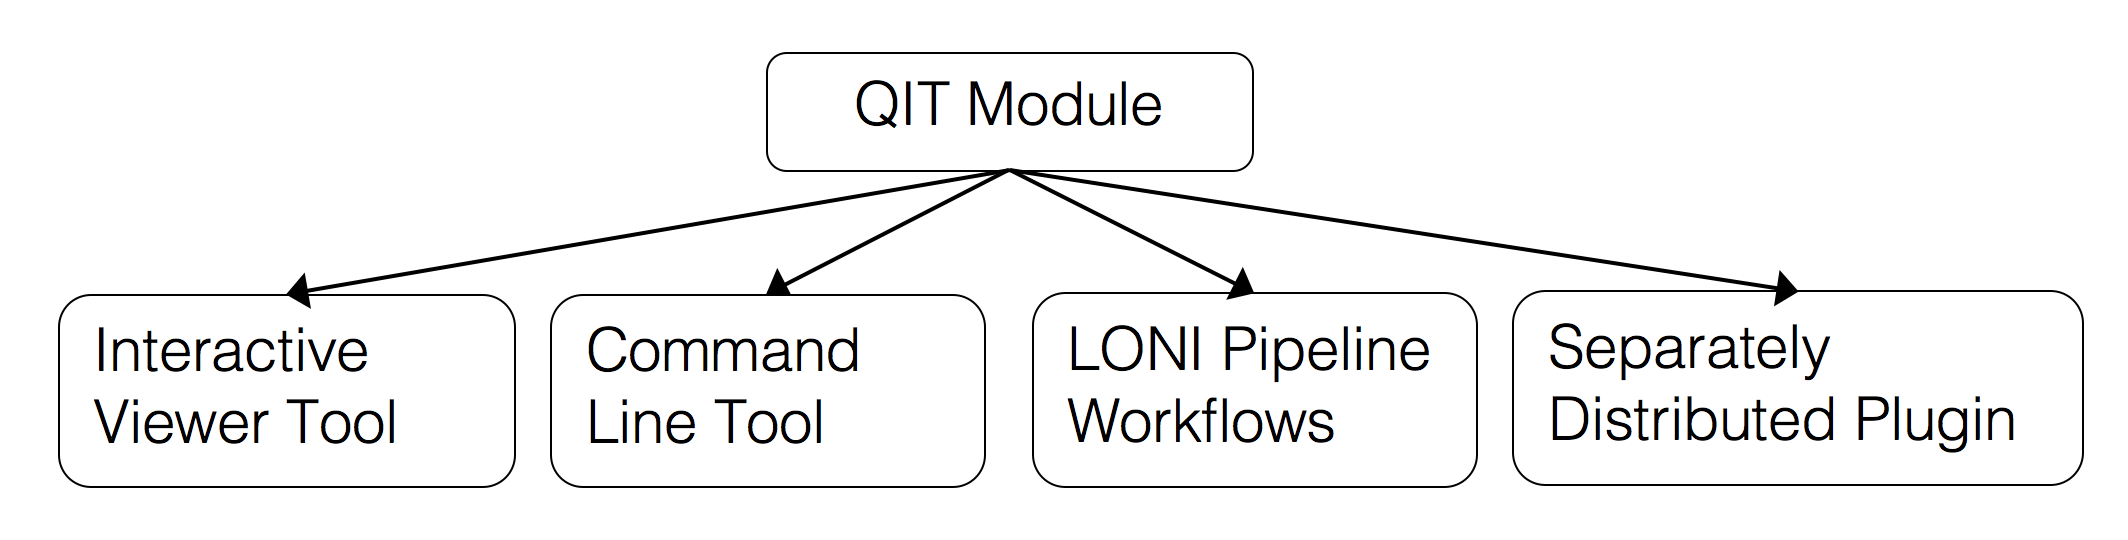
QIT includes a module framework for easily adding new functionality. Modules are implemented as a Java class, and the interface and parameters are specified in a declarative way using Java Annotations. Once written, a module can be run interactively in qitview, scripted using qit, integrated into workflows in the LONI Pipeline3, or shared as an external plugin. A major benefit of the module framework is that file formats are automatically handled, making them easier to develop and use. There is also support for module provenance, in which parameter sets can be saved for archival purposes or for later reuse.
QIT also supports parallel computing with multi-threading and automatic dispatching of large tasks to grid computing engines. qitview supports a rich user interface, which includes fine-grained control of the visual encoding of data, user-defined colormaps, manual mask drawing, data querying, high resolution off-screen rendering, arbitrary vertex attributes, multi-modal volume visualization, and a python scripting console. Finally, QIT was also designed for easy data exchange with other neuroimaging computing platforms, such as 3D Slicer4, FSL6, TrackVis2, MRtrix5, MITK7, DSI Studio8, BrainSuite9, and others.
Features
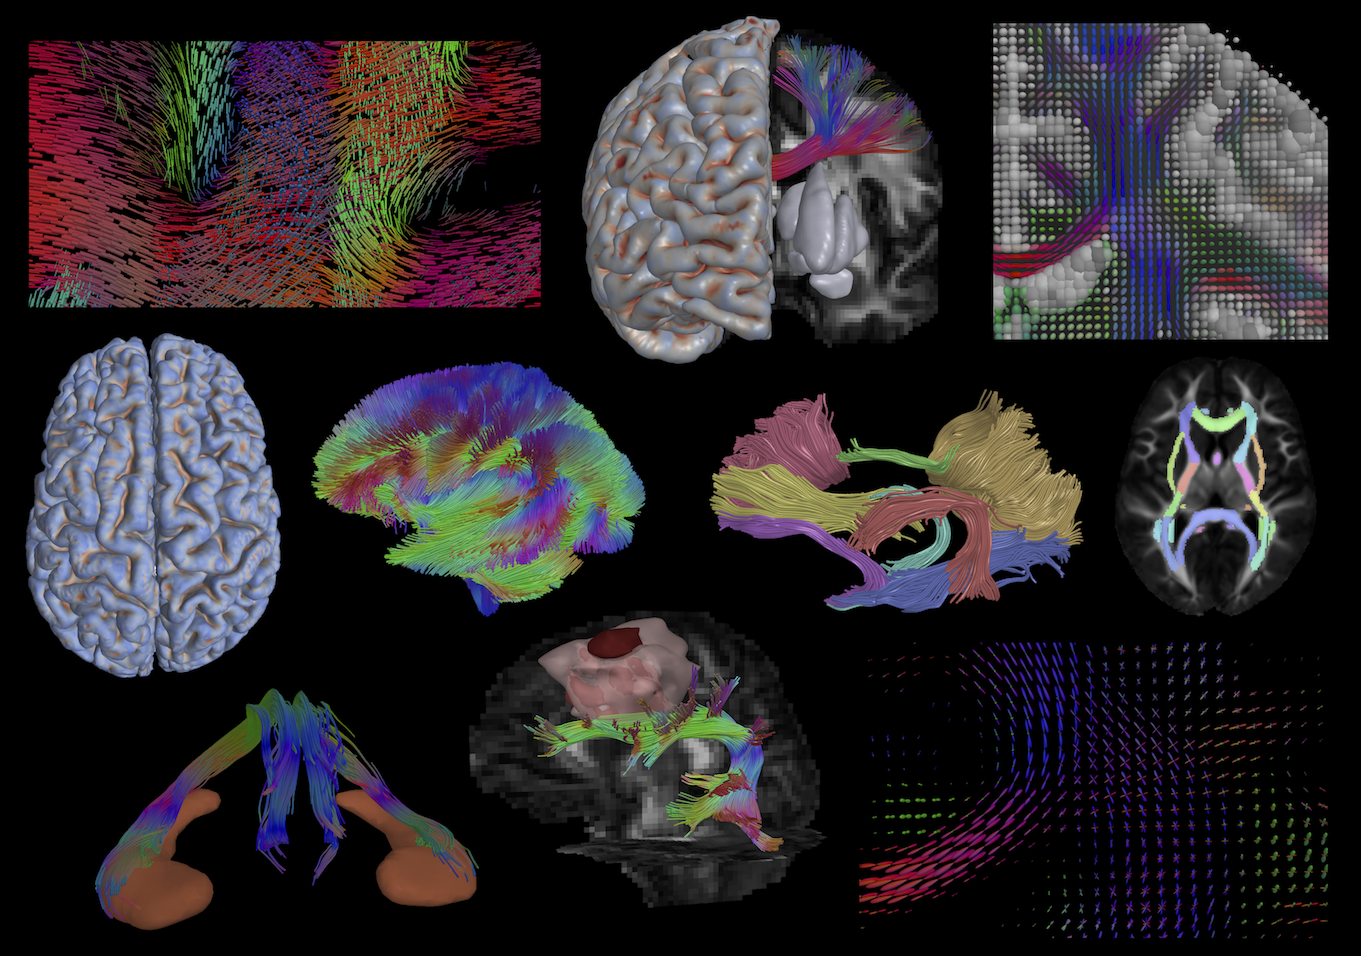
Out of the box, QIT includes many algorithms for processing volumetric and geometric datasets. There are a variety of smoothing and denoising algorithms, including non-local means, mean-shift, anisotropic diffusion, Gaussian blur, median filtering, etc. A variety of segmentation algorithms are supported, included region growing, Gaussian mixture modeling, manual drawing, etc. There are also many operations that can be performed on masks, such as erosion, dilation, skeletonization, connected components labeling, Markov random field restoration, distance transforms, etc. There are also ways to convert between data types, e.g. by extracting contours from slices or extracting isosurfaces from volumes. Mesh and curve operations include smoothing, simplification, clustering, reparameterization, discretization, etc. There is also a statistical framework for summarizing individual data objects and analyzing population imaging dataset11.
QIT also provides a rich set of tools for diffusion MRI. In contrast to other diffusion MRI toolkits, QIT supports a wide variety of diffusion models: tensors, kurtosis, NODDI, ball and sticks, spherical harmonics, and orientation distribution functions. It provides native model fitting routines for many of these, as well as wrappers around commonly used 3rd part fitting routines. Diffusion models can be visualized as 3D glyphs, and QIT provides a unique interface for arbitrary placement of glyphs, e.g. along tracts or scattered within a volumetric region. There are modules for both deterministic and probabilistic tractography10, and fiber bundles can be delineated using atlas regions, manually drawn masks, or manually placed geometric primitives. Beyond this, QIT supports many other diffusion MRI features, such as multi-tensor smoothing, ODF peak extraction, Q-space interpolation, signal drift analysis, model reorientation, bundle selection, along tract analysis, tractography simplification, clustering, and outlier rejection.
Conclusion
QIT develop was guided by a number of MR imaging studies of the brain in health and disease, and we hope that by sharing with the community, the tools will catalyze other future brain imaging studies. As we continue development, we also hope for QIT to serve as a platform for developing new methods that can be more directly integrated such studies. QIT can be downloaded from the web12, and documentation is available in a wiki13, which includes installation instructions, a user manual, and a set of tutorials for learning how to use the toolkit for specific imaging tasks.
Acknowledgements
This work was supported by the Brown Institute for Brain Science Graduate Research Award 2014, NIH/NINDS grant R01 NS052470, NIH/NIMH grant R01 MH085604, NIH grant R01 EB004155, and NIH grant P41EB015922.References
1. Jiang, Hangyi, et al. "DtiStudio: resource program for diffusion tensor computation and fiber bundle tracking." Computer methods and programs in biomedicine 81.2 (2006): 106-116.
2. Wang, Ruopeng, et al. "Diffusion toolkit: a software package for diffusion imaging data processing and tractography." Proc Intl Soc Mag Reson Med. Vol. 15. No. 3720. 2007.
3. Dinov, Ivo D., et al. "Efficient, distributed and interactive neuroimaging data analysis using the LONI pipeline." Frontiers in neuroinformatics 3 (2009).
4. Fedorov, Andriy, et al. "3D Slicer as an image computing platform for the Quantitative Imaging Network." Magnetic resonance imaging 30.9 (2012): 1323-1341.
5. Tournier, J., Fernando Calamante, and Alan Connelly. "MRtrix: diffusion tractography in crossing fiber regions." International Journal of Imaging Systems and Technology 22.1 (2012): 53-66.
6. Jenkinson, Mark, et al. "Fsl." Neuroimage 62.2 (2012): 782-790.
7. Fritzsche, Klaus H., et al. "MITK diffusion imaging." Methods of information in medicine 51.5 (2012): 441.
8. Yeh, Fang-Cheng, et al. "Deterministic diffusion fiber tracking improved by quantitative anisotropy." PloS one 8.11 (2013): e80713.
9. Shattuck, David W., and Richard M. Leahy. "BrainSuite: an automated cortical surface identification tool." Medical image analysis 6.2 (2002): 129-142.
10. Cabeen, Ryan P., Mark E. Bastin, and David H. Laidlaw. "Kernel regression estimation of fiber orientation mixtures in diffusion MRI." Neuroimage 127 (2016): 158-172.
11. Cabeen, Ryan P., Mark E. Bastin, and David H. Laidlaw. "A Comparative evaluation of voxel-based spatial mapping in diffusion tensor imaging." NeuroImage 146 (2017): 100-112.
12. http://resource.loni.usc.edu/resources/downloads/
13. http://cabeen.io/qitwiki
Figures