2851
QuantiCEST: Bayesian Model-based Analysis of CEST MRI1Institute of Biomedical Engineering, University of Oxford, Oxford, United Kingdom, 2CRUK & MRC Oxford Institute for Radiation Oncology, University of Oxford, Oxford, United Kingdom, 3Wellcome Centre for Integrative Neuroimaging, FMRIB, Nuffield Department of Clinical Neurosciences, University of Oxford, Oxford, United Kingdom
Synopsis
QuantiPhyse, a python-based software tool for quantitative image processing, has recently been released, to increase the accessibility of physiological modelling and quantification. Here, we present QuantiCEST, a QuantiPhyse plug-in offering Bayesian model-based analysis for quantification of CEST MRI. Using either the graphical user interface or command line, users can easily specify a multipool model of the Bloch-McConnell equations to quantify CEST data acquired with any combination of offset frequencies, saturation power and field strength. Additional information, such as relaxation times, can also be incorporated in the model, allowing flexibility to suit individual research needs. A typical analysis pipeline is presented.
Purpose
Specialised image analysis is often required to extract meaningful quantitative physiological information from raw MR signals, which can be a barrier to clinical application. To address this, QuantiPhyse1 has recently been released, a python-based analysis toolkit for visualisation and quantification of physiological imaging data. Here, we present an additional plug-in, QuantiCEST, specifically for Bayesian model-based analysis of CEST MRI data2,3, with the option of using either the graphical user interface (GUI) or the command line, to suit individual needs. QuantiCEST is compatible with Windows, Linux, and OSX operating systems. Example data are presented for illustrative purposes only from a previously published clinical study of acute ischaemic stroke4.Methods and Implementation
Data upload: The user can load 4D dynamic data, and 3D regions of interest (ROI), in NIFTI format, either by dragging and dropping in to the viewing plane, or selecting from the dropdown menu.
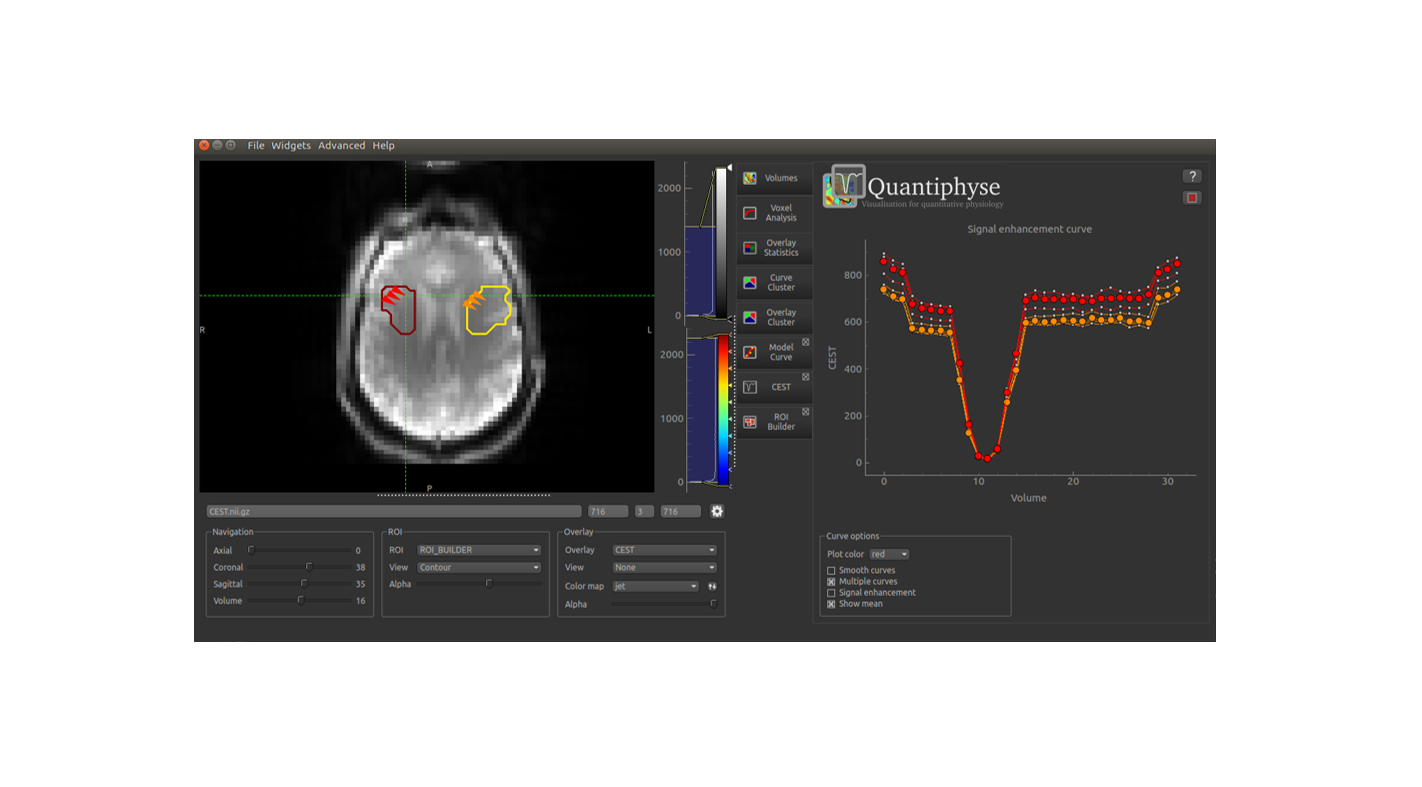
Data visualisation: Raw CEST data can be visualised across specified frequency offsets, on an interactive, voxelwise basis. There is the option to plot and export multiple Z-spectra, allowing different tissue types to be explored, as depicted in Figure 1. In addition to loading pre-defined ROIs, the user has the option of manually defining an ROI using the ROI builder in QuantiPhyse.
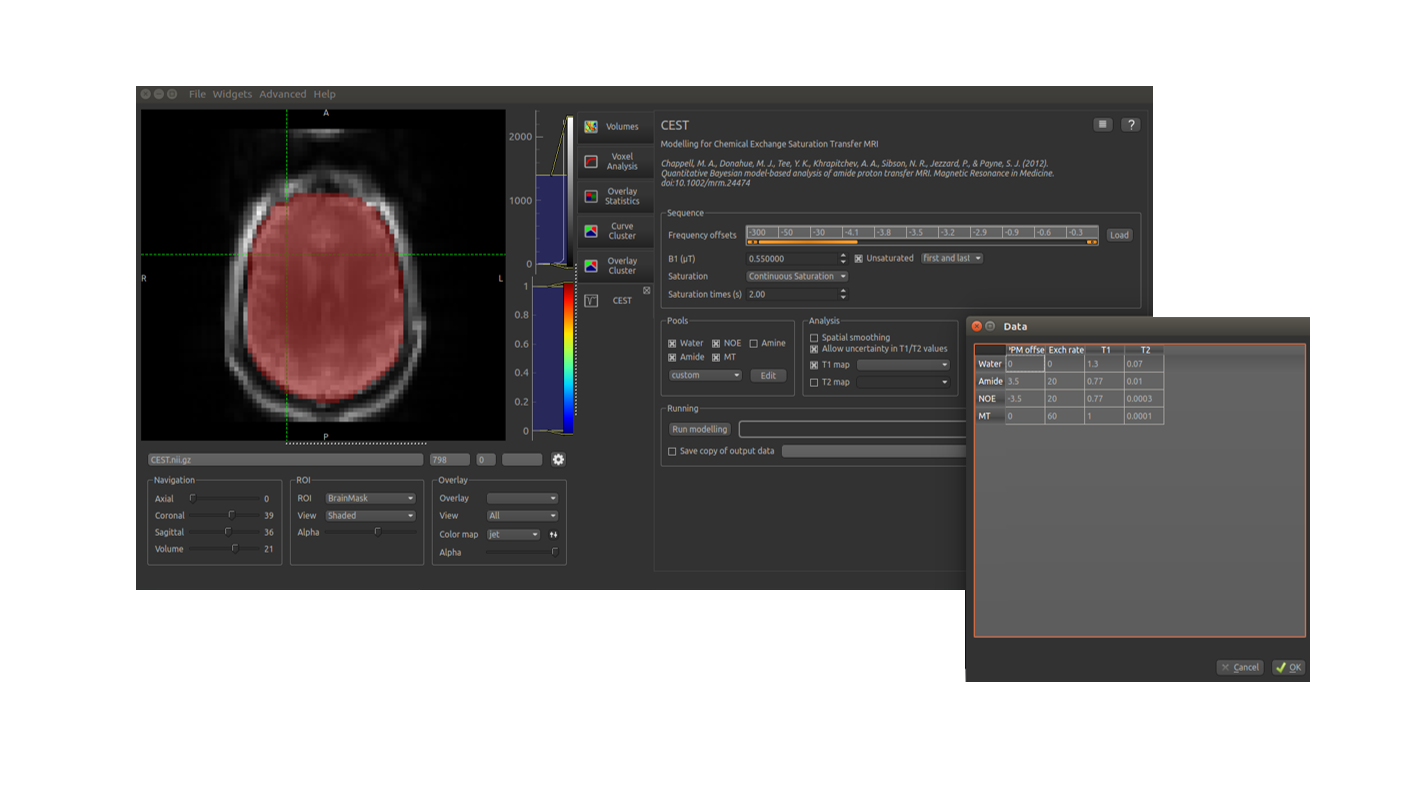
Pre-processing: QuantiPhyse includes a motion correction widget5, which can be applied prior to model-based analysis if desired. Data processing: Model parameters default to a ‘typical’ experimental setup for Amide Proton Transfer (APT) MRI. The user can edit parameters manually, and/or load frequency offsets from a text file. Multipool Bloch-McConnell model-based analysis can be extended from a basic three pool approach to suit the user’s study (Figure 2). B0 inhomogeneities can be automatically detected and corrected6 for using the sampled Z-spectrum, without the need for additional scans. Default values for frequency offset, exchange rate, T1, and T2, are currently provided for 3 and 9.4 Tesla, but these values can be manually edited to suit any field strength. The Bayesian analysis includes the ability to incorporate uncertainty in T1 and T2, and quantitative relaxation maps can be easily included if available. Additionally, QuantiCEST provides other conventional asymmetry-based CEST metrics for comparison.
Data
Output/Visualisation:
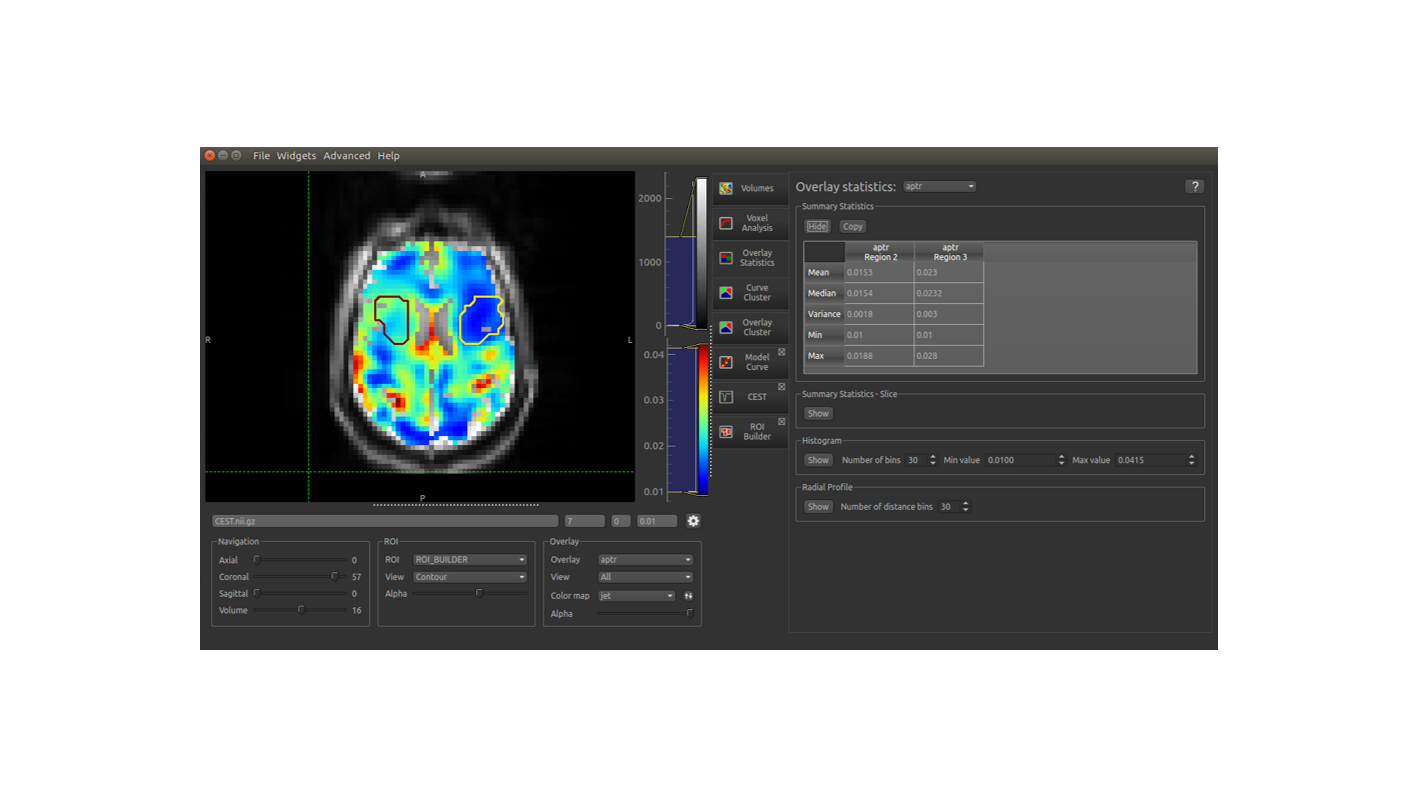
For a single slice
dataset (64 × 64 voxels, 32 frequency offsets, 3-pool model), model-based
analysis is performed in approximately 3.5 minutes, and the resulting log file
can be viewed and/or exported. Fitted
parameters (B0 offset, exchange rate, concentration, T1,
T2) and resulting APTR* metric can be immediately visualised,
overlaid on to raw data (Figure 3), and/or exported in NIFTI format.
In addition, the
modelled Z-spectra can be overlaid onto the raw Z-spectra, with fitted
parameters summarised for that particular voxel. Descriptive summary statistics
for each ROI can then be extracted.
Discussion and Conclusion
Here we present a toolkit for model-based analysis of CEST MRI, with the aim of increasing accessibility to image processing tools for Bayesian analysis, previously limited to command-line implementations of the FMRIB Software Library2,3. We have described a typical pipeline for amide proton transfer (APT) MRI using the available GUI, nonetheless, all processing steps described herein can be automated which allows for batch processing, either via the inbuilt python console, or from a separate terminal. This enables incorporation into existing pipelines, independent of programming language.
In summary, QuantiCEST offers an interactive approach for quantitative analysis of CEST MRI, seeking to bridge the gap between those developing new analysis methods, and those seeking to use them in research, and in clinical trials.
Acknowledgements
This work was funded by the Oxford Cancer Imaging Centre, Cancer Research UK, and Engineering and Physical Sciences Research Council.References
[1] www.quantiphyse.org
[2] Chappell MA, Groves AR, Whitcher B, Woolrich MW. Variational Bayesian Inference for a Nonlinear Forward Model. IEEE Trans Signal Process., 2009, 223–236.
[3] Chappell et al., Quantitative Bayesian Model-Based Analysis of Amide Proton Transfer MRI. MRM., 2013, 70:556-567.
[4] Harston et al., Identifying the ischaemic penumbra using pH-weighted magnetic resonance imaging. Brain. 2015; 138: 36-42.
[5] Jenkinson et al., Improved Optimisation for the Robust and Accurate Linear Registration and Motion Correction of Brain Images. NeuroImage, 2002; 17(2), 825-841,
[6] Tee at al., Optimal sampling schedule for chemical exchange saturation transfer. MRM., 2013, 70(5):1251-1262
Figures