2849
An automatic prostate gland and peripheral zone segmentations method based on cascaded fully convolution network1Academy for Advanced Interdisciplinary Studies, Peking University, Beijing, China, 2Department of Radiology, Peking University First Hospital, Beijing, China, 3College of Engineering, Peking University, Beijing, China
Synopsis
Automatic segmentation both in the whole prostate gland and the peripheral zone is a meaningful work, because there are different evaluation criteria for different regions according to prostate imaging reporting and data system's advice. Here we show a new method base on deep learning which can get the prostate outer contour and the peripheral zone contour fast and accurately without any manual intervention. The mean segmentation accuracies for 262 images are 94.87% ( the whole prostate gland) and 85.66% (the peripheral zone). Even in some extreme cases, such as hyperplasia and cancer, our method shows relatively good performance.
Introduction
Nowadays, prostate cancer has become a high incidence diseases in western elderly men, especially in the USA.[1] MR image is the most common used non-intrusive technique to diagnosis prostate cancer[2], but interpreting those exams requires expertise and depends on the personal experience of the radiologist. Therefore, computer-aided diagnosis(CAD) applications can help radiologists in quantifying the major indices of prostate cancer, and the MR image segmentation is the first step for CAD. However, automatic peripheral zone(PZ) segmentation has received less attention in the field, compared with the whole prostate gland segmentation. In fact, clinical experience shows that prostate cancer occurs predominantly in the peripheral zone, and there are different evaluation criteria for different regions according to PI-RADS. Thus, automatic peripheral zone segmentation is very necessary, and it is also very challenging due to the irregular hypointensity and large scale of deformation on T2WI in cancerous area.Method
Image Acquisitions
Clinical routine MRI was conducted on a cohort of 163 subjects, including healthy subjects, prostate cancer patients and prostate hyperplasia patients. The imaging was performed on a 3.0 T Ingenia system (Philips Healthcare, the Netherlands), with acquisition of T2-weighted, diffusion-weighted and dynamic contrast-enhanced images, with standard imaging protocol. For each subjects, 5 or 6 typical slices were selected as the data set (a grand total of 862 typical slices), and 70% of the total was selected as the train data set randomly .
Algorithm description
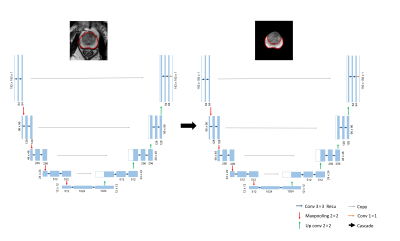
U-net is a U shape of fully convolutional network proposed by Ronneberger et al. in 2015[3]. It consists of a contracting path to capture context and a symmetric expanding path that enables retain details before maxpooling. As we can see in Fig1, we cascaded two U-net, the first network segment the whole prostate gland, and the second network segment the peripheral zone.
The concrete steps are as follows:
- Kmeans algorithm was adopted to coarse segmentation on DWI, in order to find the prostate location.
- The centroid of prostate clustering was computed and mapped to T2WI, then a size of 192 *192 ROI was cropped on T2WI.
- The first U-Net was trained to segment the whole prostate gland by the cropped T2WI.
- the segmentaion mask was extracted and as the input of the second network.
- the second U-Net was trained to segment the peripheral zone
Result
Accuracy in Our In-House Images
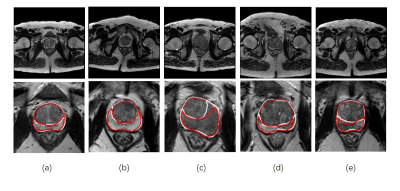
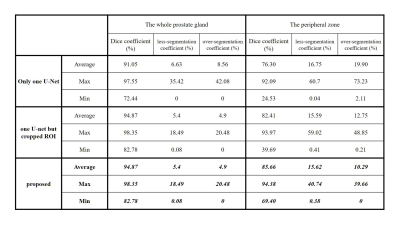
Fig. 2 shows some examples of segmentation result on T2W image. All manual segmentation results in our dataset were outlined by three experts with more than five-year-experience. We evaluated our algorithm with manual outlining by Dice coefficient, over-segmentation coefficient and less-segmentation coefficient. Then, only use one U-net in original images and use one U-net but cropped ROI are compared with our proposed method in experiments. (P.S. The whole prostate gland needs to be segmented first before cascaded in our method, so the result is the same as the second method in Table1) The results show in Fig. 2 and Table 1 indicates that the proposed method produced accurate and detailed segmentations both in the whole prostate gland and the peripheral zone.
Computational Time:
The mean segmentation time for one slice is less than 0.1 second on a Core i5, GTX1060 PC.
Discussion
It is well to know that the prostate gland accounts for a small part on the whole T2W image, and the peripheral zone is much smaller and has different features. Thus, through cropped the ROI based on DWI and cascaded two U-net can decreases the search space and save a lot of training time. As a result, the segmentation accuracy both in the whole prostate gland and the peripheral zone can be improved. Even in some extreme cases, like Fig.2(c) to (e), there are hypointensity shadows with hazy border in peripheral zone areas, our method can still get relatively good results. Similarly, in Table1 we can find that the minimum Dice coefficient in our method is higher. It means that our method has a good robustness. On the other hands, Relatively decreased performance always show in patients with severe lesions that the shape of the prostate have been greatly deformed, Therefore, expanding the proportion of cancer patients in train data set is is very necessary in the future .
Conclusion
In this paper, we describe and evaluate a deep learning based method to segment the the whole prostate gland and the peripheral zone synchronously. It is an accurate and efficient method which can reduce radiologists' workload. In the future, it may also help the CAD to locate the cancerous and assist doctors to do percutaneous puncture biopsy (PPB).Acknowledgements
No acknowledgement found.References
[1]. Siegel R, Ma J, Zou Z, et al. Cancer statistics, 2014.[J]. Ca A Cancer Journal for Clinicians, 2014, 64(1):9.
[2]. Villers A, Lemaitre L, Haffner J, et al. Current status of MRI for the diagnosis, staging and prognosis of prostate cancer: implications for focal therapy and active surveillance[J]. Current opinion in urology, 2009, 19(3): 274-282.
[3]. Ronneberger O, Fischer P, Brox T. U-Net: Convolutional Networks for Biomedical Image Segmentation[C]// International Conference on Medical Image Computing and Computer-Assisted Intervention. Springer, Cham, 2015:234-241.
Figures


