2847
Morphometric Thresholded Fractional Anisotropy for robust quantitative assessment and enhanced visualization of whole-brain white matter alterations in rodent models of Lupus1Radiology, Feinberg School of Medicine, Northwestern University, Chicago, IL, United States, 2Rheumatology, Feinberg School of Medicine, Northwestern University, Chicago, IL, United States
Synopsis
The study describes a novel voxel-wise brain fractional anisotropy (FA) analysis approach based on morphometrics evaluation of 3D surfaces. These surfaces were generated using thresholded segmentation of two dimensional FA maps and used for both quantitative analysis and enhanced visualization of differences between a control group and two rodent Lupus models with different degrees of white matter alterations. The methods described, if appropriately translated, could enable integration of DTI-MRI in the diagnostic pipeline in a clinical setting.
OBJECTIVE:
To demonstrate a novel voxel-wise brain fractional anisotropy (FA) analysis for quantitative measurements using a tridimensional visualization approach.INTRODUCTION & BACKGROUND:
MRI to diagnose and study progression of neurodegenerative pathophysiology has become an essential tool at pre-clinical and clinical levels [1,2,3]. In this study we focused on the FA parameter, obtained from diffusion MRI experiments using mice with neurodegenerative progression mimicking Lupus. FA is particularly relevant because it is a quantitative parameter that reflects the brain’s state of white matter [4]. To successfully employ FA for quantitative research, one must extract its values from specific brain regions in a reproducible manner to allow statistical comparison among groups [5]. Several have designed and implemented digital processing pipelines using anatomical reference brain-atlases to morph and co-register the brain of different subjects across time-points and to statistically detect occurrence of FA alterations [6]. Another approach involves manual delineation of brain regions from which quantitative values are extracted and averaged across subjects [7]. These methods suffer from practical and technical limitations associated with the need for advanced, time-consuming image processing. Furthermore, these approaches are unable to harness the synergistic benefits of multimodal whole brain data collected on a single subject. To solve these issues several are using computational and machine learning techniques. We opted to test the quantitative value of a thresholded volumetric approach of FA (TVFA) data that removes the need for advanced and time consuming digital processing steps, subjective errors associated with manual segmentation and provides a tool to immediately visualize white matter abnormalities. The morphometric analysis enabled detection of more robust quantitative differences among groups.METHODS:
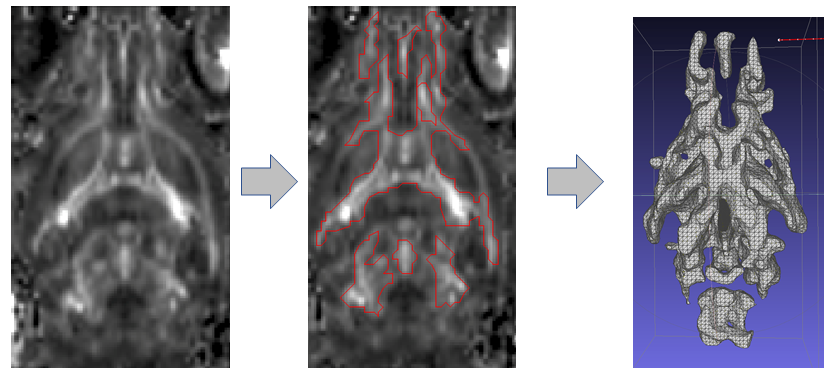
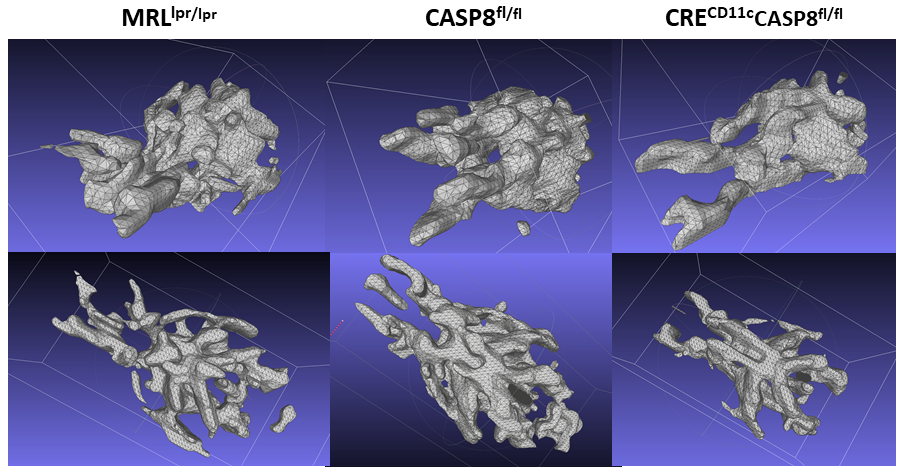
All animal experiments were conducted according to NU IACUC guidelines. Three groups (total number of mice N=12, 4 animals per group) were selected for the experiment: group (a) MRLlpr/lpr , group (b) Casp8 fl/fl and group (c) CRECD11cCasp8fl/fl. Group (b) was selected as negative control (i.e. no WM alteration) while group (a) and (c) were selected as positive controls (i.e. Lupus models ). MRI was done on a 7T CiinScan using a four-channel brain coil. An EPI diffusion weighted sequence (TR/TE= 3000/35) was used to obtain the MR diffusion data (diffusion gradient values: B=0, 500, 1800,sec/mm2; 64 directions; spatial resolution=0.234 mm and slice thickness=0.5 mm (12 longitudinal slices). FA maps were generated using Siemens Syngo DTI processing package. To generate TVFA volumes we used Jim (XInapse) ROI Tool. Using semi-automated threshold methods we segmented regions of high FA value (350 < FA < 400) in all subjects. The volumes of each TVFA were recorded and averaged for each group. The ROI was then used to mask the original image and to create a 3D mesh surface (STL format) for morphometric analysis (ITK-SNAP). Fig 1 schematically depicts the procedure on a single slice.RESULTS:
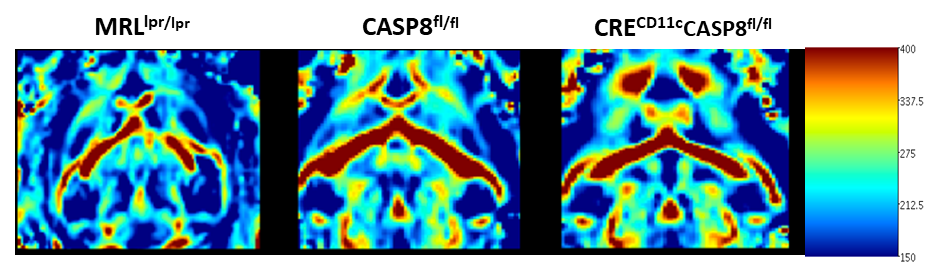
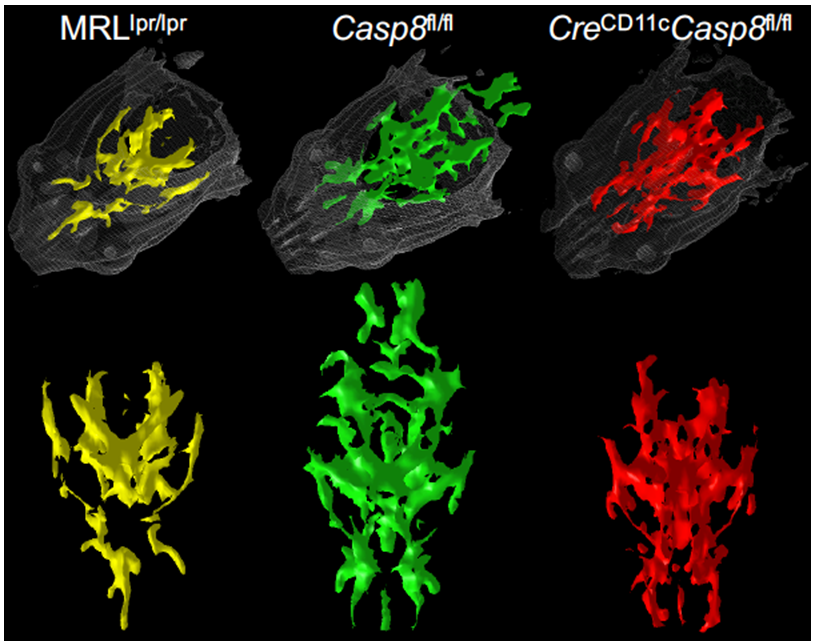
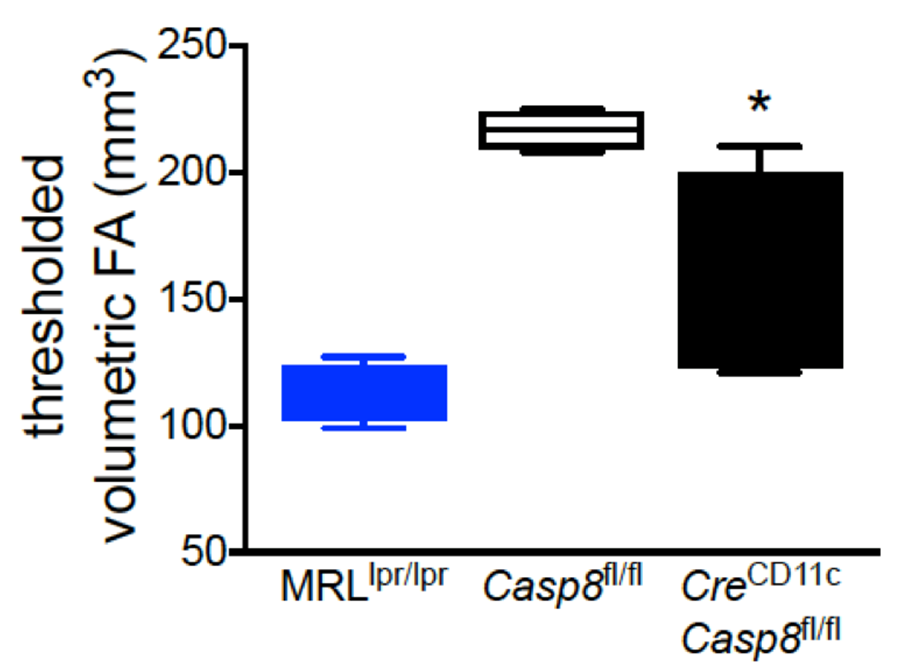
Shown in Fig 2 are three representative FA maps from each group depicted“traditionally” side-by-side as 2D slices. The corresponding TVFA 3D surfaces are shown in Fig 3. Fig 4 shows TVFA volumes (mm3) for each cohort with corresponding error bars. Differences in TVFA size reflect differences in white matter amounts and patterns. Fig 5 shows three representative 3D visualization windows illustrating the potential for morphometric analysis and evaluation using MeshLab software.DISCUSSION/CONCLUSIONS:
We generated 3D surfaces from two dimensional FA maps using a threshold method that accounts for quantitative differences between subjects and shown how these mesh surfaces can be visualized and manipulated in 3 dimensions. This new approach provided us with a more robust way to obtain quantitative information from the DTI measurements without the need to rely on advanced post-acquisition processing methods and/or time-consuming manual segmentation. It also enhanced the ability to visualize and evaluate whole brain white matter abnormalities by comparing surfaces with different morphometry. A radiologist with preclinical and clinical experience (co-author BA) was asked to identify differences between FA data sets from different cohorts (normal vs disease) using both the standard/traditional quantitative FA maps (Fig 2) and then the corresponding TVFA volumes (Fig 5). Thanks to the ability to visualize whole-brain abnormalities as a single 3D pattern he was able to read and classify the data sets with less effort and faster (~30-40%). This preliminary study at the preclinical level suggests that, if appropriately translated, the method could enable and enhance integration of DTI-MRI in the diagnostic pipeline in a clinical setting, which currently is not a standard clinical practice.Acknowledgements
No acknowledgement found.References
1. Rapacchi, Stanislas, Robert X. Smith, Yi Wang, Lirong Yan, Victor Sigalov, Kate E. Krasileva, George Karpouzas et al. "Towards the identification of multi-parametric quantitative MRI biomarkers in lupus nephritis." Magnetic resonance imaging 33, no. 9 (2015): 1066-1074.
2. Canu, Elisa, Federica Agosta, Gorana Mandic-Stojmenovic, Tanja Stojković, Elka Stefanova, Alberto Inuggi, Francesca Imperiale, Massimiliano Copetti, Vladimir S. Kostic, and Massimo Filippi. "Multiparametric MRI to distinguish early onset Alzheimer's disease and behavioural variant of frontotemporal dementia." NeuroImage: Clinical (2017).
3. Wells, Jack A., James M. O'Callaghan, Holly E. Holmes, Nick M. Powell, Ross A. Johnson, Bernard Siow, F. Torrealdea et al. "In vivo imaging of tau pathology using multi-parametric quantitative MRI." Neuroimage 111 (2015): 369-378.
4. Ercan, Ece, Cesar Magro-Checa, Romain Valabregue, Francesca Branzoli, Emily T. Wood, Gerda M. Steup-Beekman, Andrew G. Webb, Tom WJ Huizinga, Mark A. van Buchem, and Itamar Ronen. "Glial and axonal changes in systemic lupus erythematosus measured with diffusion of intracellular metabolites." Brain 139, no. 5 (2016): 1447-1457.
5. Hammelrath, Luam, Siniša Škokić, Artem Khmelinskii, Andreas Hess, Noortje van der Knaap, Marius Staring, Boudewijn PF Lelieveldt, Dirk Wiedermann, and Mathias Hoehn. "Morphological maturation of the mouse brain: An in vivo MRI and histology investigation." NeuroImage 125 (2016): 144-152.
6. Ullmann, Jeremy FP, Charles Watson, Andrew L. Janke, Nyoman D. Kurniawan, George Paxinos, and David C. Reutens. "An MRI atlas of the mouse basal ganglia." Brain Structure and Function219, no. 4 (2014): 1343-1353.
7. Figini, Matteo, Ileana Zucca, Domenico Aquino, Paolo Pennacchio, Simone Nava, Alessandro Di Marzio, Maria Giulia Preti, Guseppe Baselli, Roberto Spreafico, and Carolina Frassoni. "In vivo DTI tractography of the rat brain: an atlas of the main tracts in Paxinos space with histological comparison." Magnetic resonance imaging 33, no. 3 (2015): 296-303.
Figures