2845
Cerebral white matter lesions in multiple sclerosis: optimized automated segmentation and longitudinal follow-up1Qynapse, Paris, France, 2Sorbonne Universités, UPMC Univ Paris 06, Inserm, CNRS, Institut du cerveau et de la moelle épinière (ICM) - Hôpital Pitié-Salpêtrière, Boulevard de l'hôpital, F-75013, Inria Paris, Aramis project-team, Paris, France, 3CATI, Paris, France
Synopsis
In Multiple Sclerosis (MS), detection of T2-hyperintense white matter lesions on MRI has become a crucial criterion for early diagnosis and monitoring. In this study, we propose an accurate and reliable automated method for lesion segmentation and longitudinal follow-up, using color-scaled maps of lesion evolution depicting increasing and decreasing patterns. Validation of the cross-sectional segmentation has been performed on large samples of MS patients and shows good agreement with manual tracing. Through its reliability and robustness, the measures provided by our automated method of lesion quantification could be a valuable tool for clinical routine and clinical trials.
Introduction
Quantitative analysis of magnetic resonance imaging (MRI) data has become useful in both research and clinical studies, and is now crucial for the diagnosis and disease monitoring of patients with multiple sclerosis (MS). Indeed, MS is characterized by the presence of white matter (WM) lesions, detectable on MRI scans as hyper-intense areas on T2-weighed Fluid Attenuated Inversion Recovery (FLAIR) images. However, manual segmentation of such lesions is highly time-consuming and prone to significant intra- and inter-rater variability that makes wider application of MRI analysis and longitudinal follow-up still hardly feasible. Another challenge of lesion longitudinal follow-up is linked to the inconsistency of their patterns of evolution: their location and size can change significantly between two timepoints for the same subject. Consequently, the cross-segmentation of scans without reference to the preceding timepoints can lead to errors in MS lesion detection. Here, we first aimed at optimizing and validating a fully automated segmentation algorithm on large samples with a wide range of lesion loads. We then introduced a new tool for the longitudinal follow-up of MS lesions. Both algorithms are included in QyScore, a software that provides automated volumetric measurements of brain structures.Materials and Methods
Longitudinal
MRI brain scans from 53 patients
(26 Clinically Isolated Syndrome (CIS) and 27 Relapsing-Remitting
(RRMS)
patients,
average
age 39.03 ± 11.35 y.o)
were acquired using 3T scanners (48 on
a Philips Achieva and five on a GE
MR Discovery)
with
two timepoints one year apart. Manual segmentation was performed by two experts to create a Gold Standard (GS) with
volumes ranging
from 0.58 to 66.62 mL (mean = 8.31mL ± 11.38). Fully automated
segmentation was obtained with an optimized version of White
matter Hyperintensities Automatic Segmentation Algorithm (WHASA) [1],
a method to
automatically segment WM
hyperintensities
from T2-FLAIR and T1 images which relies on the coupling of
non-linear diffusion and watershed segmentation, with intensity and
location constraints. The
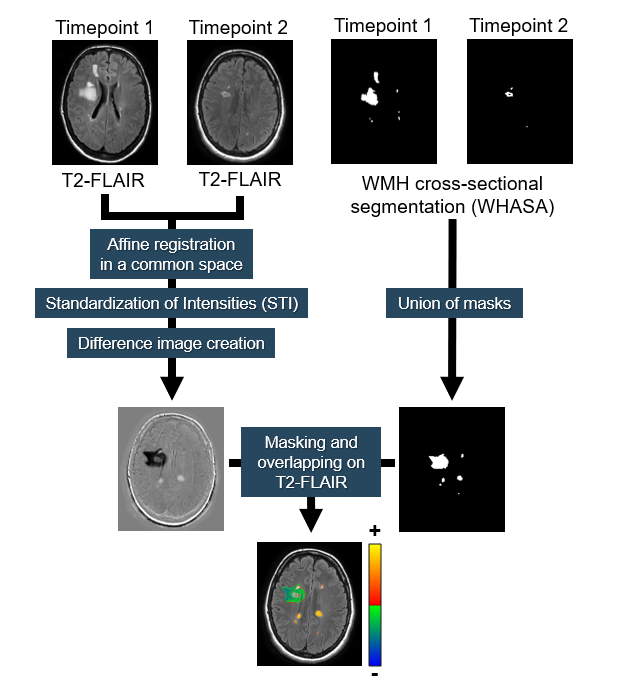
longitudinal analysis performed afterwards required a
fast and efficient T2-FLAIR
intensity normalization method.
To do so, we adapted the Standardization of Intensities (STI) [2]
method to FLAIR data with WM lesions: STI uses joint intensity
histograms in a common space to determine spatial intensity
correspondences between two acquisitions. The
difference between T2-FLAIR
intensities from these scans
was therefore
computed, then masked by the lesion information obtained from
WHASA (Figure 1).
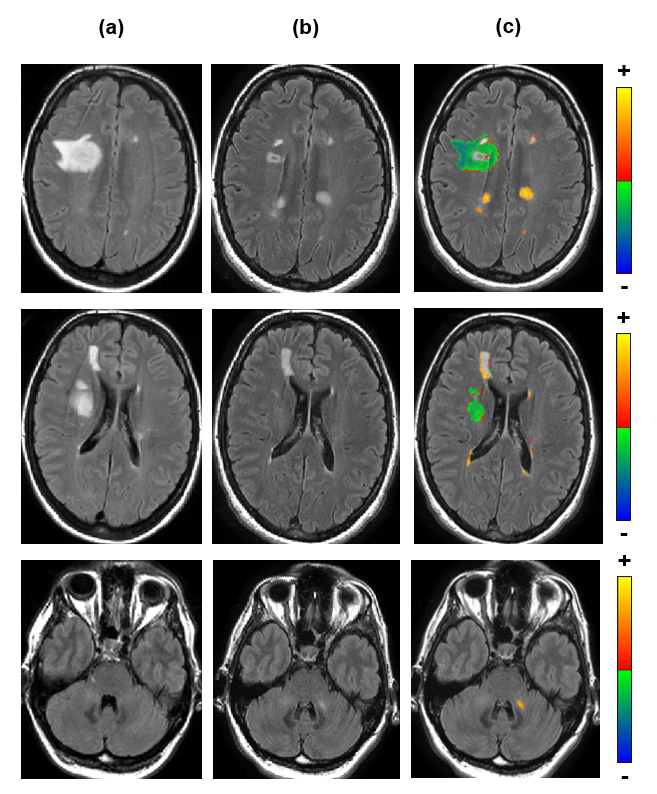
Longitudinal results can
be displayed as labeled regions of increased or decreased lesion
volumes, or as a color-scaled
map showing intensity
variations within lesions.
As
the longitudinal analysis is heavily related to the cross-sectional
segmentation,
performance was evaluated
on
WHASA results by
computing indices
relative to the
GS,
including Dice coefficient (DC) [3]
and
Absolute
Volume Error difference in mL (AVE = |VGS - VWHASA|)
for
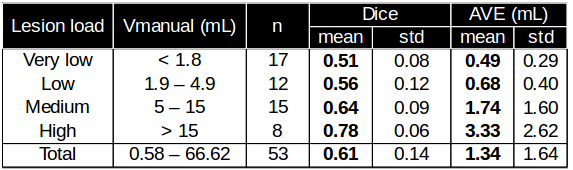
the whole dataset and then for patients
categorized in different subsets according to their lesion loads (very
low, low,
medium and high, described in Figure 2) Results
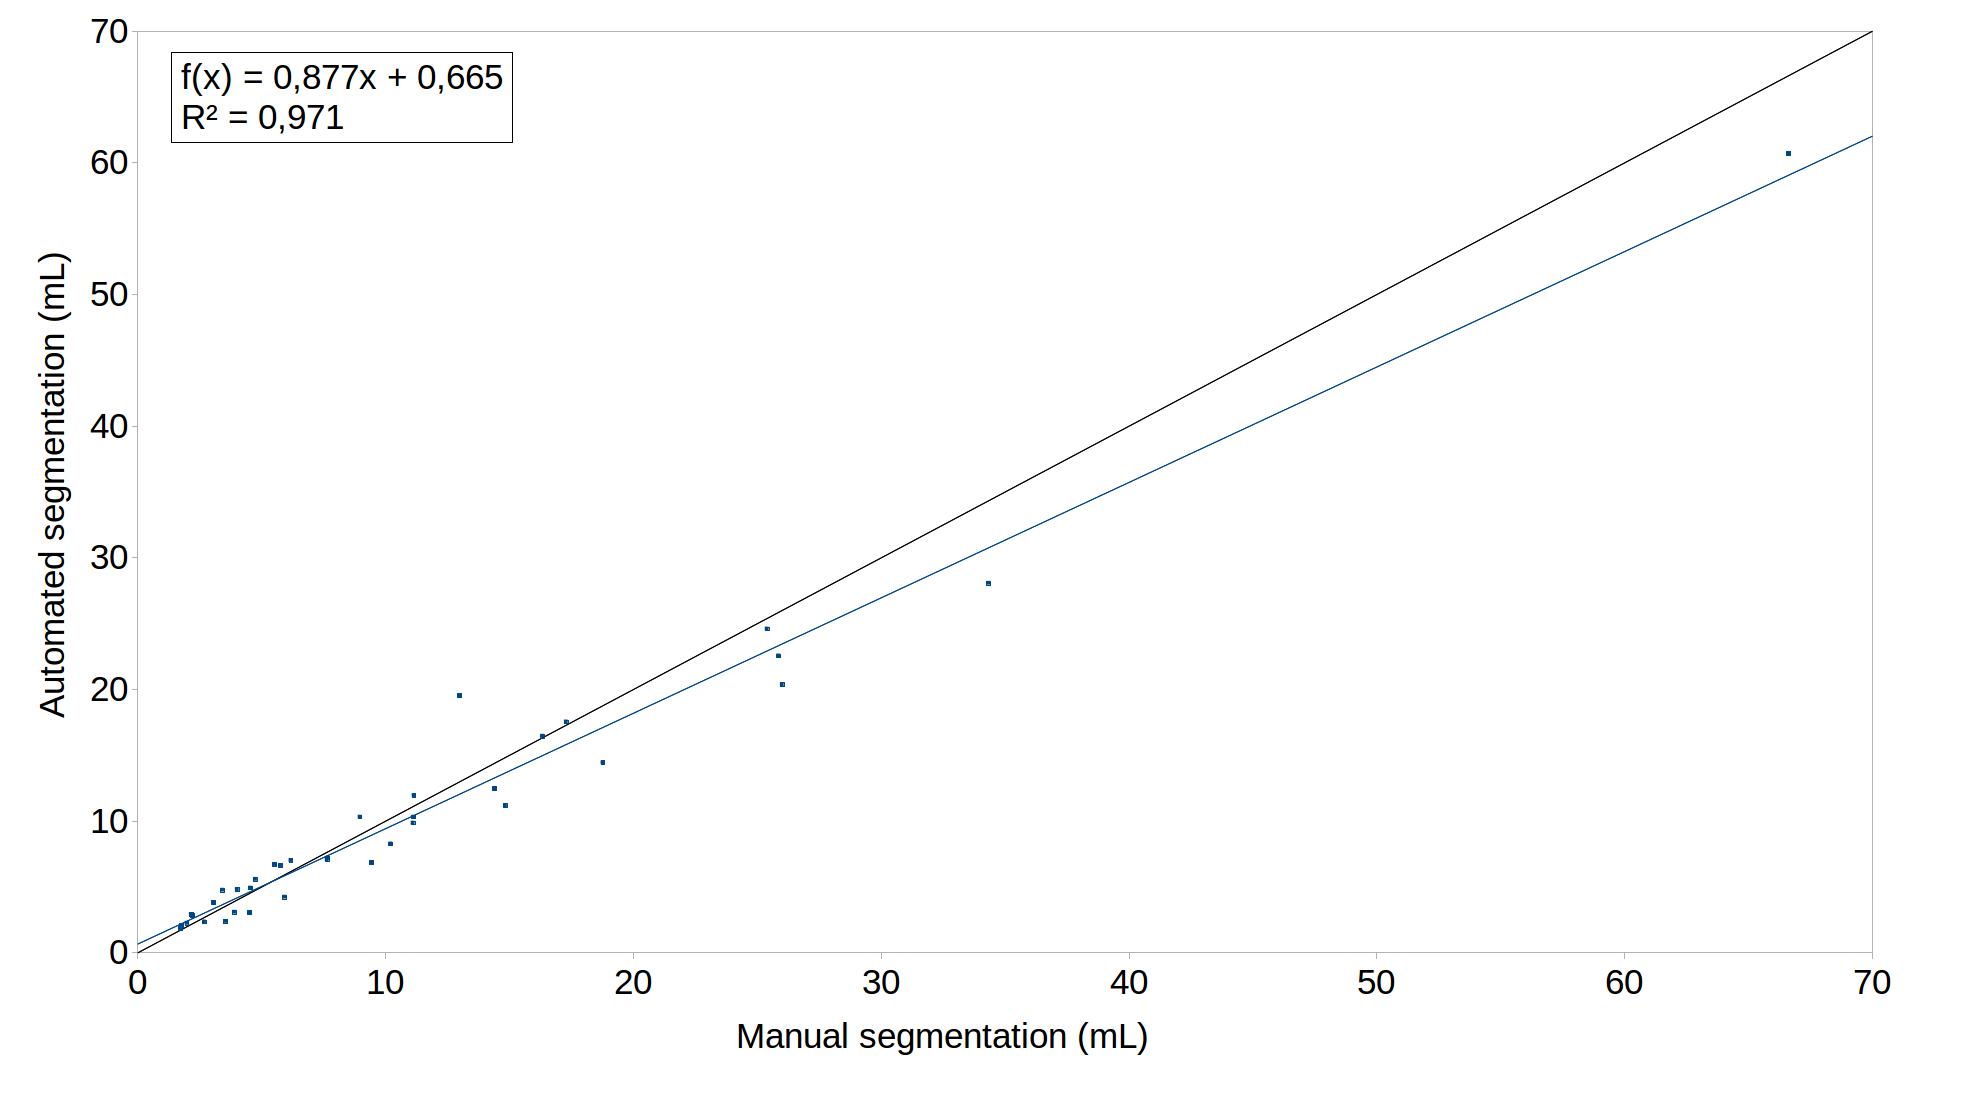
As presented in Figure 2, QyScore performed well on low lesion loads and remained accurate on very low lesion loads, while maintaining its accuracy on medium and higher lesion loads. Figure 3 shows a linear regression between manual and automated quantification in order to visualize the volumetric agreement: we found an excellent agreement (R2 = 0.97) between manual and automated lesion volume for the whole dataset. Figure 4 shows the color-scaled maps resulting from the longitudinal analysis of WM lesions evolution. The color gradient illustrates the magnitude of lesion evolution, derived from intensity differences: increase (from red to yellow), decrease (from green to blue) and static (no color).Discussion and conclusion
Compared to recent studies [4, 5], the proposed automated lesion segmentation method provides similar results for medium and high lesion loads and more accurate lesion segmentation for lower lesion loads. We have also shown that our longitudinal characterization enables visual assessment of lesion evolution. It could be, thus, a valuable tool for clinical routine and clinical trials, since it provides reliable, reproducible and robust quantification of lesions within minutes. With these algorithms, QyScore will deliver better comparisons and analysis of MS evolution, even in the early phases of the disease when the lesions load is low. A further validation of the lesions segmentation method will be to assess its performance on (a) two additional MS clinical phenotypes (Primary Progressive and Secondary Progressive) and (b) a larger variety of MR scanners (different manufacturers and models). The latest will also be useful for the longitudinal method validation, since the subject will be scanned at two different timepoints on several scanners sets.Acknowledgements
The data have been provided by CHU-Bordeaux and we thank the team for their help.References
[1] Samaille T, Fillon L, Cuingnet R, Jouvent E, Chabriat H, Dormont D, Colliot O, Chupin M. Contrast-Based Fully Automatic Segmentation of White Matter Hyperintensities: Method and Validation. Plos One. 7(11): e48953, 2012.
[2] Robitaille N, Mouiha A, Crépeault B, Valdivia F, Duchesne S, The Alzheimer’s Disease Neuroimaging Initiative. Tissue-Based MRI Intensity Standardization: Application to Multicentric Datasets. International Journal of Biomedical Imaging, vol. 2012, article ID 347120.
[3] Dice LR. Measures of the Amount of Ecologic Association Between Species. Ecology. 26: 297–302, 1945.
[4] Jain S, Sima DM, Ribbens A, Cambron M, Maertens A, Van Hecke W, De Mey J, Barkhof F, Steenwijk MD, Daams M, Maes F, Van Huffel S, Vrenken H, Smeets D. Automatic segmentation and volumetry of multiple sclerosis brain lesions from MR images. NeuroImage: Clinical. 8: 367-75, 2015.
[5] Egger C, Opfer R, Wang C. MRI FLAIR lesion segmentation in multiple sclerosis: Does automated segmentation hold up with manual annotation? NeuroImage: Clinical. 13: 264-270, 2017.
Figures