2843
Interactive Tool to Create Adjustable Anatomical Atlases for Mouse Brain Imaging1Neuroimaging, Central Institute of Mental Health, Medical Faculty Mannheim, Heidelberg University, Mannheim, Germany, 2RG Translational Imaging, Central Institute of Mental Health, Medical Faculty Mannheim, Heidelberg University, Mannheim, Germany, 3Experimental Radiation Oncology, Department of Radiation Oncology, University Medical Center Mannheim, Heidelberg University, Mannheim, Germany, 4Psychiatry and Psychotherapy, Central Institute of Mental Health, Medical Faculty Mannheim, Heidelberg University, Mannheim, Germany
Synopsis
Brain atlases enable researchers to focus their investigations on specific anatomically defined brain regions and are used in many MRI applications like fMRI, morphometry, whole brain spectroscopy, et cetera. Despite their great use and numerous variants they usually consist of rigid predefined brain regions with a given level of detail often degrading them a non-ideal tool in special research topics. We present a GUI application which allows researchers to easily create mouse brain atlases with an adjustable level of detail and coverage to match specific research questions.
Background
In many MRI post-processing procedures brain atlases are used to investigate anatomically defined brain regions like fMRI, morphometry, whole brain spectroscopy, et cetera. These brain atlases enable researchers to focus their investigations on brain areas by combining the voxel-based MR data from one or several brain regions of interest (ROI).
Brain atlases available and standardly used in MR research (for instance WFU Pickatlas1, AAL2, Talairach 3, Paxinos mouse and rat atlases4,5) are usually restricted to their initial definition and therefore are inflexible. The modification of defined brain regions can be complicated and, thus, the level of detail is set (for instance defining a sub-area of a ROI usually is only possible with big effort).
An atlas thereby usually consists of two datasets: 1) the annotation image file which consists of integer numbers in a 3D space representing the location of anatomically defined brain regions and 2) a corresponding file (often a text file) which links the numbers of the annotation image with the name of the brain regions.
Method
We present a GUI application (written in MATLAB , The MathWorks, Inc., Natick, Massachusetts, United States) which allows researchers to easily create mouse brain atlases with an adjustable level of detail and coverage to match specific research questions.
Based on the Allen Mouse Common Coordinate Framework brain atlas6 the user can select and afterwards export ROIs in a newly created atlas. This procedure yields an image file (in nifty format; .nii) containing the annotation/anatomical information together with a text file linking the integer numbers of the annotation image with the brain regions. These files can then be used like any other typical atlas-defining files.
The underlying data structure of the Allen Mouse brain atlas is given in initially big brain divisions (e.g. 'Basic cell groups', 'fiber tracts', etc.) which are 'parent'-regions whose children, grandchildren, great-grandchildren and so on are defining finer and finer, and thus more specific, brain regions. Due to the very high resolution of the Allen atlas (up to 10µm; isotropic) ROIs reach the level of single neuronal layers. As a compromise between data size and detail of ROIs we chose the 50µm variant.
Result
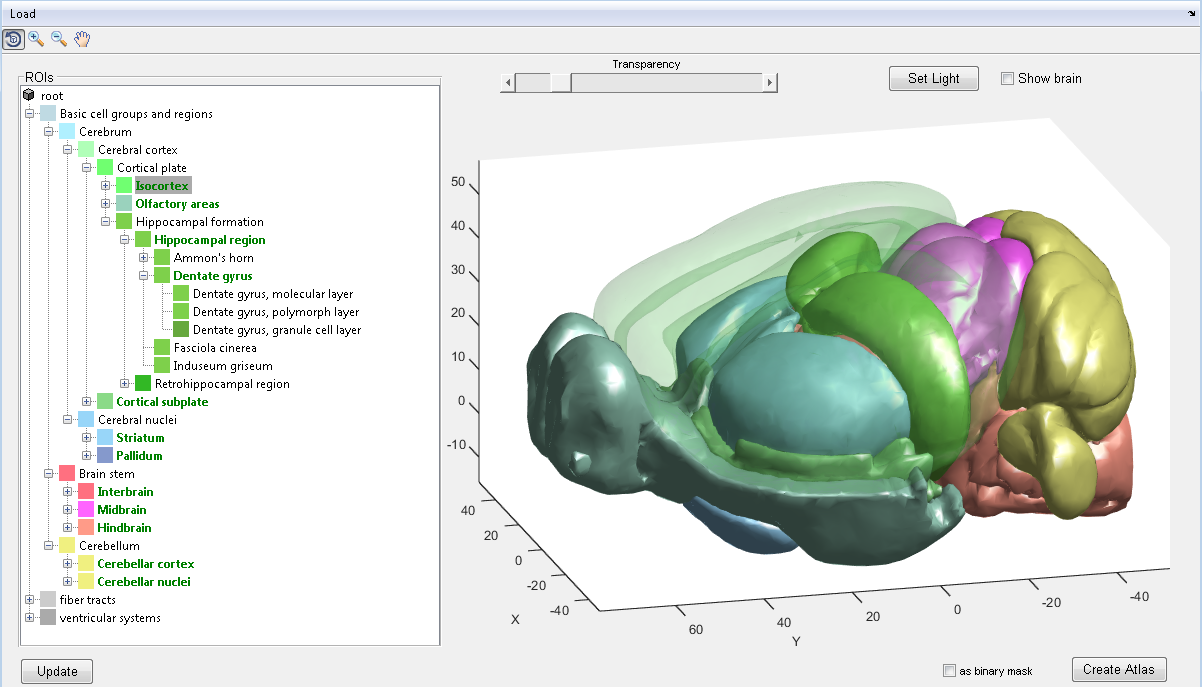
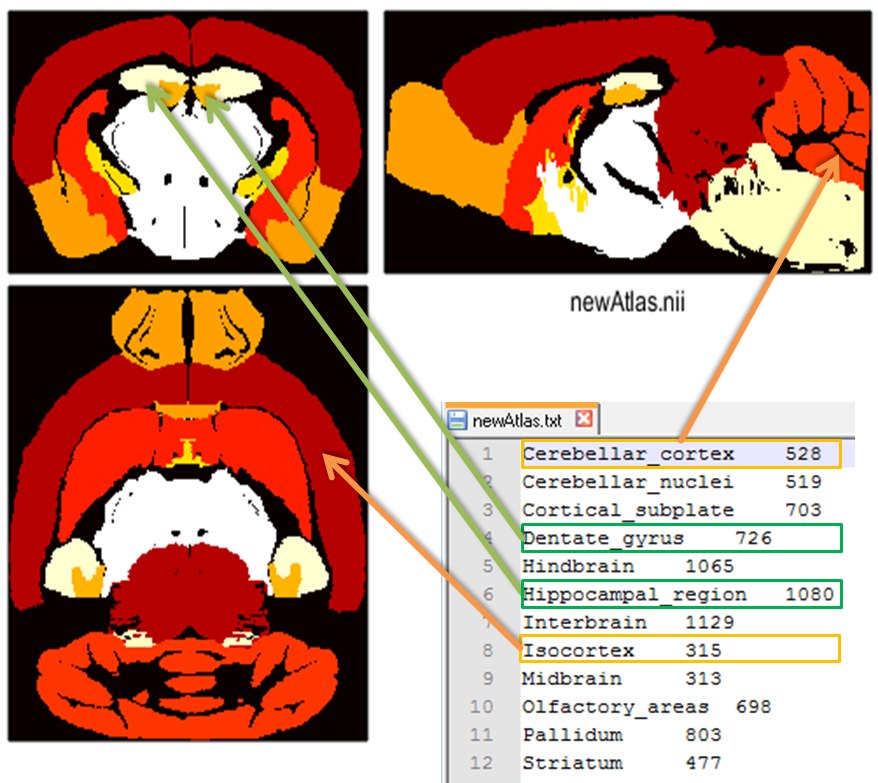
In the application, the ROI hierarchical data structure is represented as a tree (see Fig.1 left) which grows with the necessary levels of detail. To select ROIs the user simply right-clicks on a node in the tree (selected regions are in a green font) and the application combines the subjacent defined brain structure. For a coarse visual inspection, a 3D model of the selected ROIs can be presented (the ‘transparency’ slider sets the transparency of a selected ROI, see Fig.1 right). After creating an atlas it is immediately presented in the SPM7 'Check Reg' function providing the possibility for a more detailed inspection (see Fig.2; with an additional example of the annotation text file).
Further functionalities include:
- Exporting selected ROIs as a binary mask file or mask files each representing the selected ROIs.
- Possibility to select ‘parental’ ROIs and additionally some of their sub-areas.
- For a less complicated integration of already established post-processing routines the created atlas is transformed into Paxinos space.
- A 'load' function based on a txt file to modify an already created atlas.
- For non MATLAB users there is also a standalone version which only requires the freely available MATLAB runtime environment.
Discussion
The presented application allows scientists to create mouse brain atlases with a level of detail matching their obtained data resolution and/or their specific research question. Due to its simplicity and flexibility we hope that it becomes a useful tool of which we plan to provide free downloads in the near future. Furthermore, we will explore the possibility to extend the application by other datasets as e.g. 'developing mouse' or human brain atlases.Acknowledgements
No acknowledgement found.References
1 Maldjian, J. A., Laurienti, P. J., Kraft, R. A. & Burdette, J. H. An automated method for neuroanatomic and cytoarchitectonic atlas-based interrogation of fMRI data sets. Neuroimage 19, 1233-1239 (2003).
2 Rolls, E. T., Joliot, M. & Tzourio-Mazoyer, N. Implementation of a new parcellation of the orbitofrontal cortex in the automated anatomical labeling atlas. Neuroimage 122, 1-5, doi:10.1016/j.neuroimage.2015.07.075 (2015).
3 Talairach, J. & Tournoux, P. Co-planar stereotaxic atlas of the human brain. 3-Dimensional proportional system: an approach to cerebral imaging. (1988).
4 Paxinos, G. Paxinos and Franklin's the mouse brain in stereotaxic coordinates. (Academic Press, 2013).
5 Paxinos, G. & Watson, C. (Academic Press, San Diego, 1998).
6 Lein, E. S. et al. Genome-wide atlas of gene expression in the adult mouse brain. Nature 445, 168, doi:10.1038/nature05453 (2006).
7 Penny, W. D., Friston, K. J., Ashburner, J. T., Kiebel, S. J. & Nichols, T. E. Statistical parametric mapping: the analysis of functional brain images. (Academic press, 2011).
Figures