2842
Interactive and flexible quality control in fMRI sequence evaluation: the uniQC toolbox1Centre for Advanced Imaging, The University of Queensland, Brisbane, Australia, 2Institute for Biomedical Engineering, ETH Zurich and University of Zurich, Zurich, Switzerland, 3Translational Neuromodeling Unit (TNU), Institute for Biomedical Engineering, University of Zurich and ETH Zurich, Zurich, Switzerland
Synopsis
We present a unified neuroimaging quality control (uniQC) toolbox that enables flexible, interactive assessment of various quality measures on n-dimensional imaging data in Matlab. Key features are its seamless integration in the interactive Matlab command window and the intuitive concatenation of imaging and plot operations using operator overloading that enables fast prototyping of artefact detection and data analysis pipelines. The object-oriented design provides a general framework for n-dimensional data handling that can be utilized for fMRI sequence development and quality control.
Introduction
The challenge of unified and comprehensive quality control (QC) in (functional) MRI results from the vast amount of artefact sources combined with the complex processing pipelines applied to the data. Beyond standard image quality measures, MRI sequence development is often in need of flexible diagnostic tools to test diverse hypotheses on artefact origin, such as gain fluctuations, k-space spikes, or subject movement. These tests are usually performed in a sequential order, where one outcome informs the next evaluation. This necessitates fast switching between mathematical image operations and interactive display to assess image properties from a range of different perspectives. Additionally, direct access to fMRI analysis software is required to ultimately evaluate functional sensitivity of new sequence prototypes. In this work, we introduce the uniQC toolbox that provides seamless combination of algebraic matrix operations, image processing, visualisation and data provenance in an intuitive, object-oriented framework using SPM [1] and Matlab [2]. Therein, processing of 4D image time series data is generalized to an arbitrary number of dimensions to handle data from multiple receiver coils, multi-echo or phase fMRI data in a unified framework along with classical statistical analysis and powerful visualisation options. Here, we present the underlying class structure of the uniQC toolbox and typical use cases in fMRI sequence development.Methods
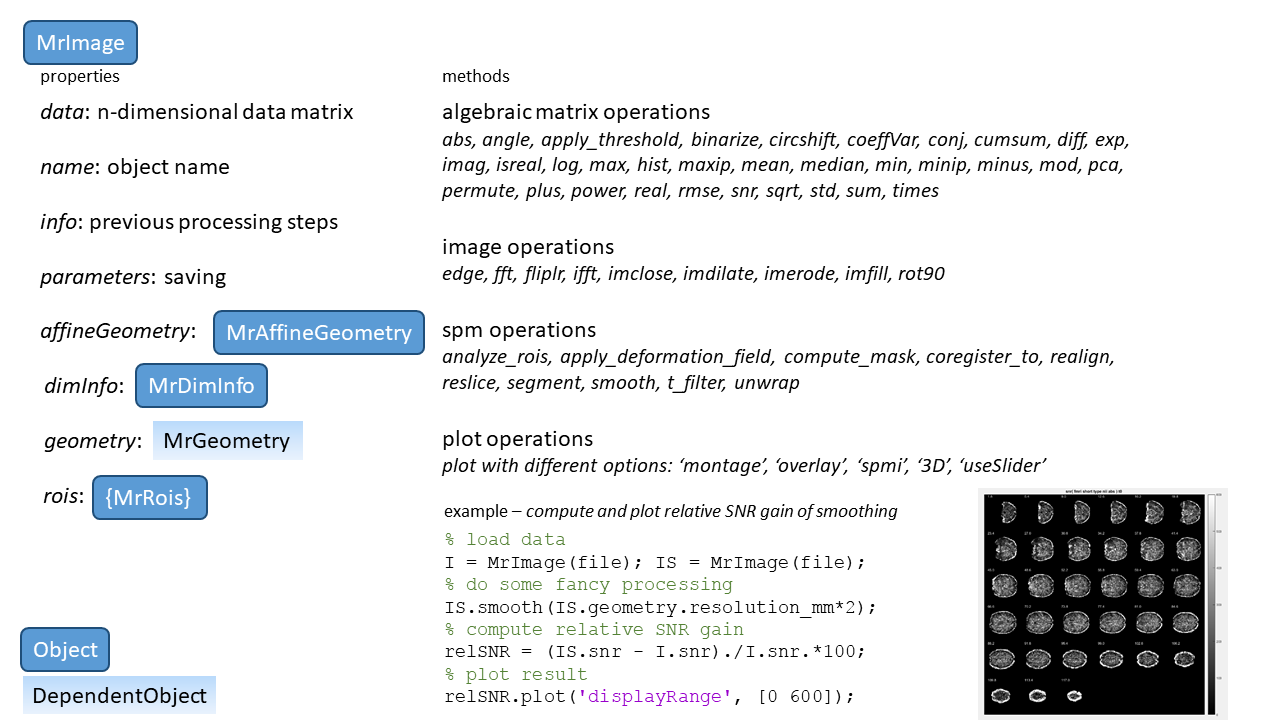
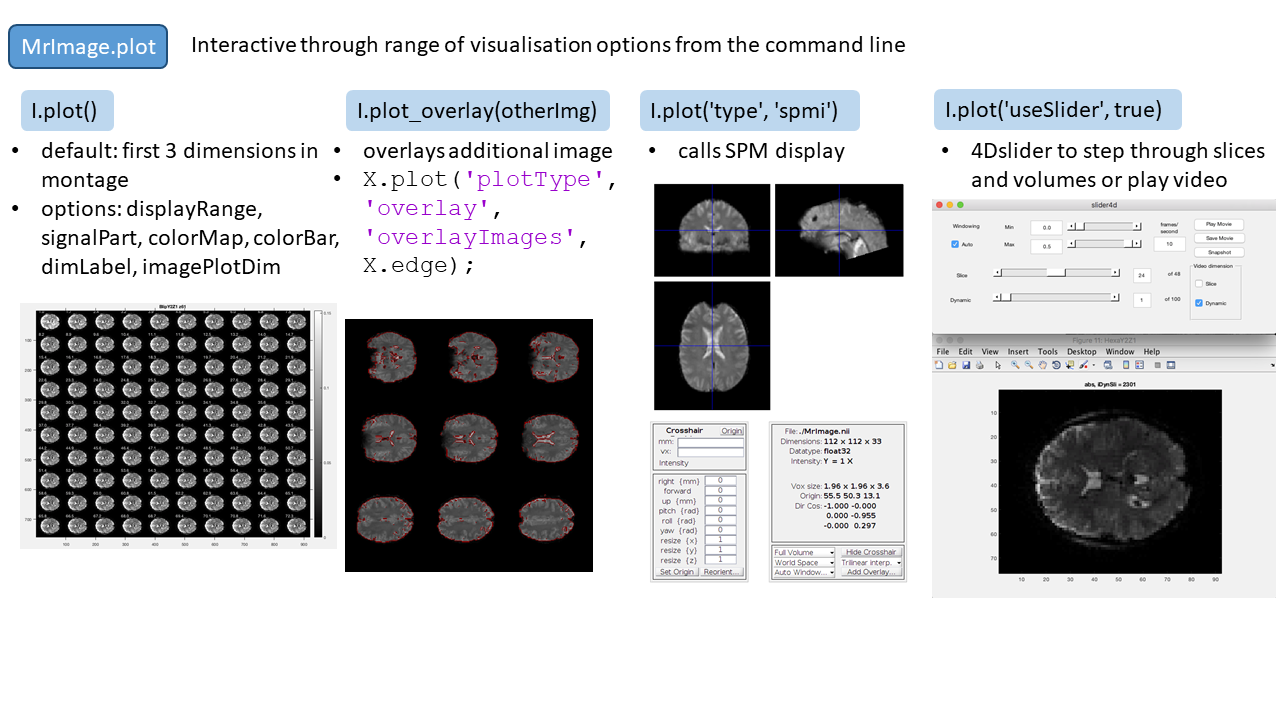
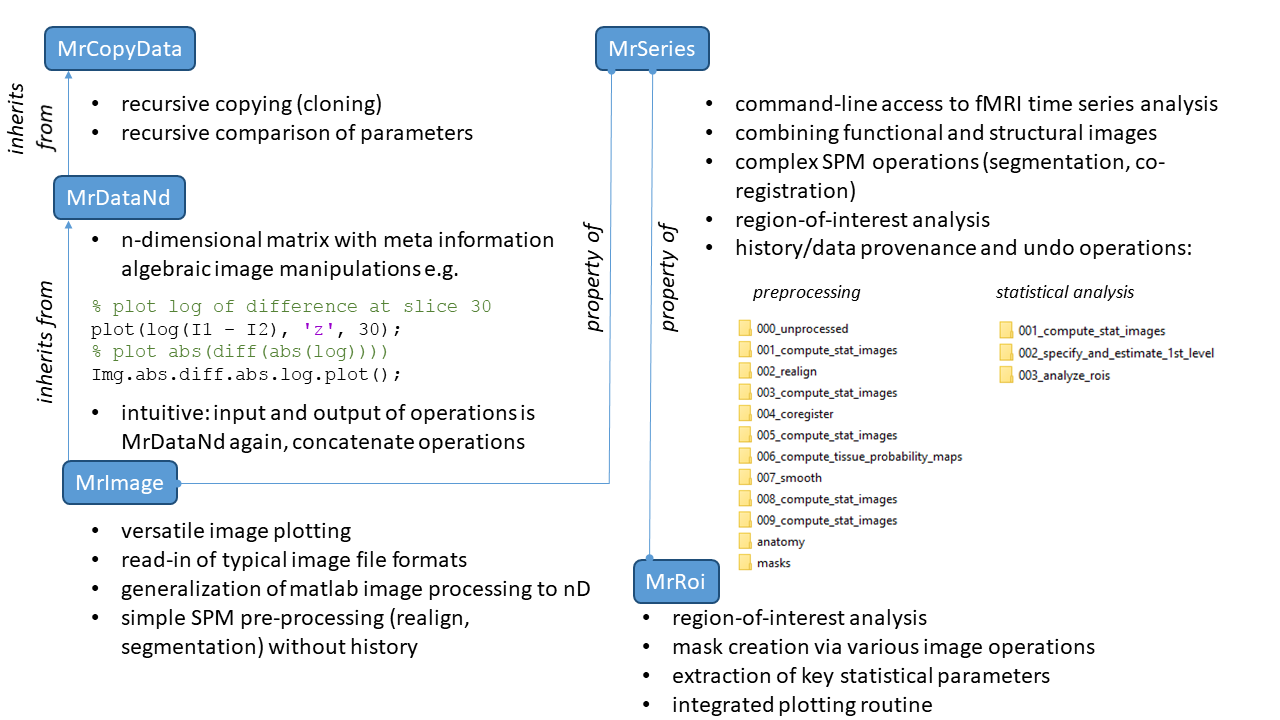
UniQC utilises the object-oriented framework in Matlab providing intuitive access to n-dimensional image data, corresponding meta-data, processing and visualisation methods. Importantly, image processing steps can be easily concatenated, and their effect evaluated via integrated display options directly from the command line. The key class is MrImage (I=MrImage) (Fig. 1), whose properties contain the data of an n-dimensional image, meta-data describing the affine geometry and dimensionality information, and statistical information about regions-of-interest (Fig. 1, left). Methods include voxel-wise algebraic operations (I.abs, log(I1-I2)), image operations (I.edge), SPM operations (I.segment), and visualisation options (I.plot) (Fig. 1, right). Methods are interactively accessible in the Matlab command window through the intuitive concatenation of image processing and plot operations using operator overloading (plot(I1.abs-I2.abs)). The plot method of MrImage provides several visualisation options, such as displaying the n-dimensional data matrix, overlays, 3D visualisation through the SPM display option, and a 4D-slider to step through slices and volumes (Fig. 2). MrImage inherits from MrDataNd, which is a general class to handle n-dimensional data providing algebraic matrix operations and storage of meta-data (Fig. 3, left). MrDataNd can hold arbitrary, non-image data, such as k-space data. MrSeries is a class designed for common fMRI analyses providing integration of anatomical and functional data and data provenance by saving results in a folder structure after each processing step (Fig. 3, right). In this way, restoring previous processing steps is straightforward. MrSeries' properties are a number of MrImage objects to hold key data for fMRI time series analysis, such as the functional data itself, anatomical data, mean, snr, tissueProbabilityMaps and masks. When the corresponding method is called, these images are automatically populated in the MrSeries object (S.compute_stat_images, S.compute_tissue_probability_maps). MrRoi provides methods for extracting data from regions-of-interest and perform statistical analysis. Currently, nifti, Matlab and par/rec files are supported as input. Unit testing has been explored in MrUnitTest for MrDimInfo, which holds the meta-data for MrDataNd, including labels, units and sampling points for each dimension, and allows fast retrieval of meta-information from arbitrary labels (dimInfo.z.nSamples, dimInfo.myDimLabel.samplingPoints).Results
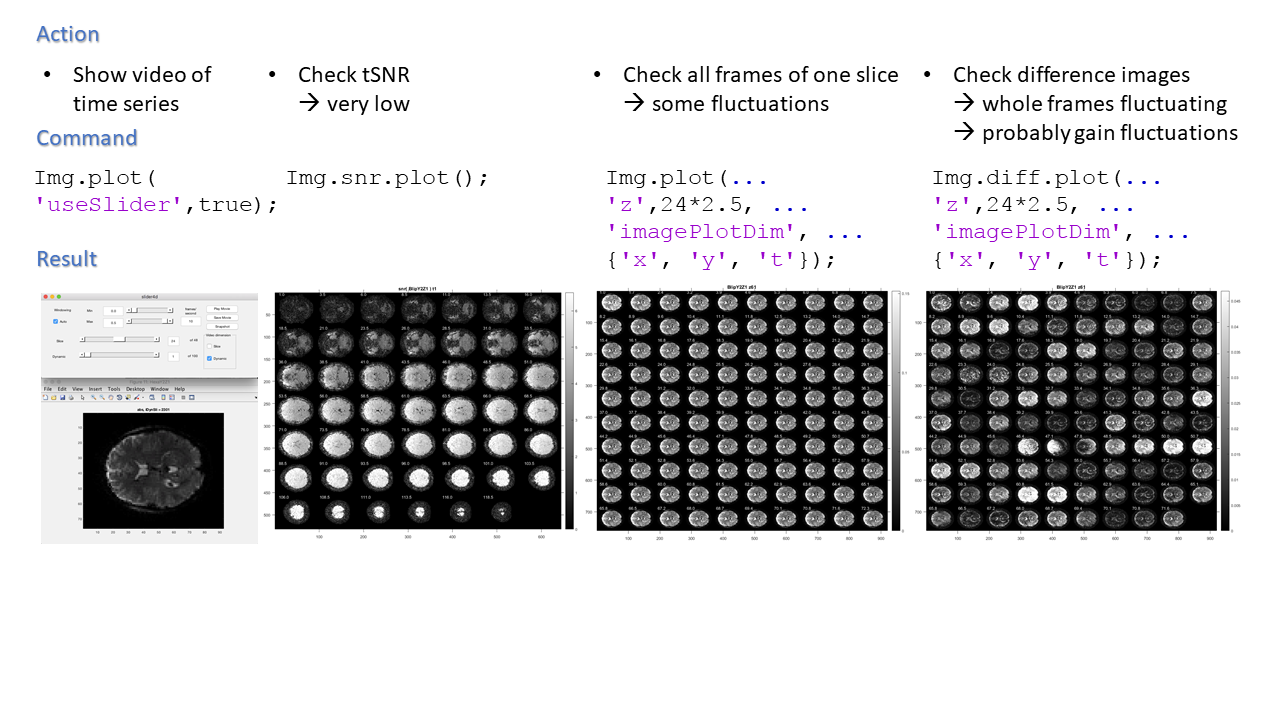
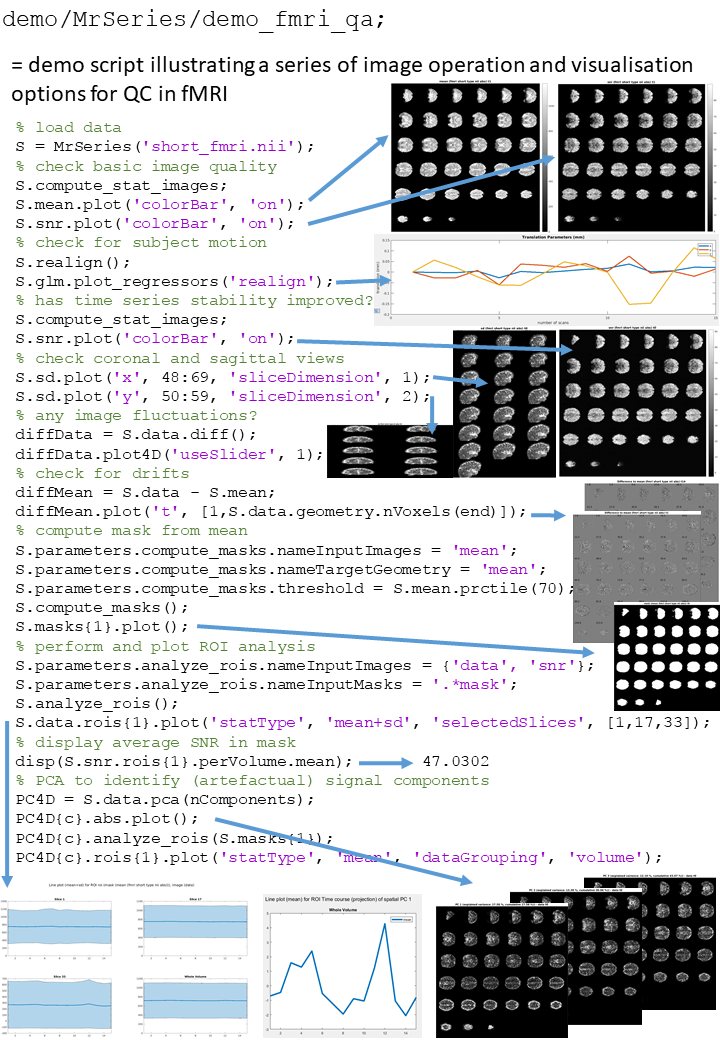
Figure 4 and 5 illustrate the integration of image processing and data visualisation offered in uniQC. In detail, a low temporal SNR is detected in the data set in Figure 4, and by plotting the consecutive difference of a selected slice, gain fluctuations could be identified. A general QC pipeline is presented in Figure 5, where basic image quality measures, subject motion and a PCA to identify artefactual signal components are displayed.Discussion and Conclusion
We have presented a unifying (f)MRI quality control toolbox
that allows fast prototyping and artefact characterization by integrating arbitrary
and concatenated image operations of n-dimensional data and their visualization.
Strengths are the intuitive algebraic notation and the re-use of powerful image
and fMRI processing algorithms by interfacing SPM and Matlab toolboxes. While
the focus was on interactive data handling, complex pipelines can be readily established
and are inherently documented through the employed output structure. Choosing
Matlab allows the operating system independent distribution and an unhampered
transition for SPM users. In conclusion, uniQC offers an alternative to other
QC pipelines focusing on automation and high throughput, and instead allows for
flexible interaction with the data. UniQC is an open source software and will
be made publicly available as part of the TAPAS software suite [3].Acknowledgements
SB acknowledges support through the Australian Government Research Training Program Scholarship. MB acknowledges funding from Australian Research Council Future Fellowship grant FT140100865.References
[1] SPM 12, Wellcome Trust Centre for Neuroimaging, London, UK
[2] Matlab 2017a, The MathWorks, Inc., Natick, Massachusetts, United States
[3] https://github.com/translationalneuromodeling/tapas
Figures