2841
Volumetric Mesh-based Mapping of the Placenta to a Canonical Template for Visualization of Regional Anatomy and Function1Electrical Engineering and Computer Science, Massachusetts Institute of Technology, Cambridge, MA, United States, 2Computer Science and Artificial Intelligence Laboratory, Massachusetts Institute of Technology, Cambridge, MA, United States, 3Fetal-Neonatal Neuroimaging and Developmental Science Center, Boston Children's Hospital, Harvard Medical School, Boston, MA, United States, 4School of Biomedical Engineering, Shanghai Jiao Tong University, Shanghai, China, 5Radiology, Harvard Medical School, Boston, MA, United States, 6Athinoula A. Martinos Center for Biomedical Imaging, Massachusetts General Hospital, Charlestown, MA, United States, 7Institute for Medical Engineering and Science, Massachusetts Institute of Technology, Cambridge, MA, United States, 8Maternal and Fetal Medicine, Brigham and Women's Hospital, Harvard Medical School, Boston, MA, United States, 9Maternal and Fetal Medicine, Obstetrics & Gynecology, Massachusetts General Hospital, Harvard Medical School, Boston, MA, United States, 10Obstetrics and Perinatal Pathology, Massachusetts General Hospital, Harvard Medical School, Boston, MA, United States
Synopsis
We demonstrate a volumetric mesh-based mapping of the placenta to a canonical template that resembles the better-known ex vivo shape. Placental shape presents significant challenges for visualization of the associated signals. No standard framework exists for visualizing the organ in vivo. Our approach is to flatten a volumetric mesh that captures subject-specific placental shape while penalizing local distortion to maintain anatomical fidelity. The resulting algorithm produces an invertible transformation to the canonical template. To demonstrate the promise of the proposed approach, we present visualization of BOLD MRI intensity and oxygenation measures after mapping them to a flattened placenta template.
Purpose
Monitoring placental function in vivo promises to support pregnancy assessment and to improve care outcomes. Blood oxygen level dependent (BOLD) magnetic resonance imaging (MRI) with maternal hyperoxia has been shown recently to provide characterization of placental function in vivo.1 We demonstrate an approach for mapping the placenta to a canonical template to enable intuitive visualization of the placenta embedded in the 3D MRI scan. The advantage of such visualization was first demonstrated via surface-based flattening of nested level sets of the placental shape.2 In contrast, we propose a continuous volumetric mapping that simulates a physical deformation of the organ. This approach enables us to explicitly control local volumetric distortion in the resulting flatted placenta. Our formulation naturally accepts a wide range of penalty functions that encourage desired geometric properties of the mapping.Methods
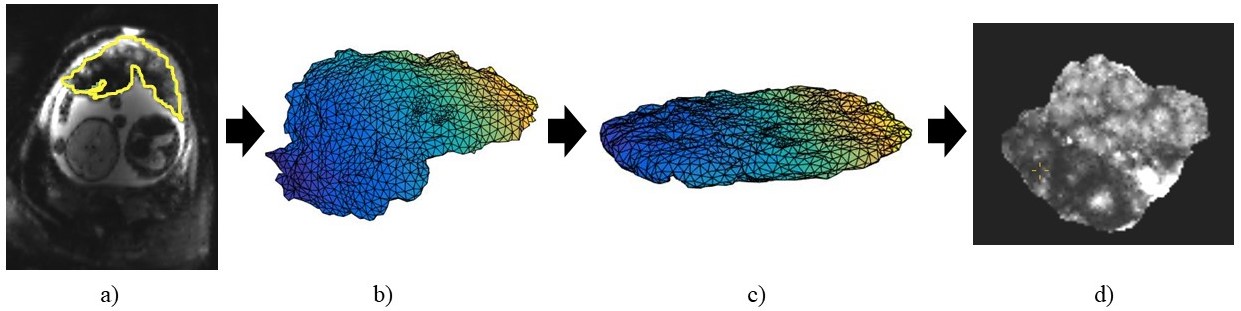
Subjects: This IRB approved study enrolled seven women with twin pregnancy (gestational age: 29-34 weeks). Acquisition: MRI BOLD scans were acquired on a 3T Skyra scanner (Siemens Healthcare, Erlangen, Germany) using single-shot gradient echo with 3mm isotropic voxels, TR=5.8-8s, TE=32-38ms, FA=90°. The maternal oxygenation paradigm included 10min of room air (21% O2), followed by 10min of 100% O2, followed by another 10min of room air. To assess the placenta after birth, histopathology was performed by an experienced placental pathologist blinded to the MRI findings. A subjective score from 1 (mild pathology) to 4 (severe pathology) was given for each placental region.1 Processing: The placenta was manually segmented in the first volume of each BOLD MRI series. Time-to-plateau (TTP) of the BOLD signal was evaluated at every voxel within the placental segmentation to quantify the delay in oxygen saturation from the start of maternal hyperoxia.1 Algorithm: We first generate a volumetric tetrahedral mesh that accurately represents the segmentation of the placenta.3 We then map the mesh to a canonical coordinate system by minimizing a cost function that comprises a data term, which penalizes deviations of the surface vertices of the mesh from the ellipsoidal template, and a regularization term, which penalizes the local volume distortion metric.4-6 We employ gradient descent with line search to estimate the optimal deformation of the mesh.7 Bijectivity is enforced at every step of the optimization procedure.6 Finally, image values associated with specific locations within the placenta are transferred into the canonical coordinate system for visualization (Figure 1).Results and Discussion
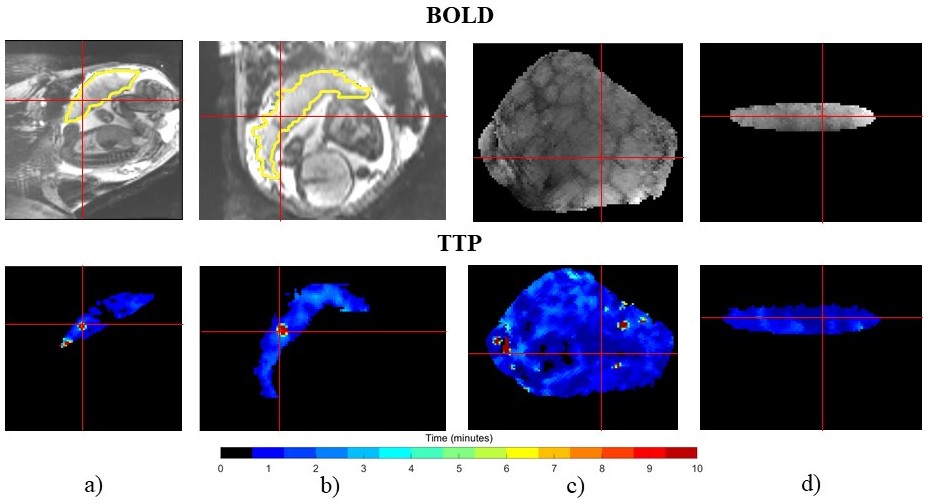
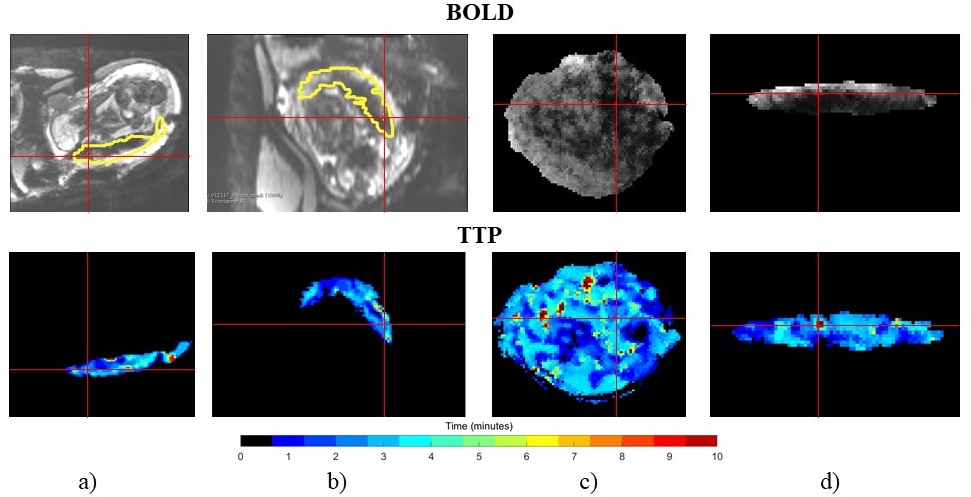
Figures 2 and 3 present the mapping results for two subjects. For each subject, we display the image intensity in the first volume of the BOLD MRI series and the TTP values estimated from the entire series. Both types of information are shown in the original image space and in the canonical template space to enable the comparison of visualization effectiveness. Figure 2 shows a healthy twin pregnancy with both placenta regions associated with each twin assigned a pathology score of 2 (mild pathology). Figure 3 shows a twin pregnancy where the placenta region associated with one twin was healthy (score of 1, no pathology) and the placenta region associated with another twin contained a pathology (score of 4, severe pathology). We note that TTP values are higher (i.e., longer delay) and more heterogeneous in the pathological regions of the placenta, which is consistent with the findings of the previous study.1 Our visualization method brings forth the spatial pattern of the delay. We also observe differences in the BOLD image texture between the two regions of the placenta, which is nearly impossible to appreciate in the original volume.
These results suggest many potential applications. Enhanced visualization of BOLD signal differences across the placental volume promises to facilitate segmentation of the placenta into functionally homogeneous regions. The mapping provides spatial context and can assist clinicians in localizing regional pathology. Future studies will assess the utility of the flattened views for detecting placental pathology, thereby improving monitoring of fetal health. The standardized visualization framework will facilitate comparisons across time and across subjects, improving placental health monitoring and statistical analysis.
Conclusion
We demonstrated a method for volumetric mapping of the placenta to a canonical template that resembles the ex vivo shape of the organ. The mapping is based on deformations of a volumetric mesh, which represents the in vivo placental shape, to a canonical template while minimizing local volumetric distortion. The proposed method improves visualization of image texture and of derived measures of placental function for visual assessment and subsequent analysis. Our results highlight spatial variations of oxygen delivery within the placenta, showing promise for clinical use.Acknowledgements
NIH NIBIB NAC P41EB015902, NIH NICHD U01HD087211.References
1. Luo, J., Turk, E. A., Bibbo, C., Gagoski, B., Roberts, D. J., Vangel, M., Tempany-Afdhal, C. M., Barnewolt, C., Estroff, J., Palanisamy, A., Barth, W. H., Zera, C., Malpica, N., Golland, P., Adalsteinsson, E., Robinson, J. N., & Grant, P. E. In Vivo Quantification of Placental Insufficiency by BOLD MRI: A Human Study. Scientific Reports. 2017;7(1):3713.
2. Miao, H., Mistelbauer, G., Karimov, A., Alansary, A., Davidson, A., Lloyd, D. F., Damodaram, M., Story, L., Hutter, J., Hajnal, J. V., Rutherford, M., Preim, B., Kainz, B., & Gröller, M. E. Placenta Maps: In Utero Placental Health Assessment of the Human Fetus. IEEE Transactions on Visualization and Computer Graphics 2017;23(6):1612-1623.
3. Fang, Q., & Boas, D. A. Tetrahedral Mesh Generation from Volumetric Binary and Grayscale Images. IEEE International Symposium on Biomedical Imaging: From Nano to Micro. 2009;ISBI ’09:1142-1145.
4. Sheffer, A., Praun, E., & Rose, K. Mesh Parameterization Methods and Their Applications. Foundations and Trends® in Computer Graphics and Vision. 2007;2(2):105-171.
5. Rabinovich, M., Poranne, R., Panozzo, D., & Sorkine-Hornung, O. Scalable Locally Injective Mappings. ACM Transactions on Graphics (TOG). 2017;36(2):16.
6. Smith, J., & Schaefer, S. Bijective parameterization with free boundaries. ACM Transactions on Graphics (TOG). 2015;34(4):70.
7. Wright, S. J., & Nocedal, J. Numerical optimization. Springer Science. 1999;35(67-68):7.
Figures