2838
The Change of Adipose Tissues and Organ Fat-fraction in Patients with Morbid Obesity Before and After Bariatric Surgery1Department of Imaging and Interventional Radiology, The Chinese University of Hong Kong, Hong Kong, Hong Kong, 2Department of Surgery, The Chinese University of Hong Kong, Hong Kong, Hong Kong, 3Department of Clinical Oncology, The Chinese University of Hong Kong, Hong Kong, Hong Kong
Synopsis
The purpose of this study was to investigate the change of brown and white adipose tissue, as well as fat content in liver and pancreas, in patients with morbid obesity before and after bariatric surgery. mDixon sequence and proton MRS were used to measure fat content. Results indicated that weight, BMI, waist circumference, pancreatic fat, liver fat, subcutaneous and visceral adipose tissues were significantly reduced 6 – 12 months after surgery. The present study suggested that bariatric surgery effectively reduced the weight in patients with morbid obesity.
INTRODUCTION
The purpose of this study was to measure the change of brown and white adipose tissue, as well as fat-fraction in liver and pancreas, in patients with morbid obesity before and after bariatric surgery.METHODS
Twelve subjects (median age: 45.4 (38.4-51.2), BMI: 35.2 (32.5-38.6)) were recruited and underwent baseline pre-op MRI followed by two post-op MRI at 6-month interval. Inclusion criteria were patients between the age of 18-65 years, BMI >= 30 with diabetes mellitus type 2 or BMI >=35, and pending for bariatric surgery. Their anthropometries are expressed in median (interquartile range) as shown in Table 1.
All subjects underwent MRI using a 3.0 T whole-body scanner (Achieva X-series, Philips Medical System, Best, The Netherlands) with a 16-channel SENSE-XL-Torso array coil. Water-fat and T2* images were obtained from the neck to the pubic symphysis using the 3D spoiled chemical-shift water-fat sequence (TR = 5.7 ms, first TE/echo spacing = 1.2-1.4 (ms)/1.0-1.2 (ms), number of echoes = 6, flip angle = 3°, SENSE acceleration = 2). Image reconstruction was completed online using Philips mDixon product implementation with the seven-peak spectral model of fat to increase accuracy and sensitivity.
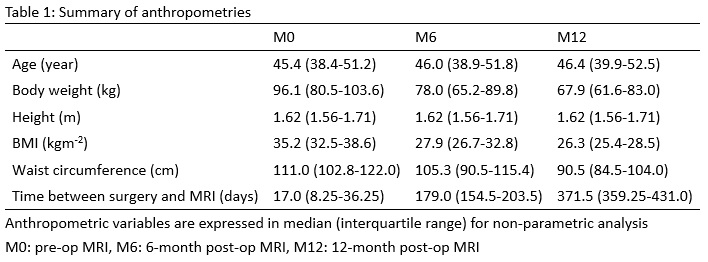
Proton MR point resolved spectroscopy (PRESS) (TE = 15 ms, TR = 5000 ms, spectral width = 2000 Hz, no water suppression, and eight signal averages) was used to obtain spectrum data for the measurement of intrahepatic triglycerides (IHTG). A 30x30x30-mm3 voxel was placed in the right liver lobe as shown in Figure 1. Data were exported for offline spectral analysis.
Brown, subcutaneous and visceral adipose tissues were measured using two different algorithms. Brown adipose tissue (BAT) was segmented and measured using an algorithm based on Gaussian mixture model in co-registered fat-faction, fat-only and T2* image series (1). Subcutaneous adipose tissues (SAT) and visceral adipose tissues (VAT) were segmented and measured using another in-house algorithm based on the features of narrow boundaries between SAT and VAT (2). Bone marrow at the pelvis level was also removed using the same algorithm.
Intrahepatic triglycerides was measured using jMRUI software package with the data obtained from 1H MRS (3). Water peak at 4.65 ppm and methylene lipid peak at 1.3 ppm were measured for relative fat signal amplitude in terms of a percentage of the total signal amplitude. IHTG content was calculated as [Ifat/(Ifat+Iwater)]x100 where Ifat and Iwater represented peak amplitudes of fat and water, respectively (4).
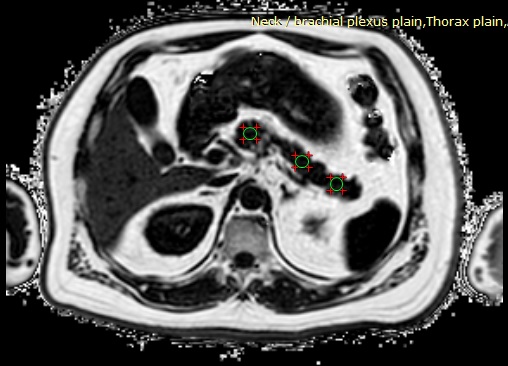
Pancreatic fat was measured using regions-of-interest (ROIs) based method in the abdominal chemical-shift fat-fraction images. Three operator-defined ROIs were drawn on the caput, corpus and cauda of the pancreas by an experience radiologist as shown in Figure 2 (5,6). The area of the ROIs was approximately 1.0 cm2. Major blood vessels included superior mesenteric artery and superior mesenteric vein were avoided to prevent signal contamination. Average signal intensity within the 3 ROIs was measured.
For non-parametric analysis, Friedman tests were performed to compare differences between groups for repeated measures variables acquired from the three different time points i.e. baseline pre-op, 6-month post-op and 12-month post-op MRI followed by Wilcoxon Signed-Rank test for post-hoc analyses. P-value with Bonferroni-adjusted level at 0.017 (0.05/3) was taken as statistical significance. All continuous variables are expressed in median (interquartile range) as shown in Table 2.
RESULTS
Pairwise comparisons indicated significant decreases were observed in BMI (p=0.005), pancreatic fat-fraction (p=0.009), intrahepatic triglycerides (p=0.005), subcutaneous (p=0.005) and visceral adipose tissues (P=0.005) mostly between the baseline to 6-month post-op scan, baseline to 12-month post-op, but not between 6-month to 12-month post-op scan. No significant changes were observed in brown adipose tissue. Full details are shown in Table 3.DISCUSSION
The present study showed that bariatric surgery could effectively reduce the weight of patients with morbid obesity. The decreased weight was mainly contributed by the reduction of subcutaneous and visceral adipose tissues. IHTG and pancreatic fat were also returned to a normal range after bariatric surgery. No significant changes were observed in the volume and other MR properties of brown adipose tissue. In addition, for white adipose tissue at the interscapular, supraclasvicular and cervical regions, fat-fraction and T2* values were significantly decreased; possibly reflecting an on-going browning process in which white fat was changing into beige fat (7).Acknowledgements
The work described in this paper was partially supported by grants from the Research Grants Council (Project No.: 14206716 and SEG_CUHK02) of the Hong Kong Special Administrative Region.References
1. Hui SCN, Ko JKL, Zhang T, Shi L, Yeung DKW, Wang D, Chan Q, Chu WCW. Quantification of brown and white adipose tissue based on Gaussian mixture model using water-fat and T2* MRI in adolescents. Journal of magnetic resonance imaging : JMRI 2017;46(3):758-768.
2. Hui SCN, Zhang T, Shi L, Wang D, Ip CB, Chu WCW. Automated segmentation of abdominal subcutaneous adipose tissue and visceral adipose tissue in obese adolescent in MRI. Magnetic resonance imaging 2017;45:97-104.
3. Stefan D, Di Cesare F, Andrasescu A, Popa E, Lazariev A, Vescovo E, Strbak O, Williams S, Starcuk Z, Cabanas M, van Ormondt D, Graveron-Demilly D. Quantitation of magnetic resonance spectroscopy signals: the jMRUI software package. Meas Sci Technol 2009;20(10).
4. van Werven JR, Hoogduin JM, Nederveen AJ, van Vliet AA, Wajs E, Vandenberk P, Stroes ES, Stoker J. Reproducibility of 3.0 Tesla magnetic resonance spectroscopy for measuring hepatic fat content. Journal of magnetic resonance imaging : JMRI 2009;30(2):444-448.
5. Patel NS, Peterson MR, Brenner DA, Heba E, Sirlin C, Loomba R. Association between novel MRI-estimated pancreatic fat and liver histology-determined steatosis and fibrosis in non-alcoholic fatty liver disease. Alimentary pharmacology & therapeutics 2013;37(6):630-639.
6. Heber SD, Hetterich H, Lorbeer R, Bayerl C, Machann J, Auweter S, Storz C, Schlett CL, Nikolaou K, Reiser M, Peters A, Bamberg F. Pancreatic fat content by magnetic resonance imaging in subjects with prediabetes, diabetes, and controls from a general population without cardiovascular disease. PloS one 2017;12(5):e0177154.
7. Harms M, Seale P. Brown and beige fat: development, function and therapeutic potential. Nature medicine 2013;19(10):1252-1263.
Figures