2836
Segmentation of Gray Matter, White Matter and Cerebrospinal Fluid with MP2RAGE1Center for Biomedical Imaging Research, Department of Biomedical Engineering, School of Medicine, Tsinghua University, Beijing, China, 2Vascular Imaging Laboratory, Department of Radiology, University of Washington, Seattle, WA, United States
Synopsis
Segmentation of gray matter (GM), white matter (WM) and cerebrospinal fluid (CSF) is an important tool for brain MRI research. A few challenges remain for the segmentation such as the image intensity non-uniformity induced by B1 field inhomogeneity, suboptimal data acquisition protocols and long processing time. We propose a fast automatic method which combines the data acquisition with segmentation and is insensitive to B1 field inhomogeneity using MP2RAGE. The proposed method has high accuracy and superior performance for the segmentation of subcortical gray matter and is applicable for a wide age range.
Introduction
Segmentation of gray matter (GM), white matter (WM) and cerebrospinal fluid (CSF) is an important tool for brain MRI research. A few challenges remain for the segmentation such as the image intensity non-uniformity induced by B1 field inhomogeneity, suboptimal data acquisition protocols and long processing time1-3. We propose a fast automatic method which combines the data acquisition with segmentation and is insensitive to B1 field inhomogeneity using MP2RAGE2.Methods
The MP2RAGE sequence was implemented on a Philips 3T scanner and used to acquire two images that were intrinsically co-registered. The sequence parameters were optimized to suppress WM in the first volume (M1) and CSF in the second (M2)4. In addition, we ensured that the GM signal of M2 (GM2) > the GM signal of M1 (GM1) and a ratio of GM2/GM1 = 1.6 was chosen, which lead to the following relationships: GM2 / GM1 = 1.6, WM2 >> WM1, WM2 > GM2 > CSF2, CSF1 > CSF2.
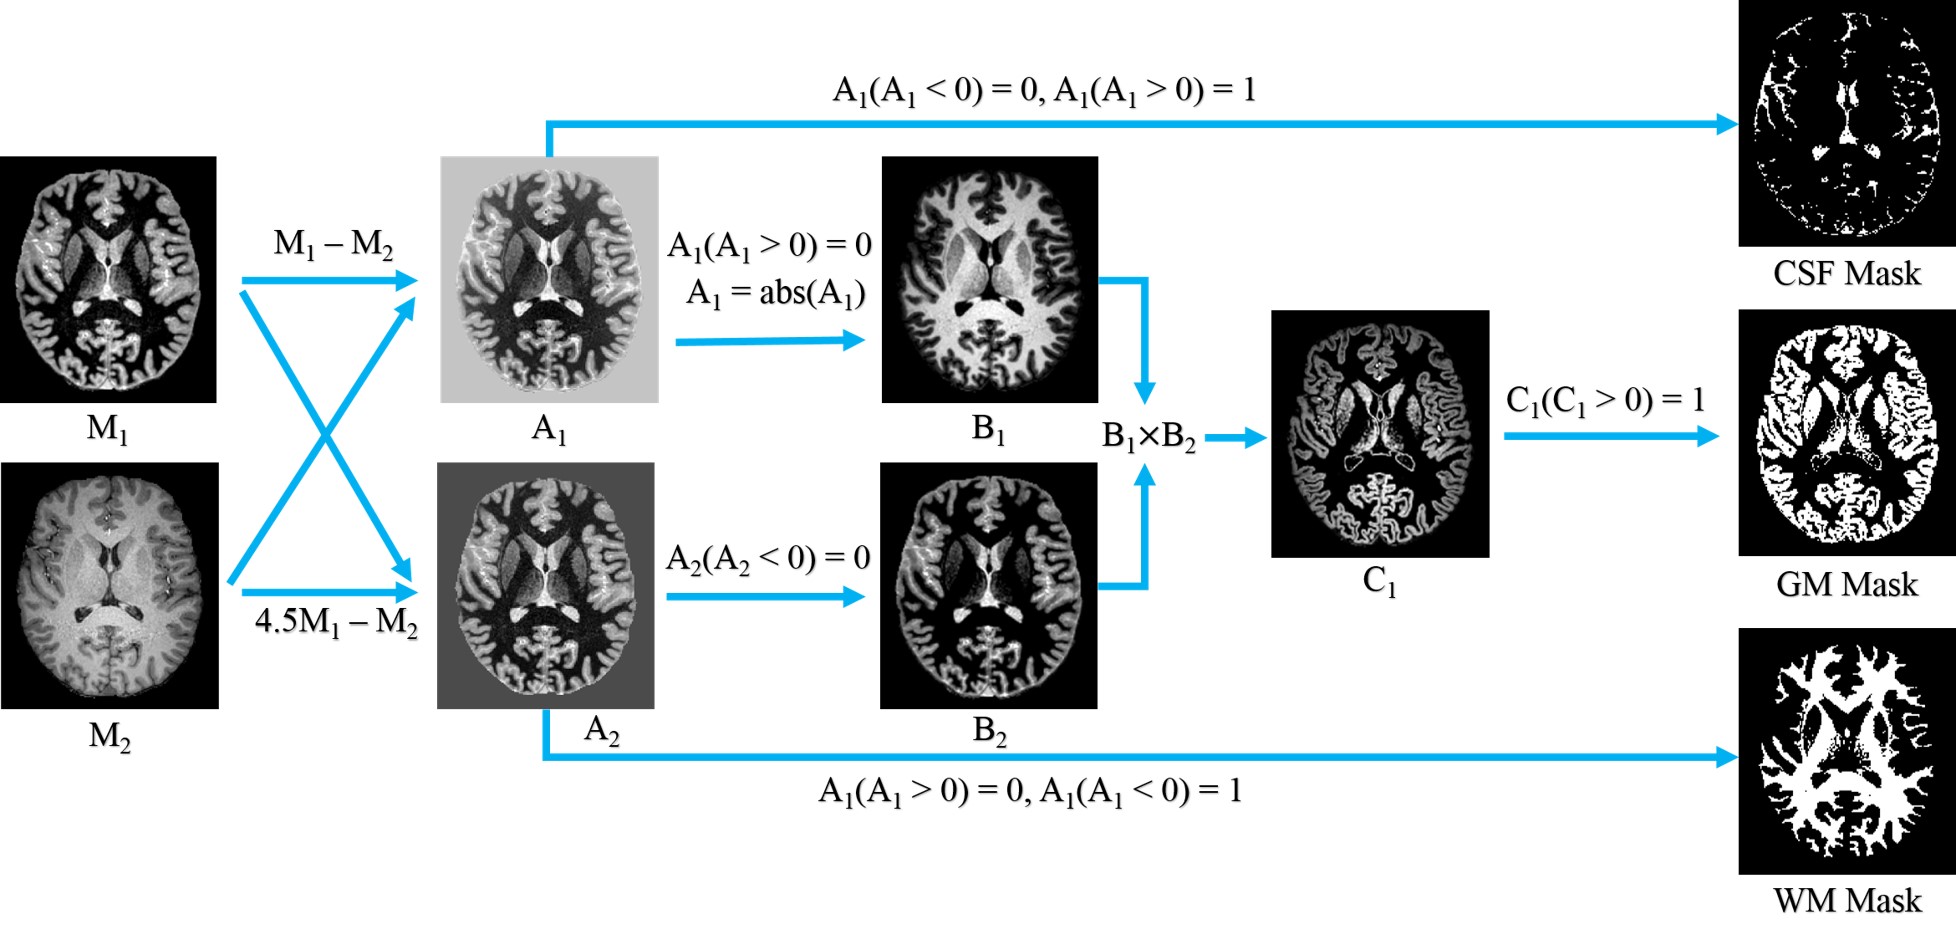
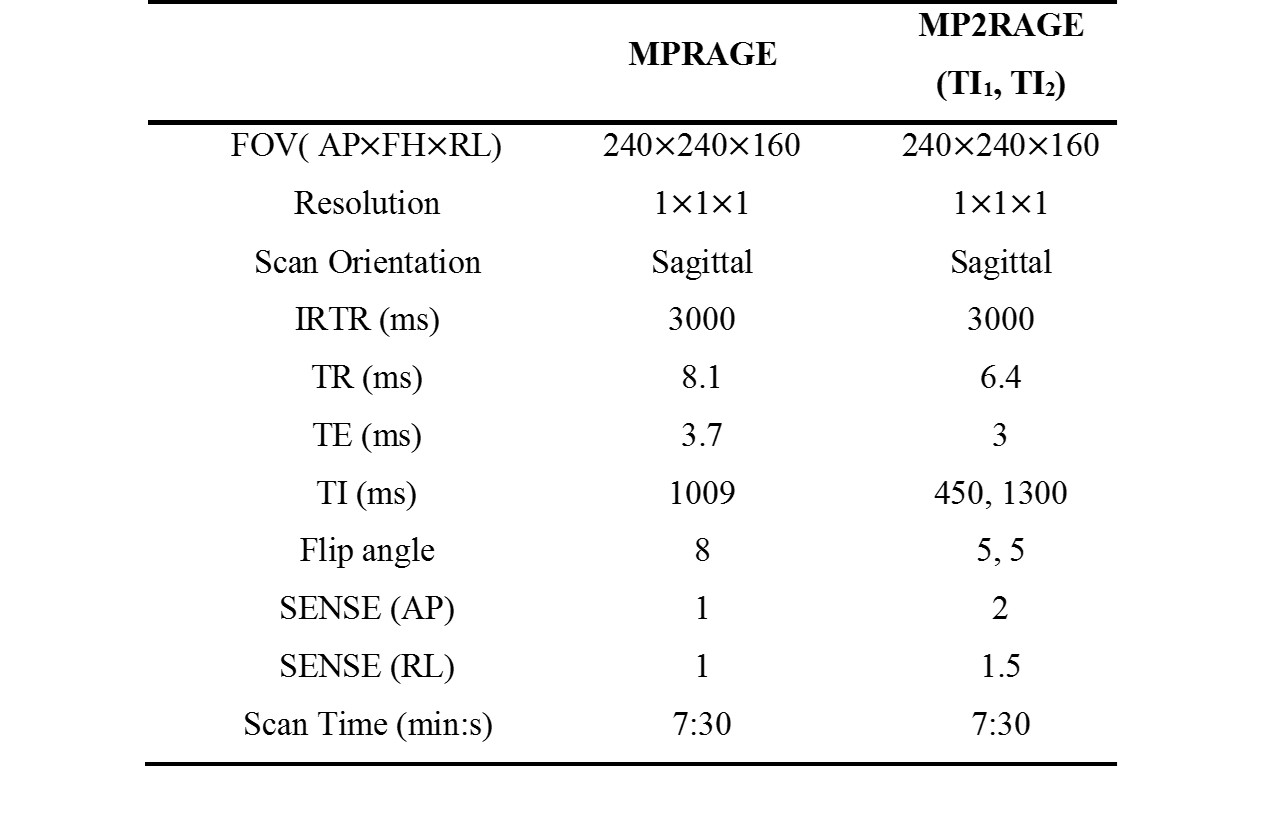
3D T1 MPRAGE and MP2RAGE data were acquired using a 32 channel head coil with radio frequency (RF) parallel transmission5 and RF shimming (See Table 1 for detailed parameters). Twelve volunteers were recruited (9 males and 3 females, age 23-62y, mean 36.9y). This study was IRB approved and written informed consent was obtained from all the participants. For each subject, M1 and M2 were registered to the MPRAGE volume using SPM127, scull stripping was carried out using BET6 for both the MPRAGE and MP2RAGE images. Figure 1 demonstrates the segmentation pipeline.
CSF: Since CSF1 > CSF2, GM1 < GM2, WM1 < WM2, CSF can be extracted by A1 = M1 – M2. From A1, the voxels with positive values are extracted to generate the CSF mask.
GM: A1 is used to exclude CSF which yields B1. A2 = 4.5×M1-M2 is used to exclude WM. Since GM2 / GM1~1.6, we multiply M1 with s > 1.6 so s×GM1 > GM2. Considering the variation of T1, an empirical value s = 4.5 is chosen. In the mean time, 4.5×WM1 < WM2. In A2, the voxels with a negative value are WM and are nulled to yield B2. Then, B1×B2 = C1 and the non-zero voxels in C1 are used to generate the GM mask.
WM: The WM mask is generated by extracting the negative voxels in A2.
For reference, FSL6 and SPM127 were used to segment the MPRAGE images and M2. Note that, scull stripping was not performed before the segmentation using SPM12. The proposed method was implemented using MATLAB. The tissue volumes were calculated and the relative mean difference (RMD) between the proposed and other methods was defined as
$$\frac{V_P-V_R}{V_R}$$
where VP was the volume from the proposed method, VR was that of other methods. The spatial overlap between the segmentation results of the proposed method and those of other methods was determined by the Dice coefficient8.
Results
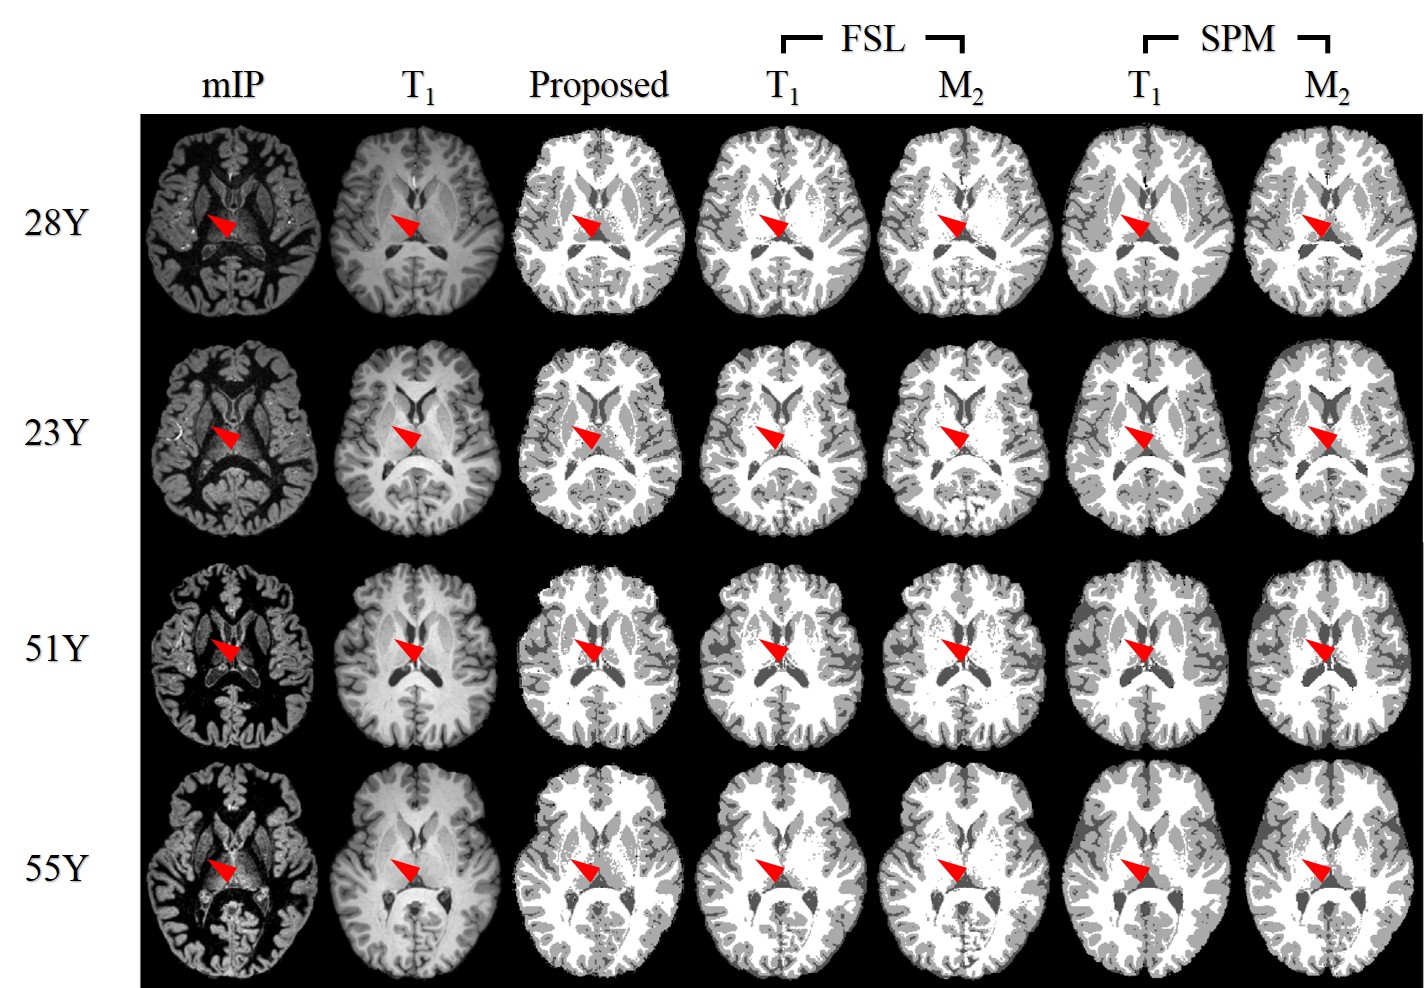
Figure 2 demonstrates the results of four subjects. All the methods were highly consistent for the segmentation in most structures. However, the putamen was correctly segmented as GM by the proposed method while misclassified by FSL and SPM12 to varying degrees. The tissue volume results are summarized in Table 2. The RMD between the proposed method and SPM12 on T1 was the smallest. The RMD between the proposed and FSL was over 14 % for all tissue classes. Figure 3 shows the overlap maps from one subject and the Dice coefficients. For GM and WM, there was good agreement between the proposed method and other softwares except for the subcortical GM and the border of the brain. More non-overlapped regions were observed for the proposed method with FSL than with SPM12. The Dice coefficients between the proposed method and SPM12 were slightly higher than those with FSL. For CSF, the non-overlapped regions were mainly on the border of the brain, the Dice coefficients between the proposed and all other methods were < 80 %. This underestimation of CSF largely lies in the scull stripping, during which part of the brain border may be discarded.Discussion and Conclusion
Parallel transmission and RF shimming can reduce the transmit B1 inhomogeneity. The two image volumes acquired by MP2RAGE are affected identically by the receive B1 field and the proposed segmentation is a voxel-wise operation. This renders the proposed method insensitive to the reception B1 inhomogeneity. The high consistency between the proposed method and two softwares shown by visual inspection and quantitative metrics implies high accuracy of the proposed method. In addition, our method has superior performance for the segmentation of subcortical GM and is applicable for a wide age range.Acknowledgements
This work was supported by the National Natural Science Foundation of China (61271132 and 61571258) and Tsinghua University Initiative Scientific Research Program.References
1. Ivana Despotović, Bart Goossens, and Wilfried Philips. MRI Segmentation of the Human Brain: Challenges, Methods, and Applications. Computational and Mathematical Methods in Medicine 2015;2015:23.
2. Marques JP, Kober T, Krueger G, van der Zwaag W, Van de Moortele P-F, Gruetter R. MP2RAGE, a self bias-field corrected sequence for improved segmentation and T1-mapping at high field. NeuroImage 2010;49(2):1271-1281.
3. Mendrik AM, Vincken KL, Kuijf HJ, Breeuwer M, Bouvy WH, De Bresser J, Alansary A, De Bruijne M, Carass A, El-Baz A, Jog A, Katyal R, Khan AR, Van Der Lijn F, Mahmood Q, Mukherjee R, Van Opbroek A, Paneri S, Pereira Sr, Persson M, Rajchl M, Sarikaya D, Smedby r, Silva CA, Vrooman HA, Vyas S, Wang C, Zhao L, Biessels GJ, Viergever MA. MRBrainS Challenge: Online Evaluation Framework for Brain Image Segmentation in 3T MRI Scans. Computational Intelligence and Neuroscience 2015;2015:1-16.
4. Tanner M, Gambarota G, Kober T, Krueger G, Erritzoe D, Marques JP, Newbould R. Fluid and white matter suppression with the MP2RAGE sequence. Journal of Magnetic Resonance Imaging 2012;35(5):1063-1070.
5. Katscher U, Börnert P. Parallel RF transmission in MRI. NMR in Biomedicine 2006;19(3):393-400.
6. Jenkinson M, Beckmann CF, Behrens TE, Woolrich MW, Smith SM. FSL. NeuroImage 2012;62(2):782-790.
7. Ashburner J, Friston KJ. Unified segmentation. NeuroImage 2005;26(3):839-851.
8. Dice LR. Measures of the Amount of Ecologic Association Between Species. Ecology 1945;26(3):297-302.
Figures