2832
Noise mitigation of high-resolution 7T MRI images1University of Pittsburgh, Pittsburgh, PA, United States, 2University of Sao Paulo, Sao Carlos, Brazil
Synopsis
High-resolution images typically present lower signal-to-noise ratio (SNR) due to the reduced voxel size. In this work, the BM4D filter was applied to high-resolution MPRAGE images acquired at 7T MRI. Original and denoised images were compared using two different acquisition resolutions: 0.7mm isotropic and 0.54mm isotropic. The method shows good results for higher-resolution images, greatly improving the SNR while keeping the useful clinical information and the small details which are not discerned using the lower-resolution acquisitions.
Introduction
Due to its small voxel size, high-resolution MR images suffer with low signal-to-noise ratio (SNR). Conventional noise removal techniques can be applied to improve the SNR of the volume, but effectiveness can only be achieved if the proper noise model is considered while denoising. The proposal of this work is to denoise the MR volume while maintaining the extra details observed in a higher resolution acquisition.Methods
In-vivo human MR images were acquired using the 16-channel transmit RF coil with a 32 channels receive insert 1 using a 7T human scanner (Siemens Magnetom, Erlangen Germany). The sequence used was the MPRAGE, with two variations: 1) resolution 0.7mm isotropic, TE/TR/TI = 2.47/3000/1200ms, acquisition time 10:31min; 2) resolution 0.54mm isotropic, TE/TR/TI = 2.48/3000/1200ms, acquisition time 11:43min.
The MR acquisitions were denoised by the procedure described in 2. The magnitude of MR images can be modeled by the Rice distribution, in which the noise characteristics can be assumed to be signal-dependent. This assumption limits the choice of filters that can effectively be applied to MR images, since the majority of algorithms were designed for Additive White Gaussian Noise (AWGN). Thus, to enable the use of conventional denoising algorithms, a variance stabilizing transformation (VST) must be applied. The forward transformation, also described in 2, converts the Rice distribution into a Gaussian one, with zero mean and unity variance. In this range, denoising can be applied to the signal. For the purpose of the present work, we utilized the BM4D denoising algorithm 3, which is an extension of the BM3D filter to volumetric data. The denoised volume can be recovered by applying the appropriate inverse transformation, which brings the data back to its original range. The previously described steps grants effectiveness of the noise removal algorithm through the entire input signal range.
Results
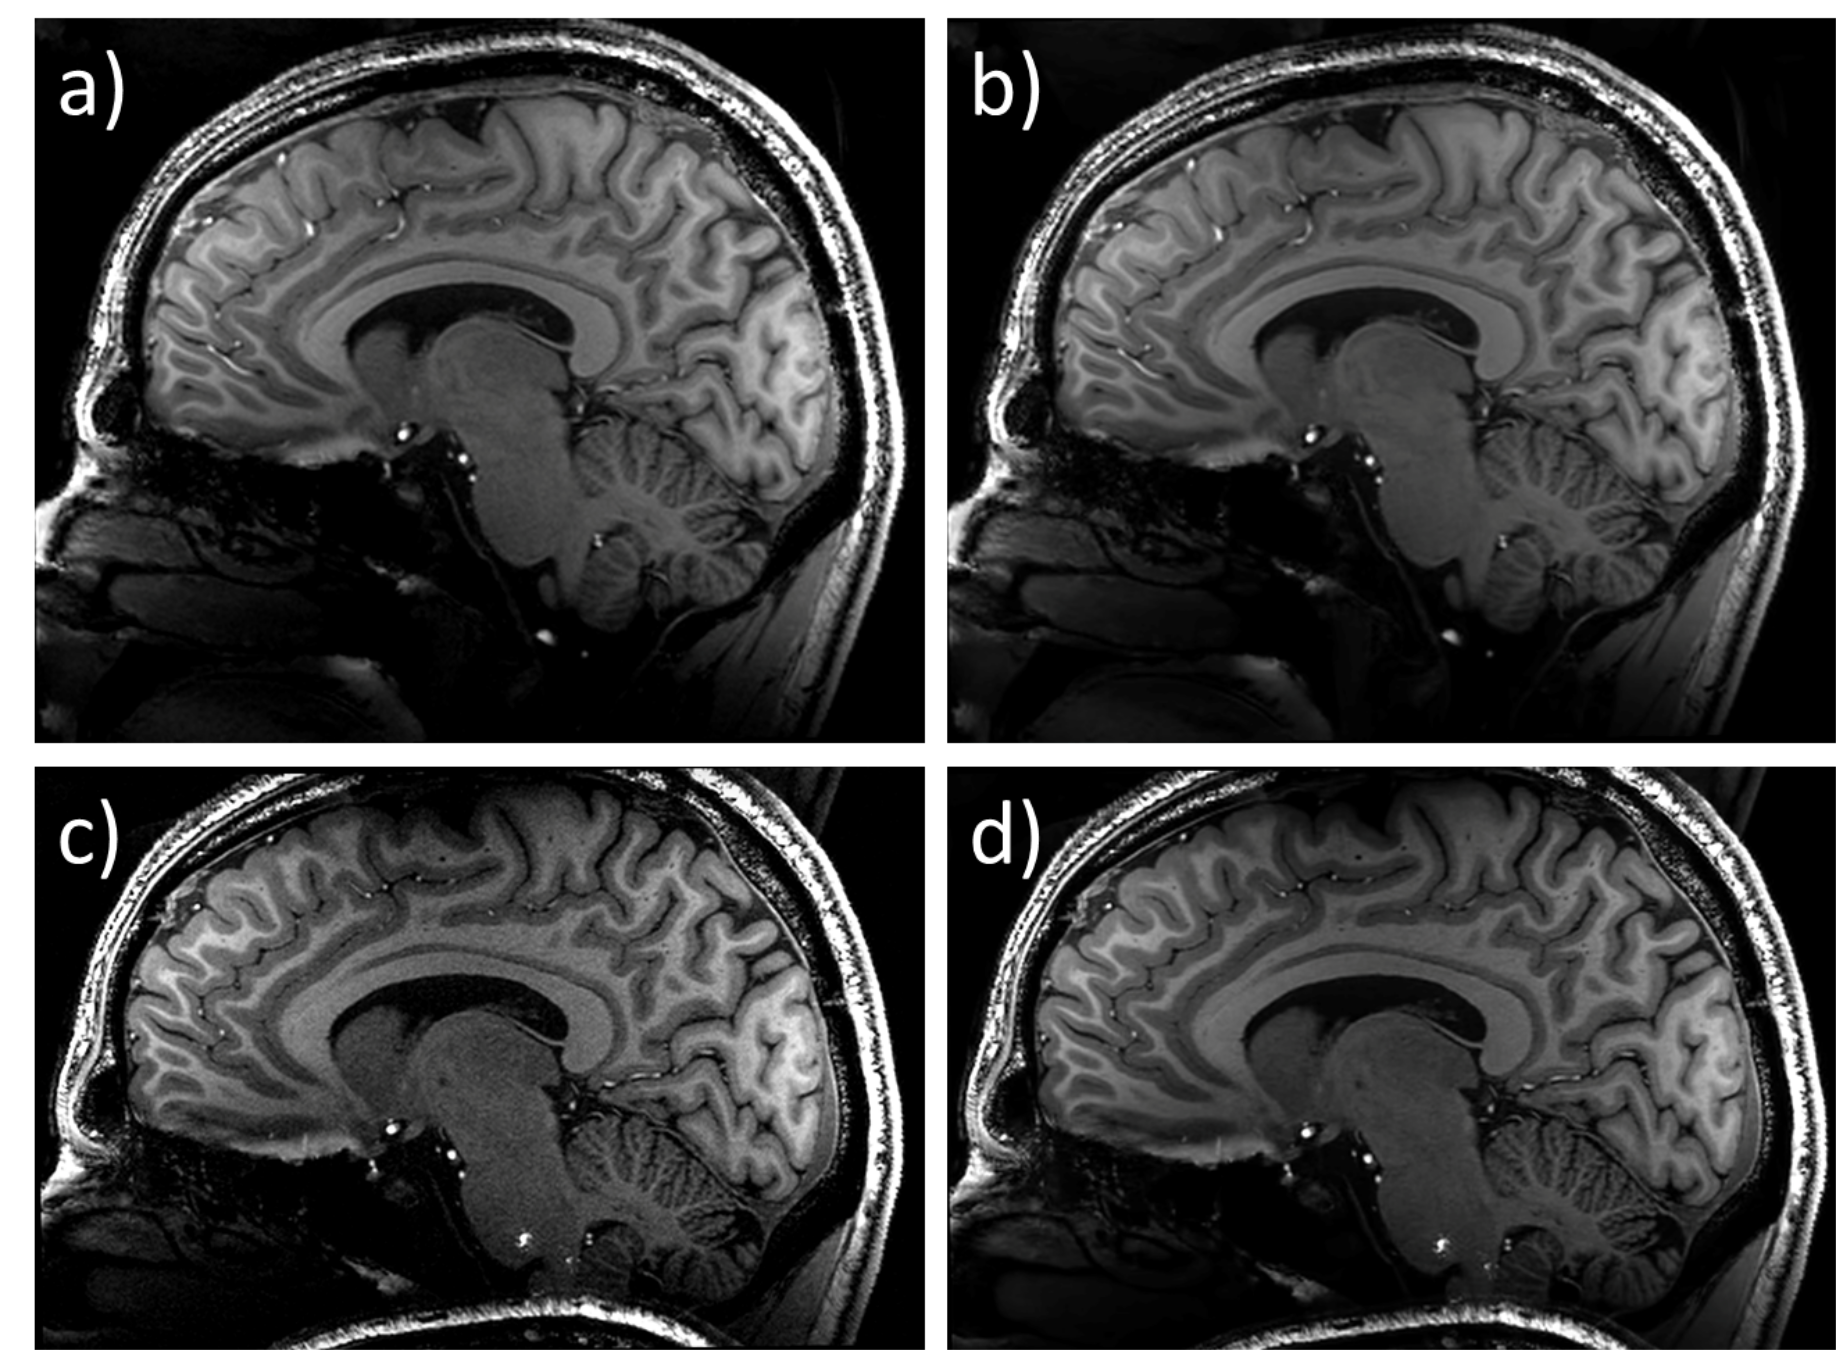
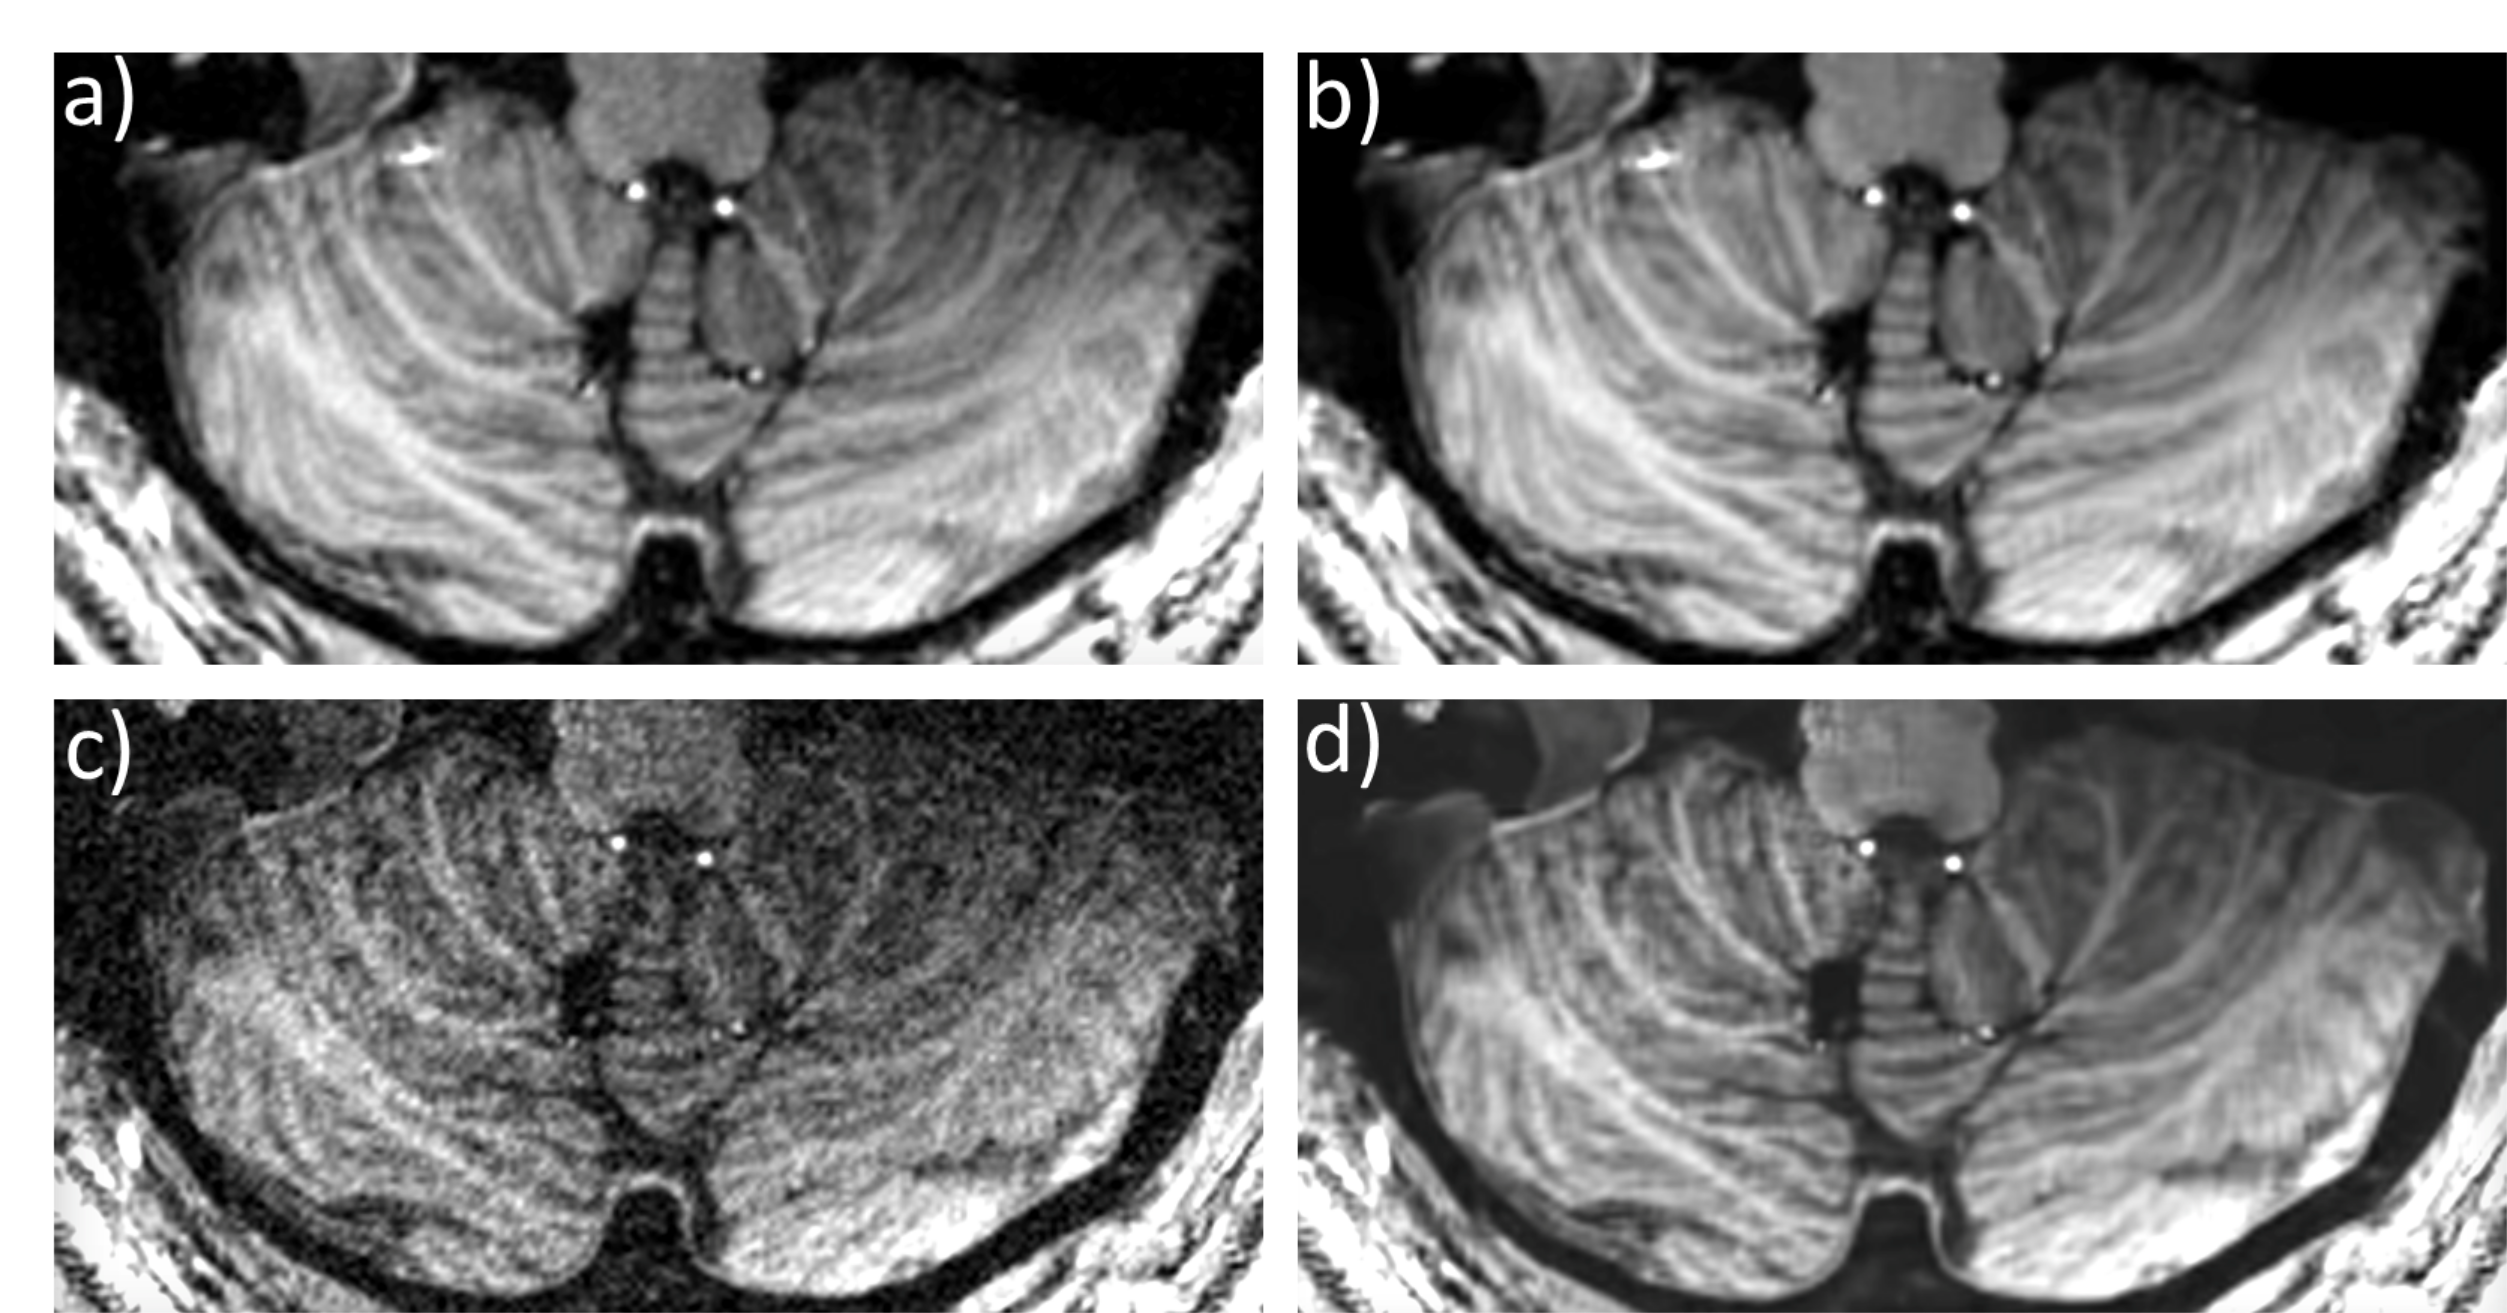
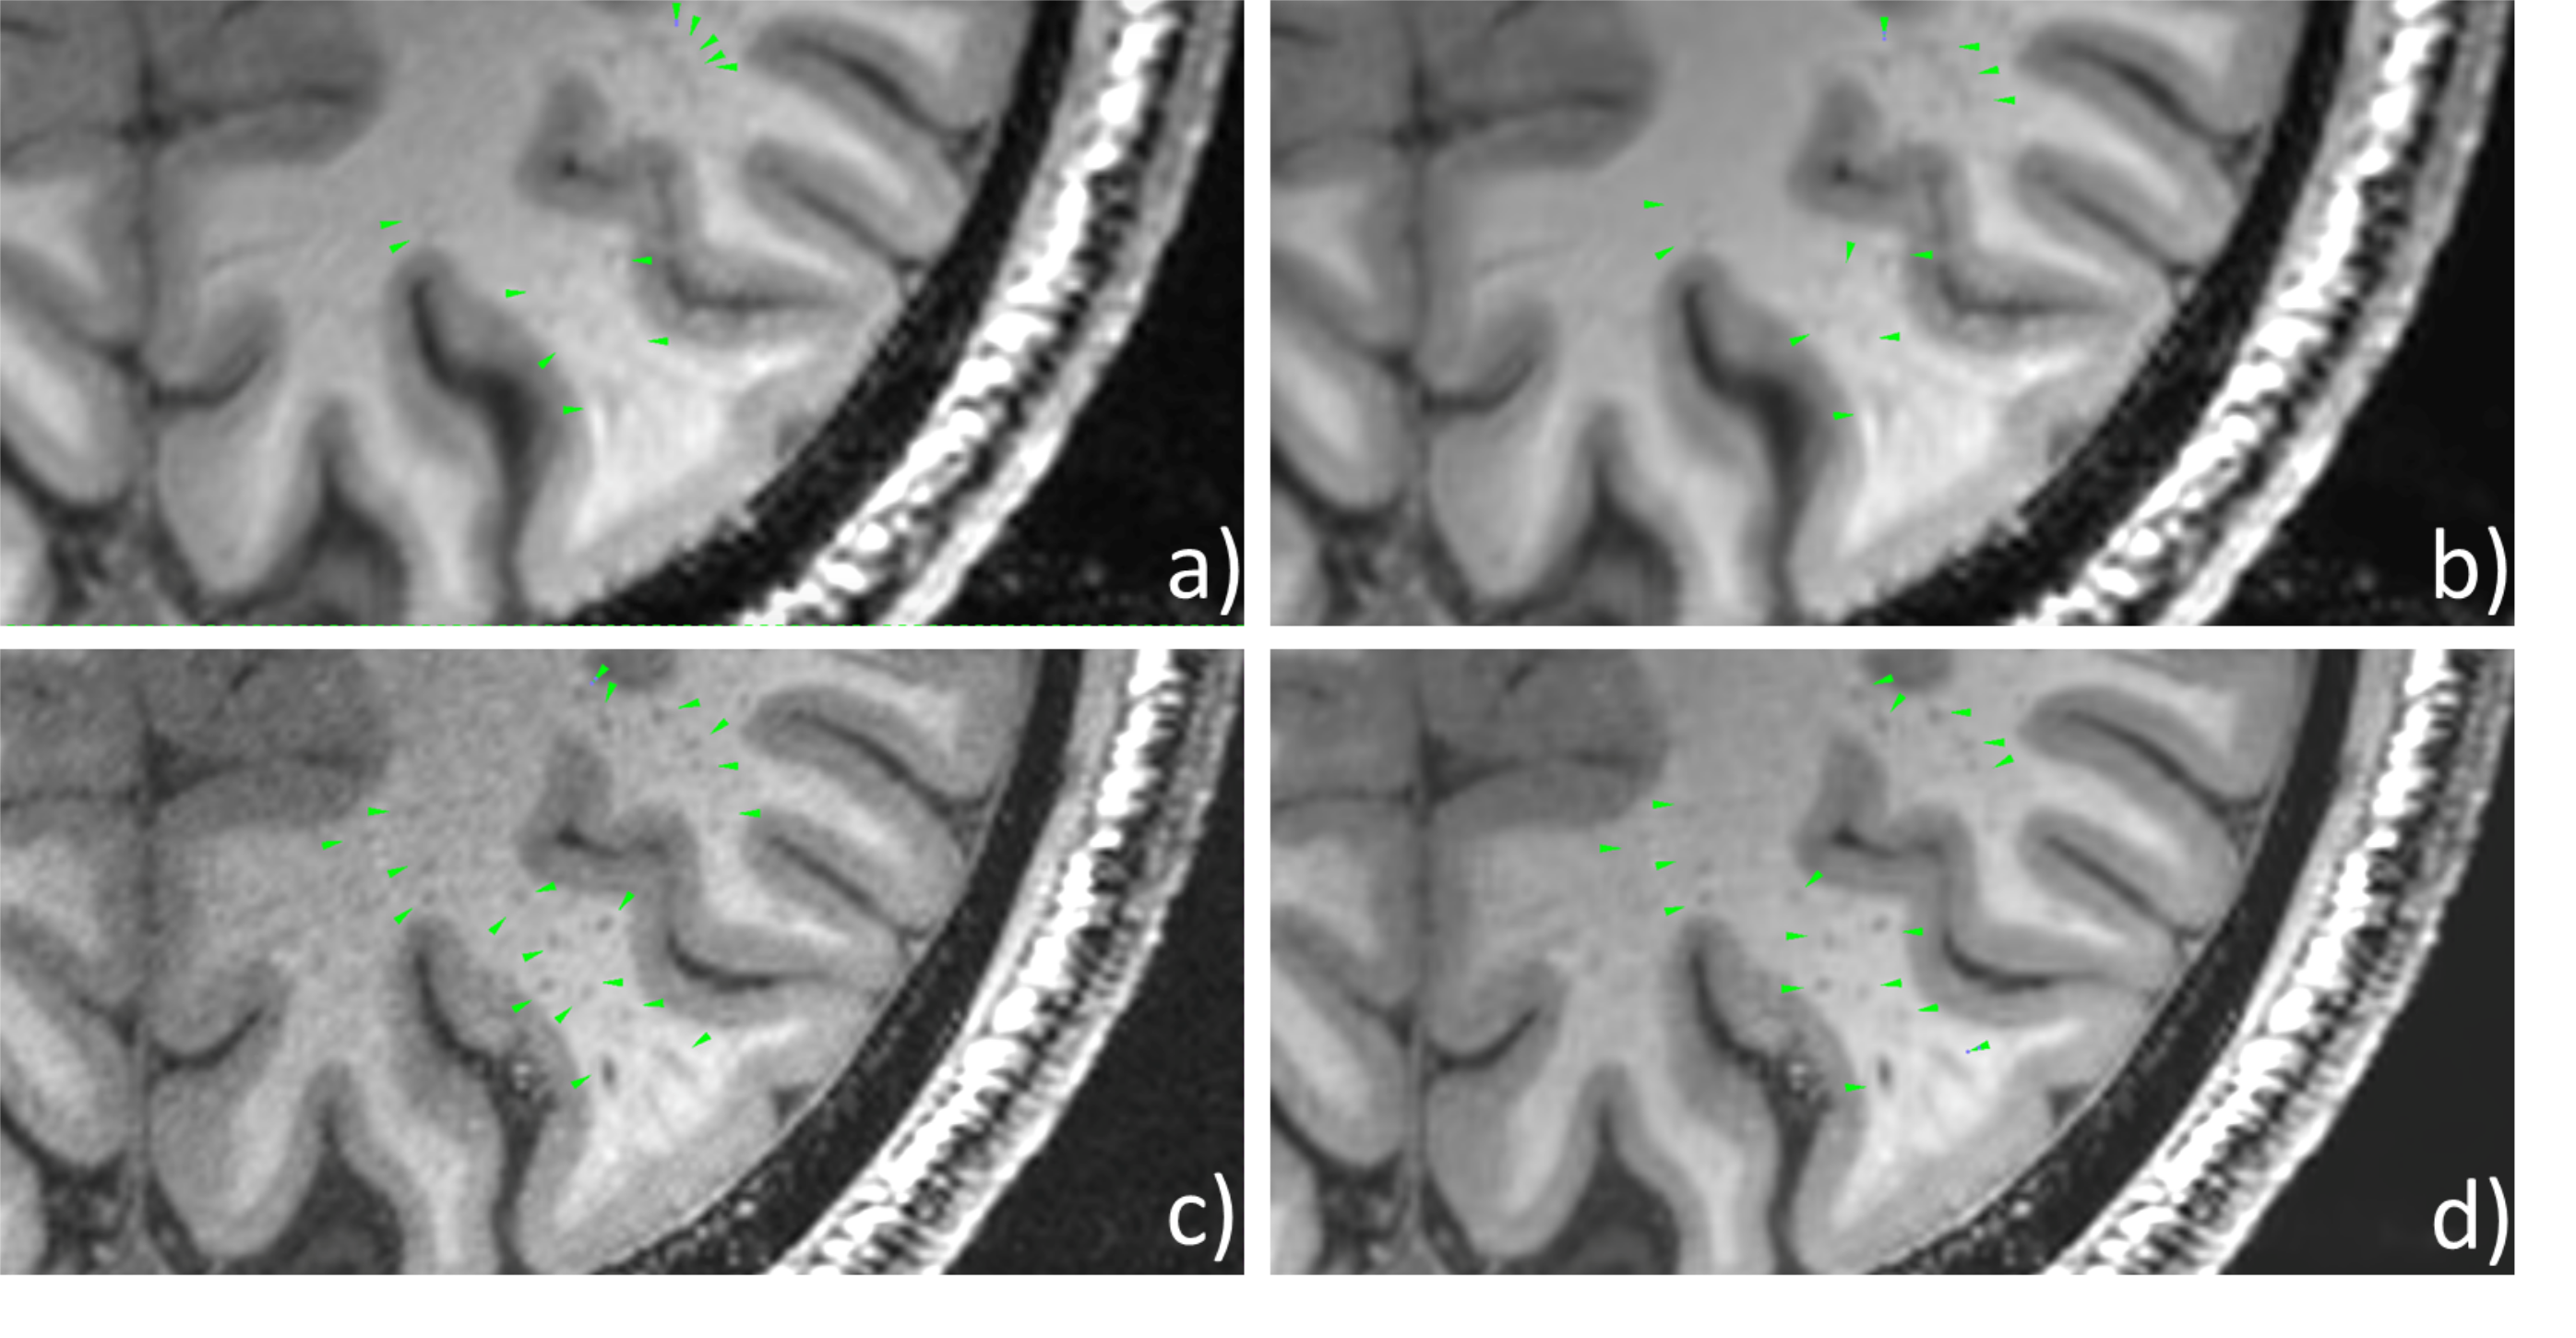
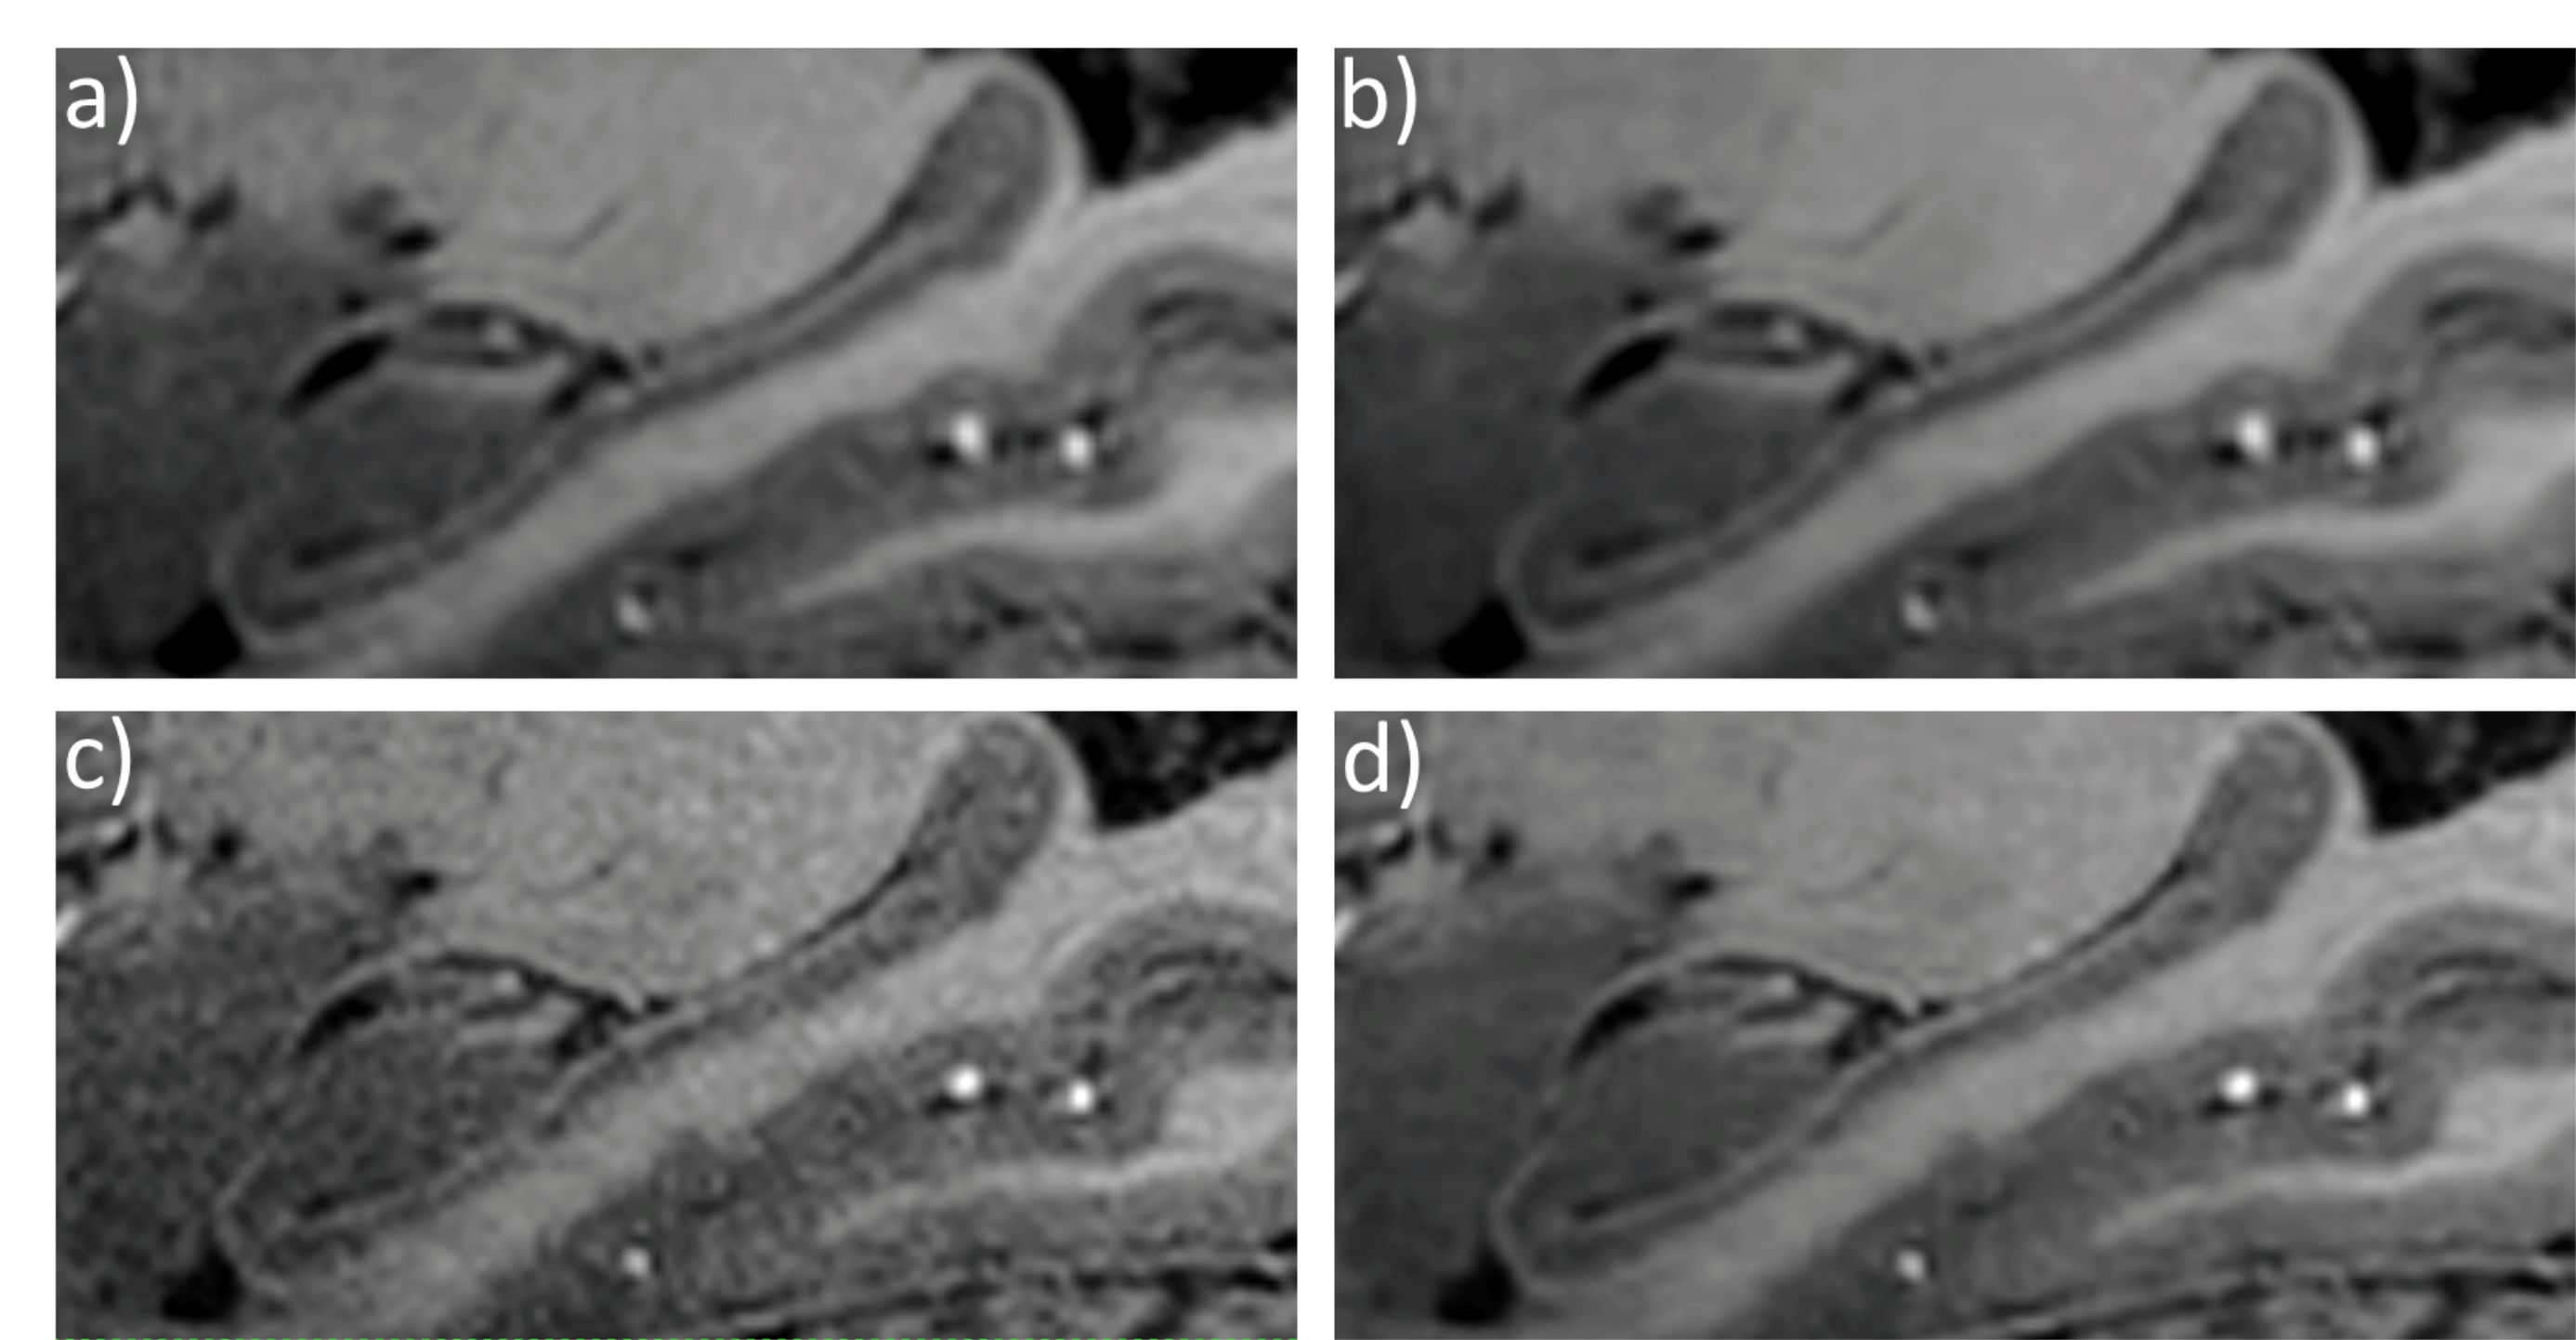
Figure 1 shows the sagittal view of the raw image acquisitions and the denoised images for the two different resolutions. Figure 2 shows an axial slice in the lower cerebellum region. The lower cerebellum is affected by the slab-selective acquisition of the 3D MPRAGE, due to the limited number of slices available in the MPRAGE product sequence. Figure 3 presents an axial slice in the cortical area showing small structures in the white matter, characterized as periventricular spaces. Figure 4 shows a sagittal slice in the hippocampal region.Discussion and Conclusions
While the denoised higher resolution images (0.7 mm isotropic) presents minor improvements in the signal-to-noise ratio (SNR) in relation to the original image, denoising higher resolution images (0.54 mm isotropic) can be very beneficial, potentially recovering the SNR to the levels seen in the lower resolution acquisitions. This situation is evident when qualitatively examining low SNR regions in the lower brain (Figure 2), where the signal is affected by the slab-selective 3D MPRAGE acquisition. Figure 2d presents similar levels of the SNR when compared to the lower resolution acquisitions (Figure 2a and 2b), while the original high-resolution acquisition (Figure 2c) presents low SNR.
While improving the SNR of the images, Figure 3 shows that the denoising technique maintains the extra information gained when acquiring higher resolution images. Figure 1d shows many structural details in the white matter (arrows in the figure) that are difficult or impossible to detect by the lower resolution images (Figures 3a and 3b). Figure 4 shows improvements in the SNR in the hippocampal regions, potentially improving the classification of the hippocampal subfields.
Acknowledgements
This work was partially funded by the National Institutes of Health R01MH111265 and by the CAPES Foundation, Ministry of Education of Brazil, 13385/13-5.References
1. Ibrahim T, Zhao Y, Krishnamurthy N, et al. 20-To-8 Channel Tx Array with 32-Channel Adjustable Receive-Only Insert for 7T Head Imaging. Paper presented at: International Society of Magnetic Resonance in Medicine2013; Salt Lake City, Utah.
2. Foi A. Noise estimation and removal in MR imaging: the variance-stabilization approach. Paper presented at: Biomedical Imaging: From Nano to Macro, 2011 IEEE International Symposium on Biomedical Imaging2011.
3. Maggioni M, Katkovnik V, Egiazarian K, Foi A. Nonlocal transform-domain filter for volumetric data denoising and reconstruction [published online ahead of print 2012/08/08]. IEEE Trans Image Process. 2013;22(1):119-133.
Figures