2831
The fractal dimension of the tendon-microstructure and its relevance for the detection of permanent changes in micromorphology due to strong mechanical load: a T2* MR-microscopy study using very short detection time1Center for Medical Physics and Biomedical Engineering, Medical University of Vienna, Vienna, Austria
Synopsis
The tendon-structure is hierarchically organized: the endotenon soft tissue separates the collagen fibre bundles in sub-segments with decreasing diameter. MR-microscopy at pixel size below 80µm is capable to differentiate microstructure up to the second hierarchical level and demonstrate self-similarity of the sub-segmentations. Can this self-similarity of the tendon be characterized by a fractal dimension? Is the fractal dimension sensitive to microstructural permanent changes as a consequence of strong mechanical load? We present our investigations obtained within a pilot study using short-TE Multislice-T2*-microscopy with a pixel-size of 39x35µm2 indicating the importance of the crimp filament structure.
Purpose/Introduction
The micro-structure of the human tendon cannot be visualized in clinical MRI due to the limited spatial resolution (a=0,3x0,3mm2)1 and the quick T2(*)-relaxation of the rigid collagen-rich tissue. The tendon-substructure is organized in an hierarchical order ranging from collagen-fibres, subfascicle-(primary) structure(15-400µm) up to tertiary bundles(1000-3000µm)2. The soft endotenon filament-structure is visible3,4,5 due to its higher T2*-value (T2*≈5ms)5 in short TE-imaging and separates the different compartments at the various spatial scales corresponding to the hierarchical order5. This contrast might be used for the quantification of the self-similar hierarchical order by the fractal dimension using T2*w MR-microscopy. The fractal dimension represents a well-known structural parameter for describing the complexity in tissue and cell-structure6. Mechanical stress or pathologies might have an impact or even destroy the hierarchical order on different levels. We here present our results of quantitative evaluation of the fractal dimension in tendons using T2*-based contrast with 2D- and 3D-MR-microscopy at very short detection time within a bovine animal-model for mechanical tensile-stress damage. The applicability of this structural description parameter for the differentiation between areas of permanent structural change as a consequence of mechanical load is investigated. To our knowledge the fractal dimension analysis is applied for the first time to tendons in general and in specific on structural variations as a consequence of mechanical load.
Subjects and methods
6 bovine tendons of adult cattle (1,5 years) were harvested and cut into lengthy samples(~4-5cm) of different diameters. In mechanical tensile-tests, some samples are split into two segments one part of which was loaded up to forces F~600N. Force-extension-diagrams were recorded. MR-microscopy was performed on a human 7T-MR-scanner equipped with a prototype strong micro-gradient-insert (Gmax=750mT/m) and sensitive rf-resonators5 using T2*-weighted clinically available gradient-echo (GE) and a vTE-sequence7. MR-protocols were optimized for contrast with optimum TE between 2-4 ms and spatial resolution up to microscopic VS (30x35x360µm3, Mtx: 512x460x111). The evaluation of the fractal dimension for an image structure demands for binary (BW) images. Therefore thresholding was performed for optimum contrast between bright endotenon and dark collagen fibre background in the T2* gray-scale images. The fractal dimension was evaluated in selected regions of interest (ROI) using a box counting algorithm6.The fractal dimension D was calculated as negative slope of the logarithm of the number of pixels (count) covering the bright intensity of the endotenon, versus the logarithm of box size (fig. 3).Results
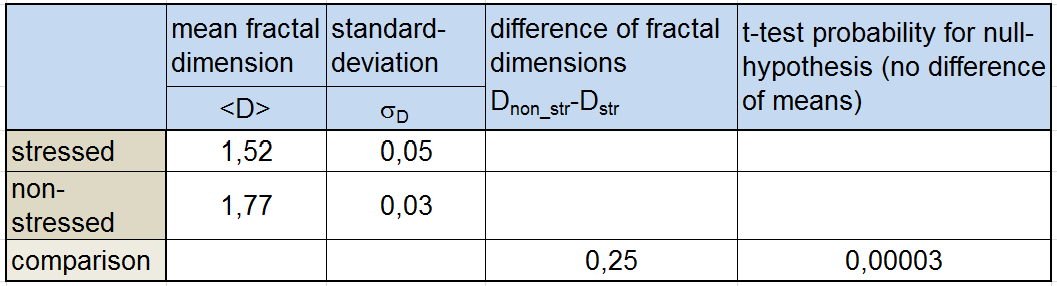
The fractal dimension was evaluated using box sizes of 2,3,4,6,8,12,16,32 and 64 pixels for the area of the whole tendon covering both regions of mechanical load and non-stressed region. The value for the fractal dimension of the endotenon substructure ranges typically between 1.5 and 1.8. For the specific sample shown in fig.1a Doverall=1.73 is obtained. Two different regions (fig.1) recognized as being typical for areas of permanent structural change due to mechanical load (ROIstress) and the split reference sample without stress (ROInon-stress) were selected and comparatively evaluated for their difference in fractal dimension using the same image and threshold. The thresholded binary T2*w axial image including the coverage by the set of two different box sizes is shown in fig.2. The log box-plots for evaluation of fractal dimension in the two different ROIs, typical for the stressed and unstressed region, both indicate a power law for the number of boxes in dependence of the box size (fig.3) with high regression coefficient r2>0.99. The results for the fractal dimensions evaluated for different T2*w images are summarized in table 1 for the region of permanent structural change and non-stressed region separately. The two different regions exhibit a significant difference in the fractal dimension (Dstress≈1.5 +- 0,05 vs. Dnonstr≈1.77). The detection of differences was sensitively dependent on accurate setting of thresholds.Discussion/Conclusion
T2*w MR-microscopy at short detection time allows for the delineation of the hierarchical tendon µ-structure. The contrast is based on the higher T2* for the endotenon filament net. Based on this contrast a fractal dimension could be evaluated for the tendon characterizing the self-similar structure. The fractal dimension differed in regions of permanent structural change due to strong mechanical load but the absolute values are sensitive to thresholding. We hypothesize here, that the change in fractal dimension due to strong mechanical load is mainly related to the change in T2* dispersion and histogram as already demonstrated in high resolution quantitative T2* microscopy in stressed tendons5 and subsequent different appearance in thresholded binary appearance. There are indications, also in the box-sized plots, that the disappearing tiny crimp filament structure under mechanical load plays an important role in the observation of different fractal dimensions.Acknowledgements
We thank the authors of ref. [7] for offering the pulse sequence for very short encoding time (vTE). We used this pulse sequence for comparative quantitative T2*-maps for T2*<2ms. The data is not used for evaluation but supports interpretation. Financial support was offered by HSJ Vienna (H247/2001).References
[1] V. Juras, W. Goetz, P. Baer, C. Kronnerwetter, H. Fujita, S.Trattnig; Comparison of 3 T and 7 T MRI clinical sequences for ankle imaging; European Journal of Radiology 81, 1846–1850 (2012).
[2] P.Kannus; Structure of the tendon connective tissue; Scand J Med Sci Sports 10, 312–320 (2000).
[3] K. Montain, T. Bjarnason, J. Dunn, and J. Matyas; The Functional Microstructure of Tendon Collagen Revealed by High-Field MRI, Magnetic Resonance in Medicine 66: 520-527 (2011).
[4] N. Wang, and Yang Xia; Anisotropic Analysis of Multi-component T2 and T1r Relaxations in Achilles Tendon by NMR Spectroscopy and Microscopic MRI; J. of Magnetic Resonance Imaging 38:625–633 (2013).
[5] A. Berg, M. Stoiber, X. Deligianni, O. Bieri; T2*-mapping of tendon µ-structure changes after mechanical load in an adult bovine animal model using vTE pulse sequences: the role of resolution up to microscopic scale in quantification ESMRMB 2017; Magnetic Resonance Materials in Physics, Biology and Medicine 30 (1) S106 (2017).
[6] T. G. Smith, Jr., G. D. Lange and W. B. Marks, Fractal Methods and Results in Cellular Morphology, J Neurosci Methods, 69:1 123--126 (1996).
[7] X. Deligianni, P. Baer, K. Scheffler, S. Trattnig, and O. Bieri; High-Resolution Fourier-Encoded Sub-Millisecond Echo-Time Musculoskeletal Imaging at 3 Tesla and 7 Tesla; Magnetic Resonance in Medicine 70,1434–1439 (2013).
Figures
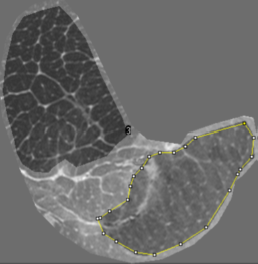
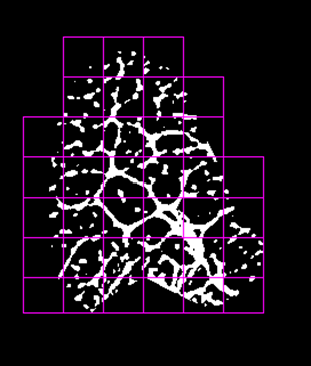
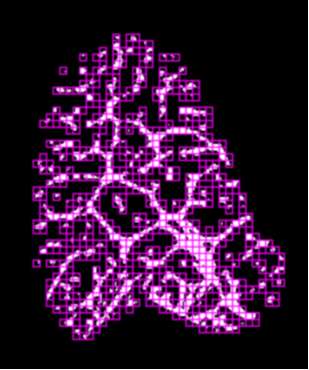
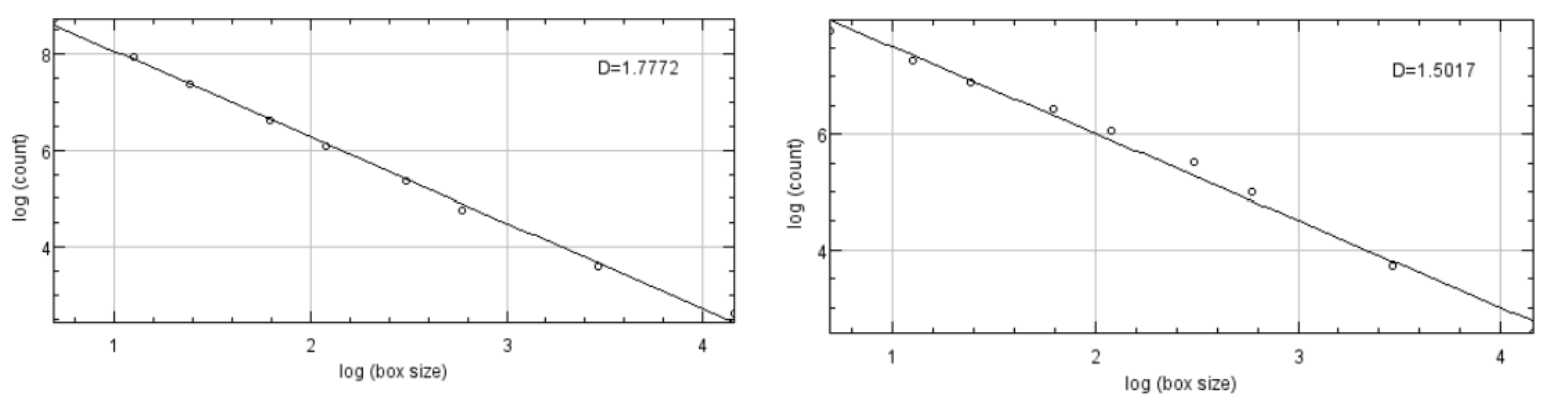
Fig. 3a (left) Box-size plot for evaluation of the fractal dimension D in ROInonstress (fig.1right) of the tendon. The logarithm of the number of pixels (count) covering the bright intensity of the endotenon is plotted versus the natural logarithm of box-size. The fractal dimension for the underlying power law is evaluated as slope (D=1.77).
Fig. 3b (right) Box-size plot in the stressed region of the tendon. The fractal dimension is reduced to D=1.51 compared to the non-stressed region (fig.3a). Note the slightly reduced slope for the smaller boxes indicating a slightly reduced dimension for finer details in the tendon sub-structure.