2828
Quantification of liver function by linearization of a 2-compartment model of gadoxetic-acid uptake using dynamic contrast enhanced magnetic resonance imaging1Biomedical Engineering, University of Michigan, Ann Arbor, MI, United States, 2Radiation Oncology, University of Michigan, Ann Arbor, MI, United States, 3Radiation Oncology, University of California San Francisco, San Francisco, CA, United States, 4Radiology, University of Michigan, Ann Arbor, MI, United States
Synopsis
This study used the uptake of gadoxetic acid contrast into the hepatocytes as a means of quantifying liver function. A linearized form of the dual-input two-compartment model was developed to estimate the uptake robustly and efficiently. Validation was obtained relative to the predictions of the accepted dual-input two-compartment model, and independent measurements of whole liver function. The linearized approach allows the creation of a spatially resolved quantitative image of liver function, using standard clinical acquisitions, and removes the requirement for impractical, high temporal resolution scans.
Introduction
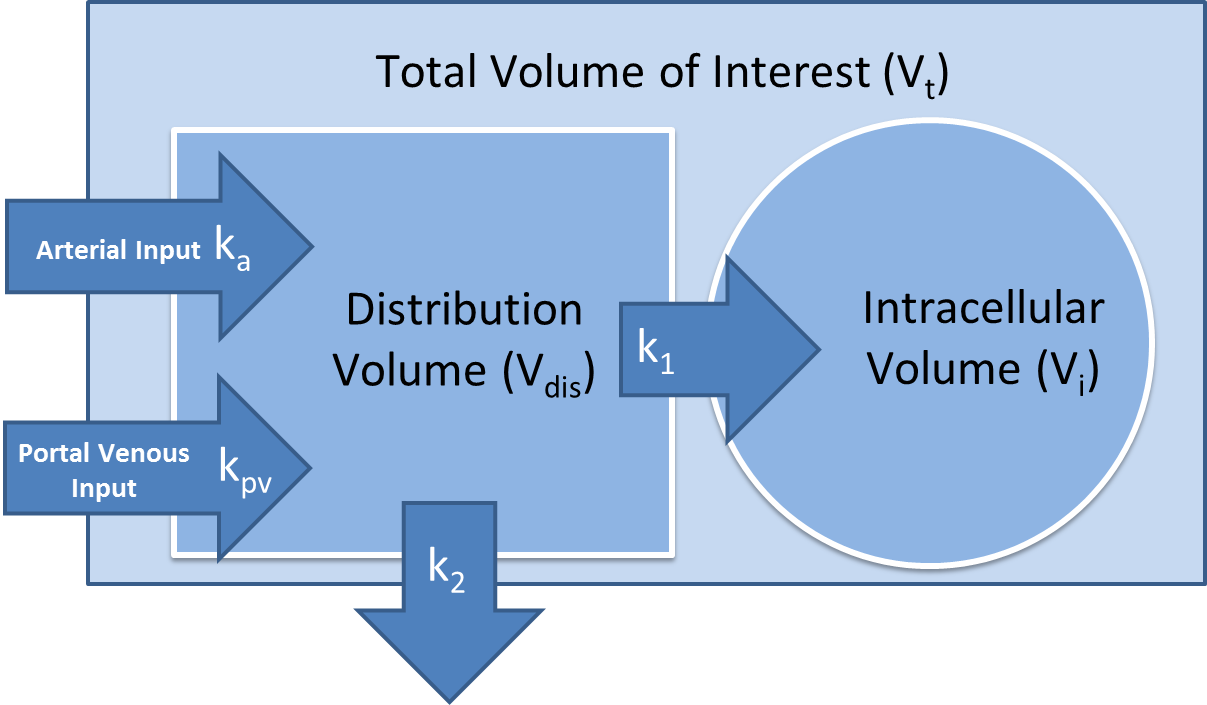
Regional and global liver function measures are critical for guiding treatments of intrahepatic cancers so as to protect liver function and prevent organ failure1. Clinical multi-phase liver MRI with gadoxetic acid has been routinely acquired to qualitatively assess liver function2. Semi-quantitative measures, e.g., relative liver enhancement to spleen in the hepatobiliary phase, ill-differentiate contrast uptake from blood flow3. It is a challenge to directly apply the dual-input two-compartment model (DITC)4 to the clinical low temporal resolution (LTR) multi-phase MRI to quantify the contrast uptake rate. This study developed a linearization of the DITC model (figure 1) and applied it to both high temporal resolution (HTR) and clinical LTR multi-phase liver MRI with gadoxetic acid. The proposed model was evaluated by: (1) comparing the uptake rate (k1) estimated by the proposed model to the full DITC model; (2) assessing errors in k1 in the clinical LTR MRI using simulated data; and (3) correlating the estimated total liver function by the model to an independent and reliable measure of whole liver function.Methods
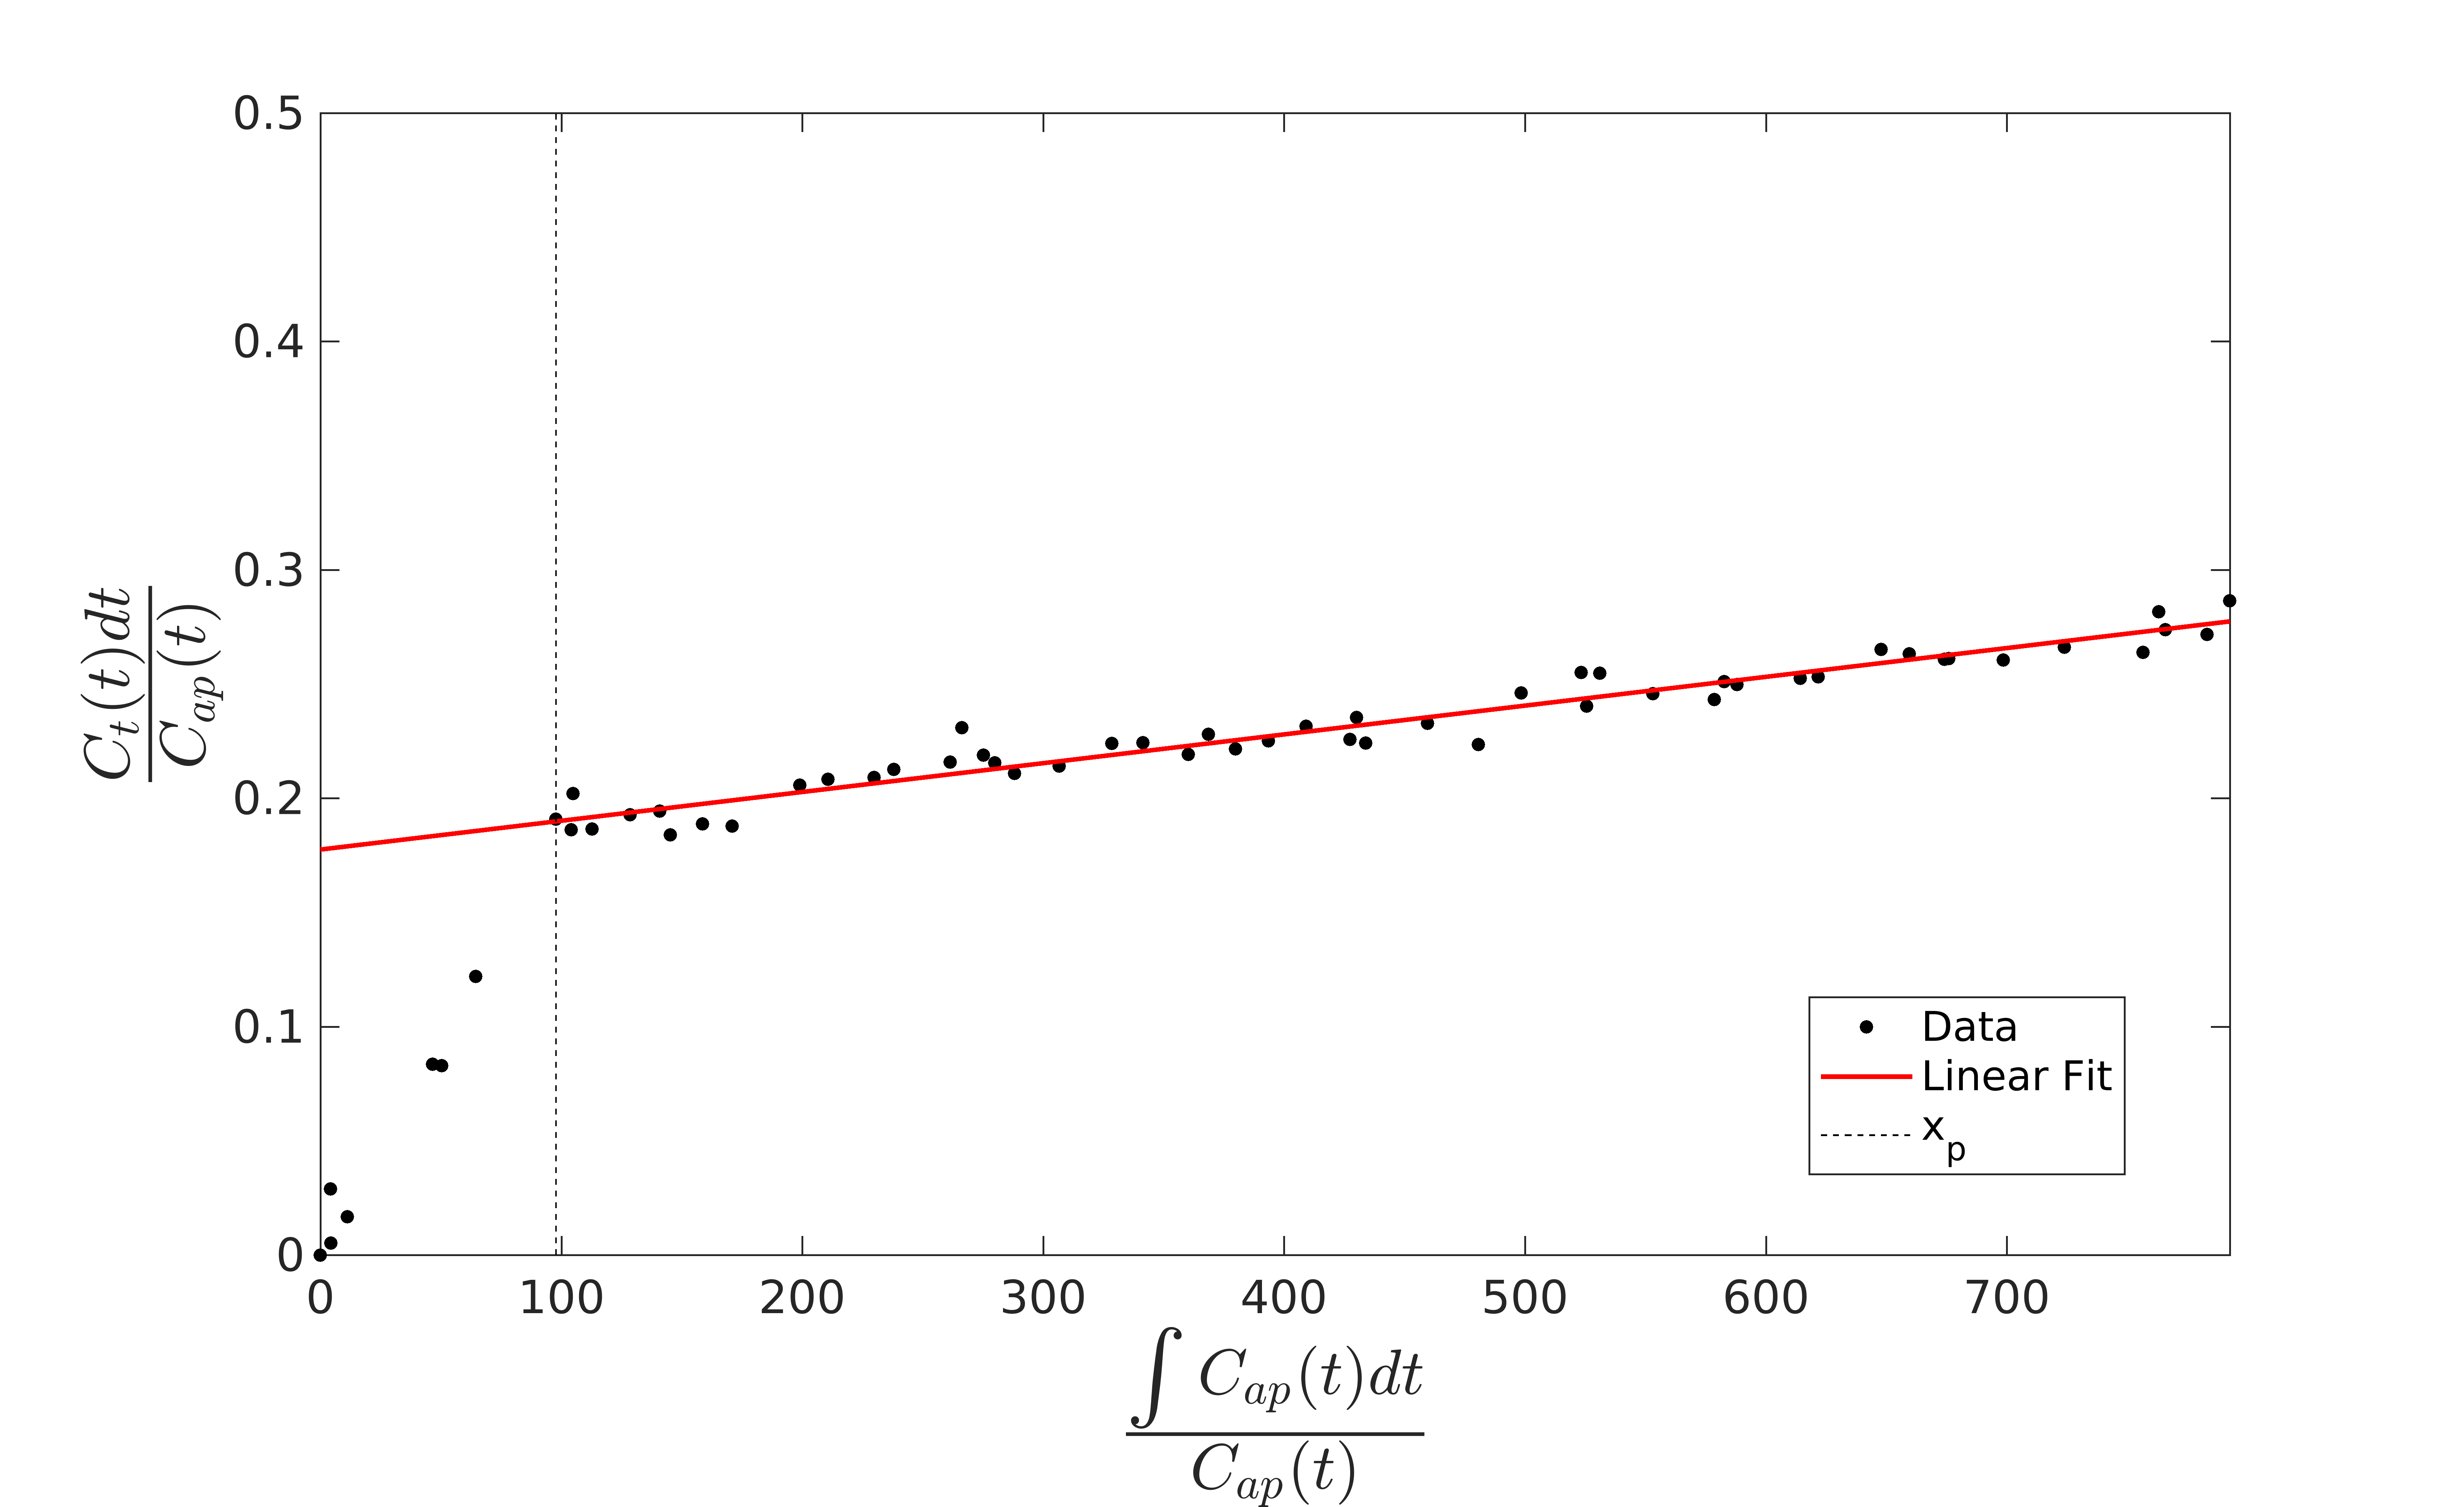
The full DITC model can be reduced to a linear model if we assume that after some time xp the arterial and portal venous contrast concentrations (Ca and Cpv) are equivalent and the subsequent rate of change in Ca is negligible. Since the hemodynamic changes after the initial transient time following the contrast bolus injection become slow, this is a reasonable approximation. The model then reduces to a linearized single input two-compartment (LSITC) model:
$$ \overbrace{\frac{(1-Hct)C_{t}(t)}{C_{a}(t)}}^{\textrm{y}} = \overbrace{v_{dis} k_1 \frac{k_2}{k_1+k_2}}^{\textrm{slope}} \overbrace{\frac{\int_0^t C_{a}(\tau) d\tau }{C_{a}(t)}}^{\textrm{x}} + \overbrace{v_{dis} \frac{k_2}{k_1+k_2}}^{\textrm{intercept}} $$
Here Ct is the contrast concentration in the region of interest, Hct is the hematocrit, vdis is the normalized distribution volume, and k2 is the volume normalized total plasma flow. The estimate for k1 is then slope/intercept (figure 2). Slope multiplied by voxel volume is an estimate of total uptake (K1) if k1<<k2.
To assess the LSITC model, uptake maps were created using both the DITC and LSITC models from 8 HTR scans (with IRB approval), and compared using linear regression. For the 20 of 28 LTR scans for which ICG data were available, K1 values derived from the LSITC were summed over the liver volume (as total liver function) and correlated to indocyanine green (ICG) retention scores (an independent measure5) to validate the LSITC derived measure of liver function. Simulated data were created to assess the error in estimated k1 if the arterial peak was missed in a clinical LTR acquisition. Both the HTR and LTR scans were 3D volumetric MRI acquired during injection of a single standard dose of gadoxetic acid. HTR scans were acquired using a Golden-Angle Radial sampling VIBE sequence on a 3T scanner (Skyra, Siemens Healthineer). LTR scans were acquired using 1.5 T GE or Philips scanners.
Results and Discussion
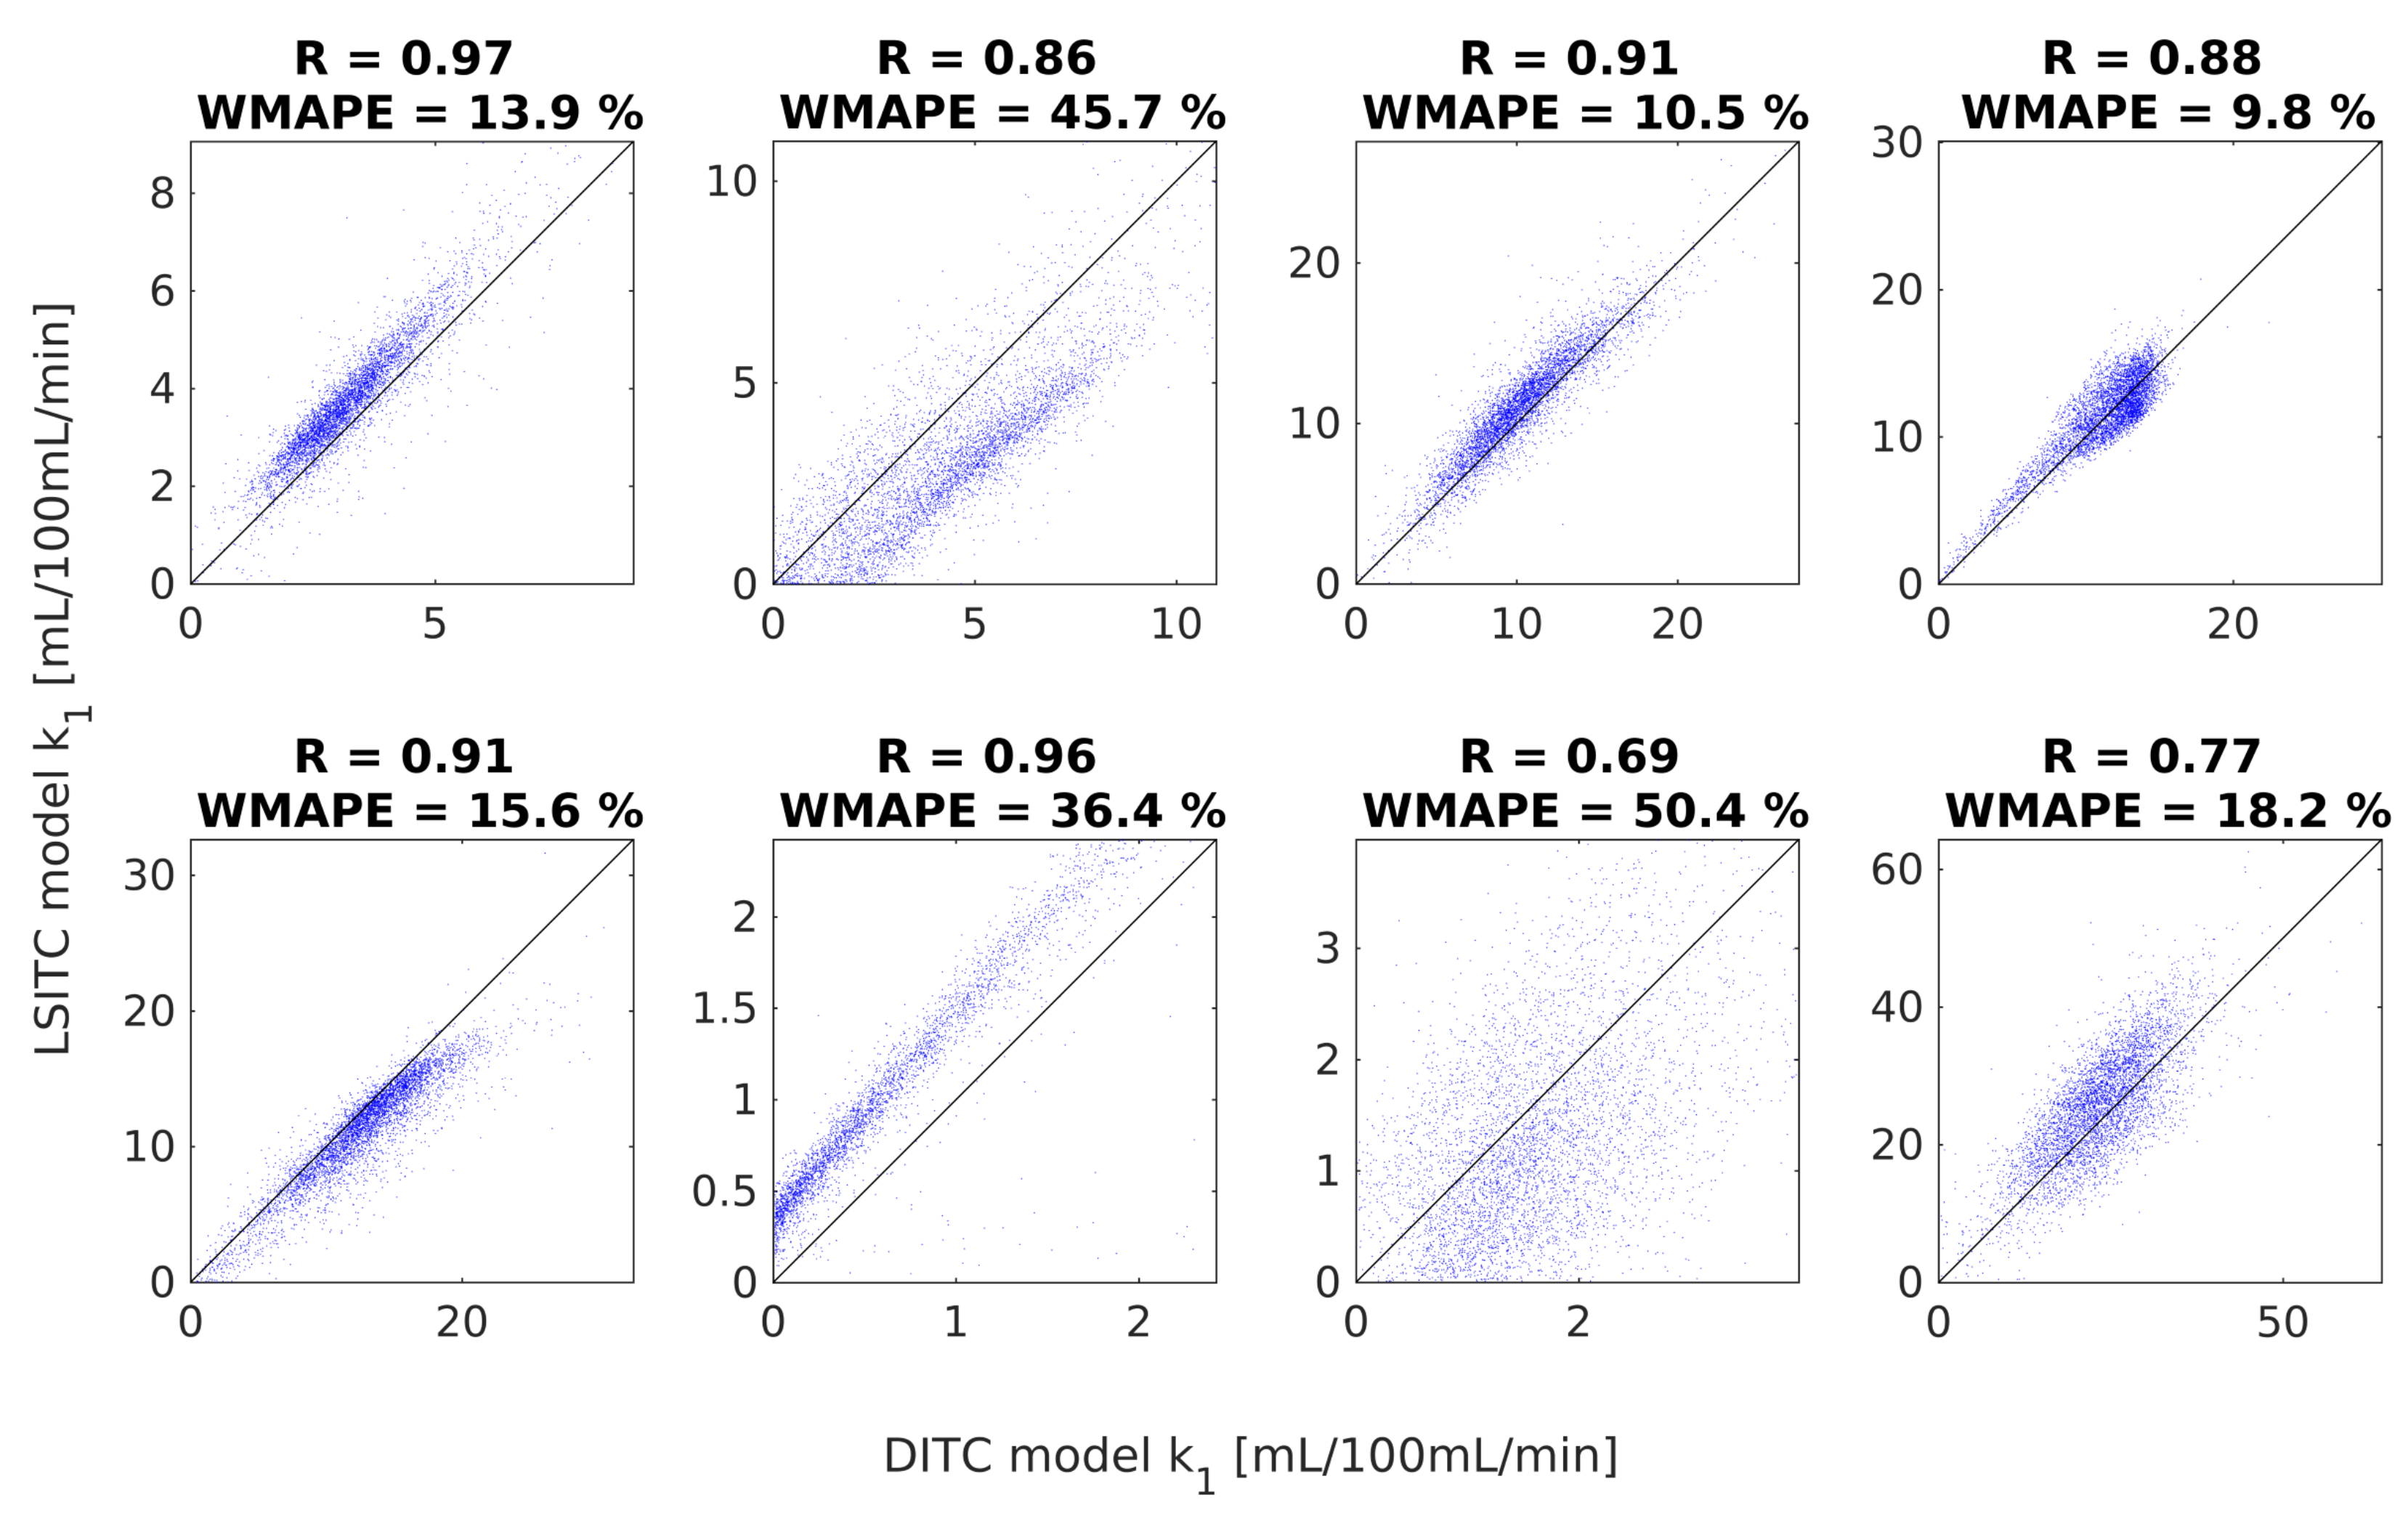
For the 8 HTR scans, the median correlation coefficient between the DITC and LSITC derived k1 values was R=0.87 (figure 3). The weighted mean absolute percent error (WMAPE) had a median of 18.2% across the 8 livers. DITC model fitting was much slower than the LSITC method, taking a few hours rather than seconds per liver.
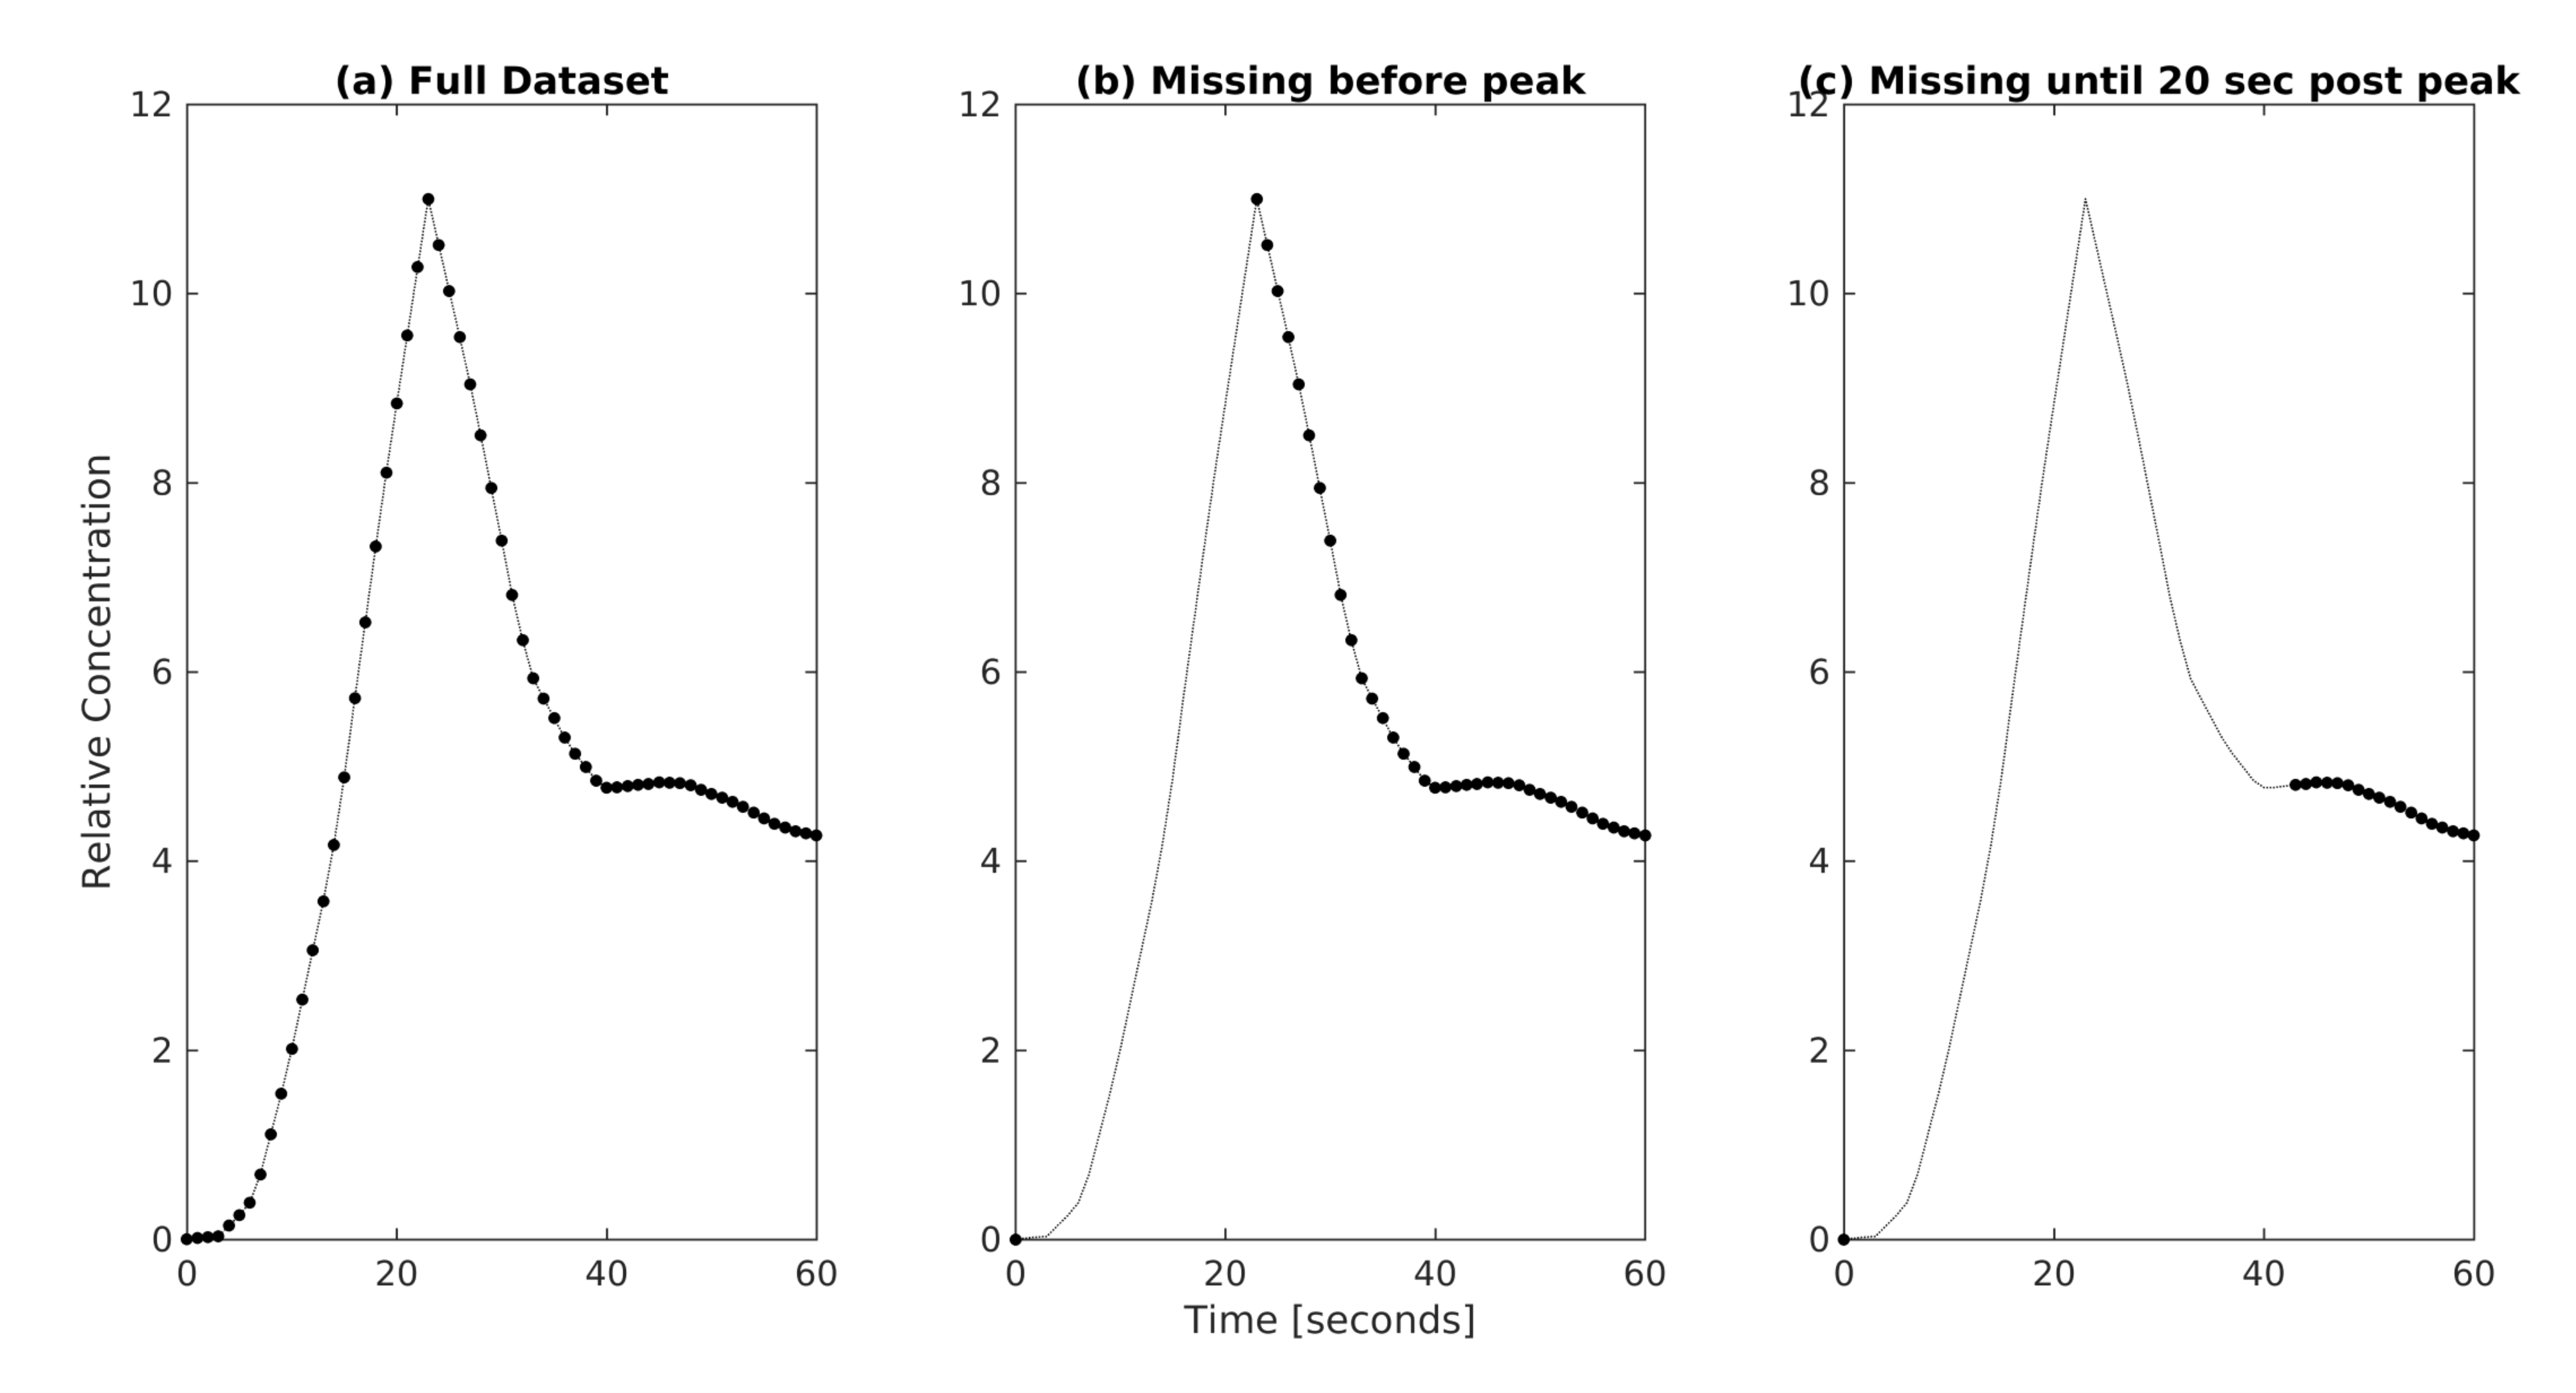
The clinical LTR scans usually acquire one pre-contrast phase, three-phases approximately 0 to 60 seconds after contrast injection, and two late phases at 10 and 20 minutes. Simulated data sets were created using the DITC model to assess the impact of an under-sampled or un-sampled arterial peak. For a worst-case scenario where all time data until 20 seconds after the arterial peak were missed (figure 4), the WMAPE of k1 by the LSITC model changed by 2.0%. This validates the tolerance of the LSITC model to the under-sampling of the arterial peak in the clinical LTR scans compared to the HTR scans.
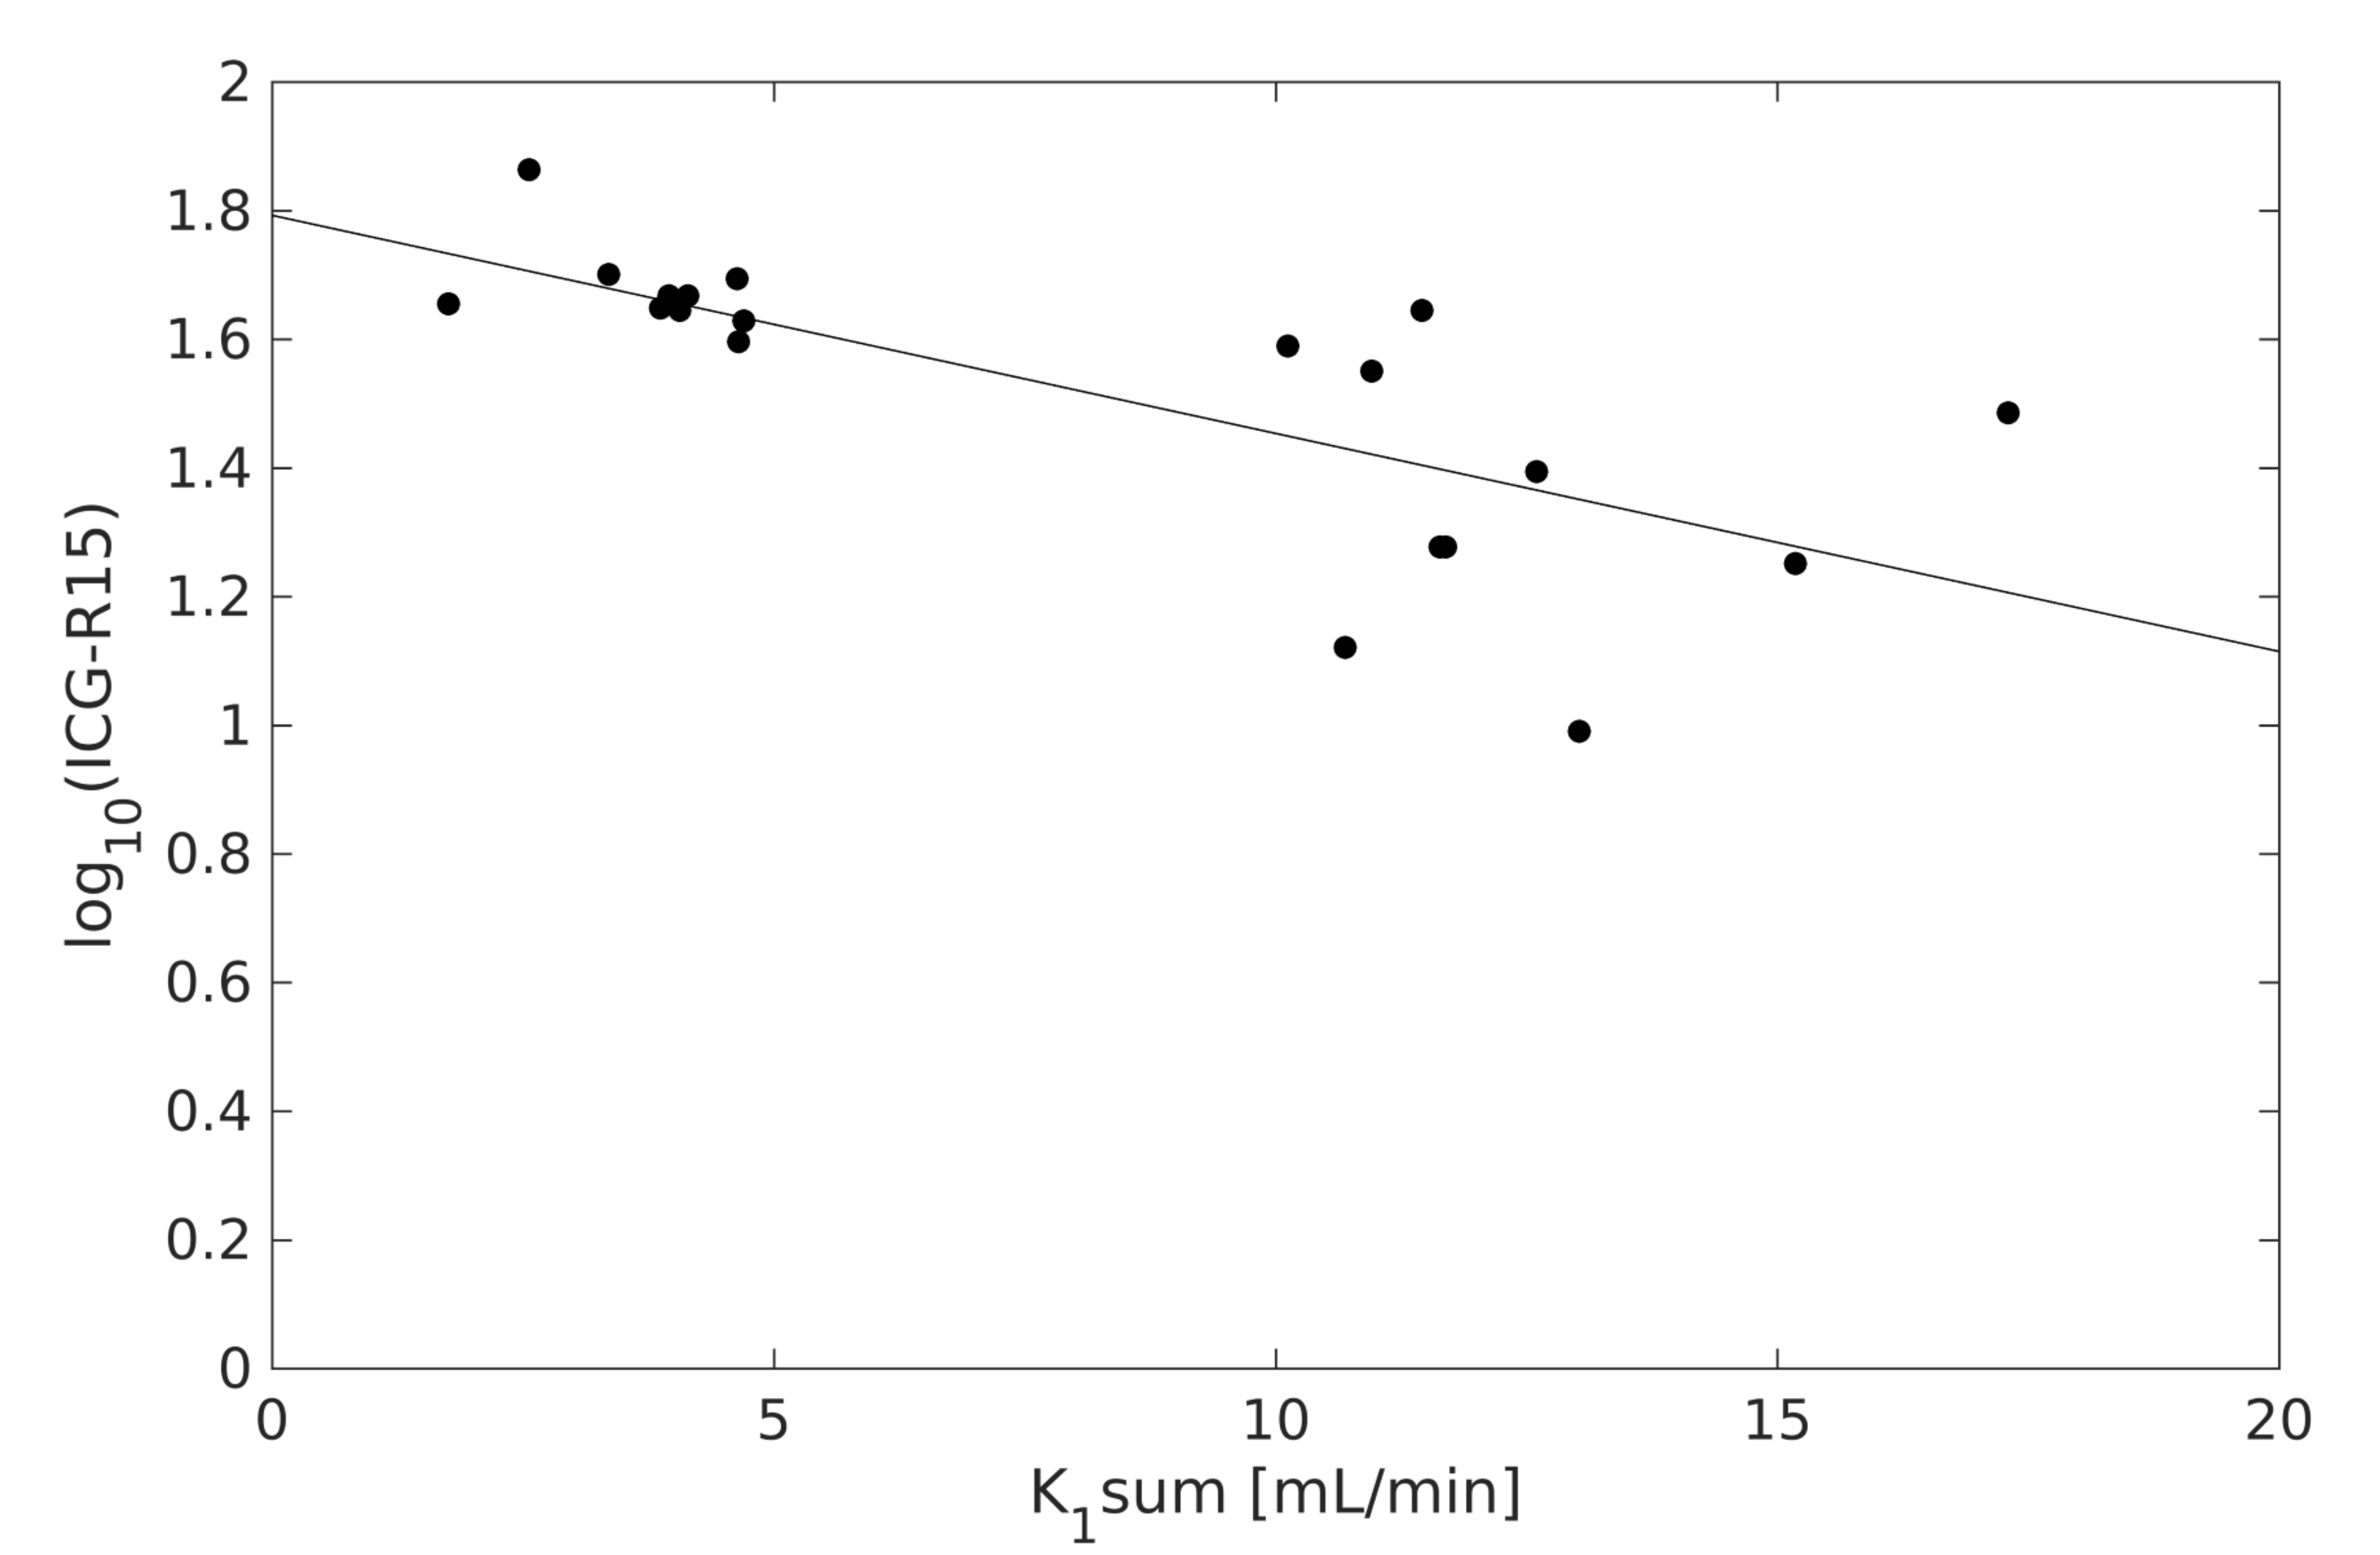
The LSITC derived whole liver function for the clinical LTR scans and the log of ICG scores had a correlation coefficient of R=-0.72 (figure 5). The negative correlation is expected since the ICG scores are based on the fraction of agent remaining in the blood after 15 minutes. The mean k1 value across all 28 LTR scans was 3.66±1.61 mL/100mL/min, consistent with prior studies.
Conclusion
This work proposes and validates the LSITC model for assessing liver function based on the uptake rate of gadoxetic acid. Validation was obtained relative to the predictions of the accepted DITC model, and independent measurements of whole liver function. The LSITC approach allows the creation of a spatially resolved quantitative image of liver function, using standard clinical acquisitions, and removes the requirement for impractical, high temporal resolution scans.Acknowledgements
This work is supported in part by NIH grants of R01 CA132834 and P01 CA059827. The authors thank Siemens Healthineer for providing the Radial VIBE pulse sequence, and Charles Mayo, Ph.D. for automated Epic data searches.References
1. Johnson PJ, Berhane S, Kagebayashi C, et al. Assessment of liver function in patients with hepatocellular carcinoma: a new evidence-based approach-the ALBI grade. J Clin Oncol. 2015;33(6):550-558. doi:10.1200/JCO.2014.57.9151.
2. Bormann RL, da Rocha EL, Kierzenbaum ML, Pedrassa BC, Torres LR, D’Ippolito G. The role of gadoxetic acid as a paramagnetic contrast medium in the characterization and detection of focal liver lesions: a review. Radiol Bras. 2015;48(1):43-51. doi:10.1590/0100-3984.2013.1794.
3. Yamada A. Quantitative Evaluation of Liver Function Within MR Imaging. In: El-Baz AS, Saba L, Suri J, eds. Abdomen and Thoracic Imaging. Springer US; 2014:233-251. doi:10.1007/978-1-4614-8498-1_9.
4. Sourbron S, Sommer WH, Reiser MF, Zech CJ. Combined quantification of liver perfusion and function with dynamic gadoxetic acid-enhanced MR imaging. Radiology. 2012;263(3):874-883. doi:10.1148/radiol.12110337.
5. Stenmark MH, Cao Y, Wang H, et al. Indocyanine Green for Individualized Assessment of Functional Liver Reserve in Patients Undergoing Liver Radiation Therapy. International Journal of Radiation Oncology • Biology • Physics. 2013;87(2):S26-S27. doi:10.1016/j.ijrobp.2013.06.073.
Figures