2825
Enhanced ADMM-Net for Compressed Sensing MRIGuanyu Li1, Jiaojiao Xiong1, and Qiegen Liu1
1Department of Electronic Information Engineering, Nanchang University, Nanchang, China
Synopsis
Compressed sensing is an effective approach for fast magnetic resonance imaging (CSMRI) that employs sparsity to reconstruct MR images from undersampled k-space data. Synthesis and analysis sparse models are two representative directions. This work aims to develop an enhanced ADMM-Net on the basis of SADN model, which unifies synthesis and analysis prior by means of the convolutional operator. The present SADN-Net not only promotes the generative sparse feature maps to be sparse, but also enforces the convolution between the filter and trained images to be sparse. Besides, it uses optimized parameters learned from the training data. Experiments show that the proposed algorithm achieves higher reconstruction accuracies.
Introduction:
Compressed sensing is an effective approach for fast magnetic resonance imaging (CSMRI) that employs sparsity to reconstruct MR images from incoherently undersampled k-space data [1, 2]. Synthesis and analysis sparse models are two representative directions for CSMRI. To bridge the synthesis and analysis sparse models, Liu et al. [3] proposed a unified synthesis and analysis deconvolutional network (SADN) for CSMRI by means of the convolutional operator. The results demonstrated that the SADN could accurately reconstruct MR images. The well-studied optimization algorithms augmented Lagrangian (AL) and the subsequently Alternating Direction Method of Multipliers (ADMM) method are used for tackling SADN model. On the other hand, deep learning has attracted a lot of attentions recently [4, 5]. Yang et al. proposed a novel deep architecture, dubbed ADMM-Net, inspired by the ADMM iterative procedures for optimizing a general CS-MRI model [6]. ADMM-Net uses optimized parameters learned from the training data for reconstruction, thus achieving high accuracy and fast computational speed. Motivated by the above observations, we try to develop an enhanced ADMM-Net based on our previous SADN model for CSMRI reconstruction. The main contribution of our approach include: 1) SADN-Net not only promotes the generative sparse feature maps to be sparse but also enforces the convolution between the filter and trained images to be sparse. 2) It uses optimized parameters learned from the training data for reconstruction task.Theory: SADN-Net:
The proposed SADN-Net is defined over data flow graphs, which works for optimizing a general CS-based MRI model. Assume$$$x$$$is an MRI image to be reconstructed and$$$y$$$is the under-sampled k-space data, then according to the CS theory and SADN model, the reconstructed image can be estimated by solving the following optimization problem in Eq.1 (see Fig.1) . In Eq.1, A=PF is a measurement matrix, P is a under-sampling matrix, and F is a Fourier transform. The first and the second terms represent the reconstruction error and the$$${\ell _1}$$$norm penalty respectively. The last term is an analysis term.$$${\lambda _k}$$$is a penalty parameter to balance the weights of sparsity prior in the synthesis and analysis terms respectively.$$$D = \left\{ {{d_k}} \right\}_{k = 1}^K$$$are the convolutional filter bank having$$$K$$$filters. $$${z_k}$$$stands for the sparse feature maps. By introducing auxiliary variables$$${w_k} = d_k^T*x$$$, Lagrangian multipliers$$$\alpha = \left\{ {{\alpha _k}} \right\}$$$and penalty parameters$$$\rho = \left\{ {{\rho _k}} \right\}$$$, the augmented Lagrangian function Eq. 2 is derived (see Fig.1). Finally, by employing ADMM, it equals to solve the following six sub-problems in Fig.1. Similar to ADMM-Net, we map the above iterative procedures to a data flow graph. In summary, a flowchart of the proposed SADN-Net is shown in Fig.2.Network Training:
In the network training procedure, the under-sampled data $$$y$$$is set as the input. Meanwhile, the output estimate tends to approach the ground-truth image$$${x^{gt}}$$$reconstructed under fully sampled data. Hence the training set is$$$\psi = \{ y,{x^{gt}}\}$$$. Given pairs of training data and the network parameterΘ, the NMSE value is chosen as the loss function in network. L-BFGS is utilized to optimize these parameters. We compute the gradients of the loss function$$$E(\theta )$$$. In the backward pass, the gradients are computed in an inverse order, where the gradient can be computed backwardly from the layers with circled number$$${N_s} + 1$$$to 1 successively. Fig.3 briefly illustrates the training procedure. As can be seen, each stage consists of six types of nodes (i.e., network layers) and the data flow over them. Each node has multiple inputs and (or) outputs. Note that the outputs of stage n are the inputs of stage n-1.Materials and Methods:
The brain and chest MR images datasets were chosen as our training set and testing set. We set$$$\rho = 0.05,\lambda = 0.05,\eta = 1.1$$$respectively and employed peak signal-to-noise ratio (PSNR) for quantitative comparisons. We have verified that the PSNR will get larger with the increasing of the stage number. In order to balance the calculation time and PSNR, the stage number was set to be 10.Results:
We compared the proposed method with ADMM-Net to reconstruct T1-weighted brain image under pseudo radial sampled K-space data with the acceleration factor R=5. Fig.4 displays the ground truth image and the reconstructed images. We also presented an enlargement area to reveal the fine details and structures preserving. The proposed method has produced an image closer to the original image, the reconstructed image with less blurry artifacts and was superior to the ADMM-Net method. The PSNR value of SADN-Net outperforms ADMM-Net with gains over 0.6dB.Acknowledgements
the National Natural Science Foundation of China under 61661031, 61362001, 61365013.References
[1] M. Lustig. et al MRM, 2007; 58(6); 1182–1195. [2] E. J. Candès. et al IEEE TIT, 2006; 52(2); 489–509. [3] Q. Liu. et al ICIP, 2017. [4] S. Nah. et al 2016. [5] Y. Zhao. et al, 2017. [6] Y. Yang. et al NIPS, 2016; 10-18.Figures
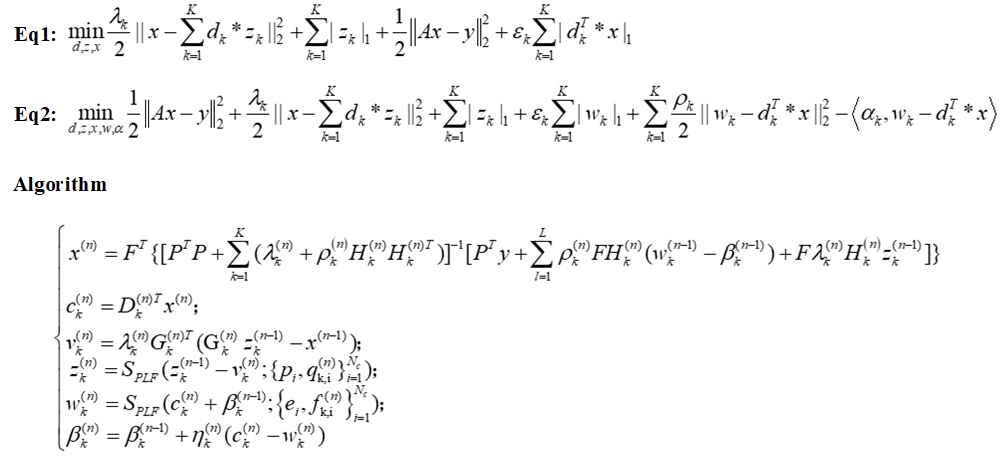
Fig. 1. Some equation derivations and the overall procedure of algorithm.
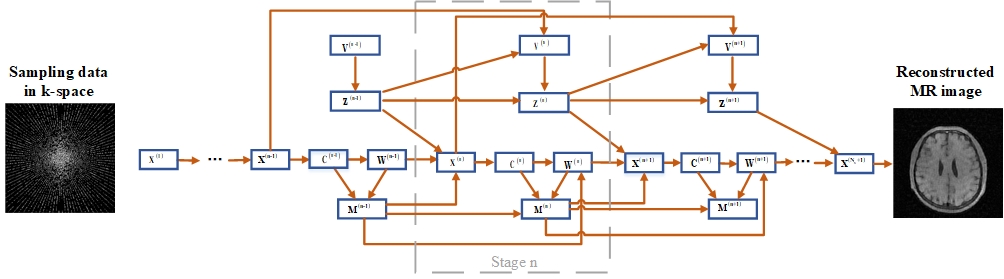
Fig. 2. Schematic flowchart of the proposed method SADN-Net.
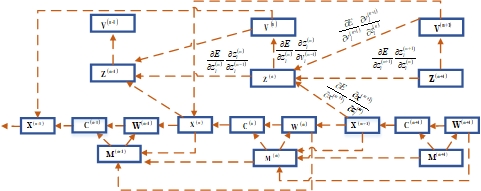
Fig.3. The architecture of network training. The arrow indicates the backward pass when computing gradients in backpropagation.
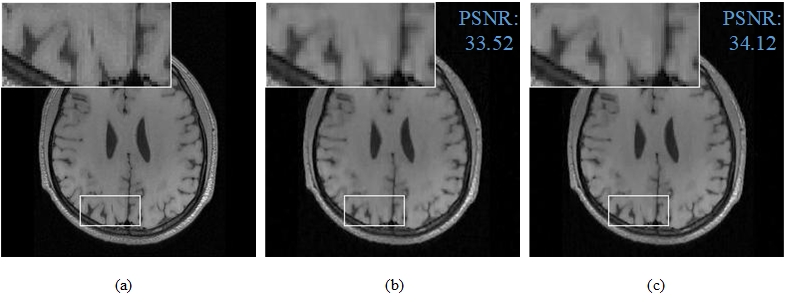
Fig.4. Reconstruction comparison at
20% sampling ratio. (a) Reference image; Reconstruction results by ADMM-Net (b)
and SADN-Net (c).