2822
A Fourier Spectrum Features Based Patch Clustering Method for Inverse Problems In MRI Processing1Department of Electronic Science, Xiamen University, Xiamen, China
Synopsis
Patch clustering is involved into a number of inverse problems in MRI processing, such as image denoising, cross modality synthesis, parallel imaging reconstruction, super-resolution, under-sampled reconstruction, image registration and even segmentation. Considering that the MR signals are acquired in the k-space and then are Fourier transformed into the spatial domain, in this work we propose a new clustering method based on the features extracted from the frequency spectrum, which can be either applied alone for patch or image clustering, or combined with feature descriptors in the spatial domain to facilitate inverse problems processing in MRI.
Purpose
Patch clustering is involved into a number of inverse problems in MRI processing, such as image denoising, cross modality synthesis, parallel imaging reconstruction, under-sampled reconstruction, image registration. At present, there are multiple clustering methods proposed in the computer science researches1,2, categorized into the feature descriptors3,4 and the clustering algorithm5. Despite the success of various feature descriptors, most of these methods cannot be employed to the MRI processing directly with good performance. Considering that the MR signals are acquired in the k-space and then are Fourier transformed into the spatial domain, we propose a new Fourier spectrum features based patch clustering method, which could facilitate the inverse problems processing in MRI.Method and Result
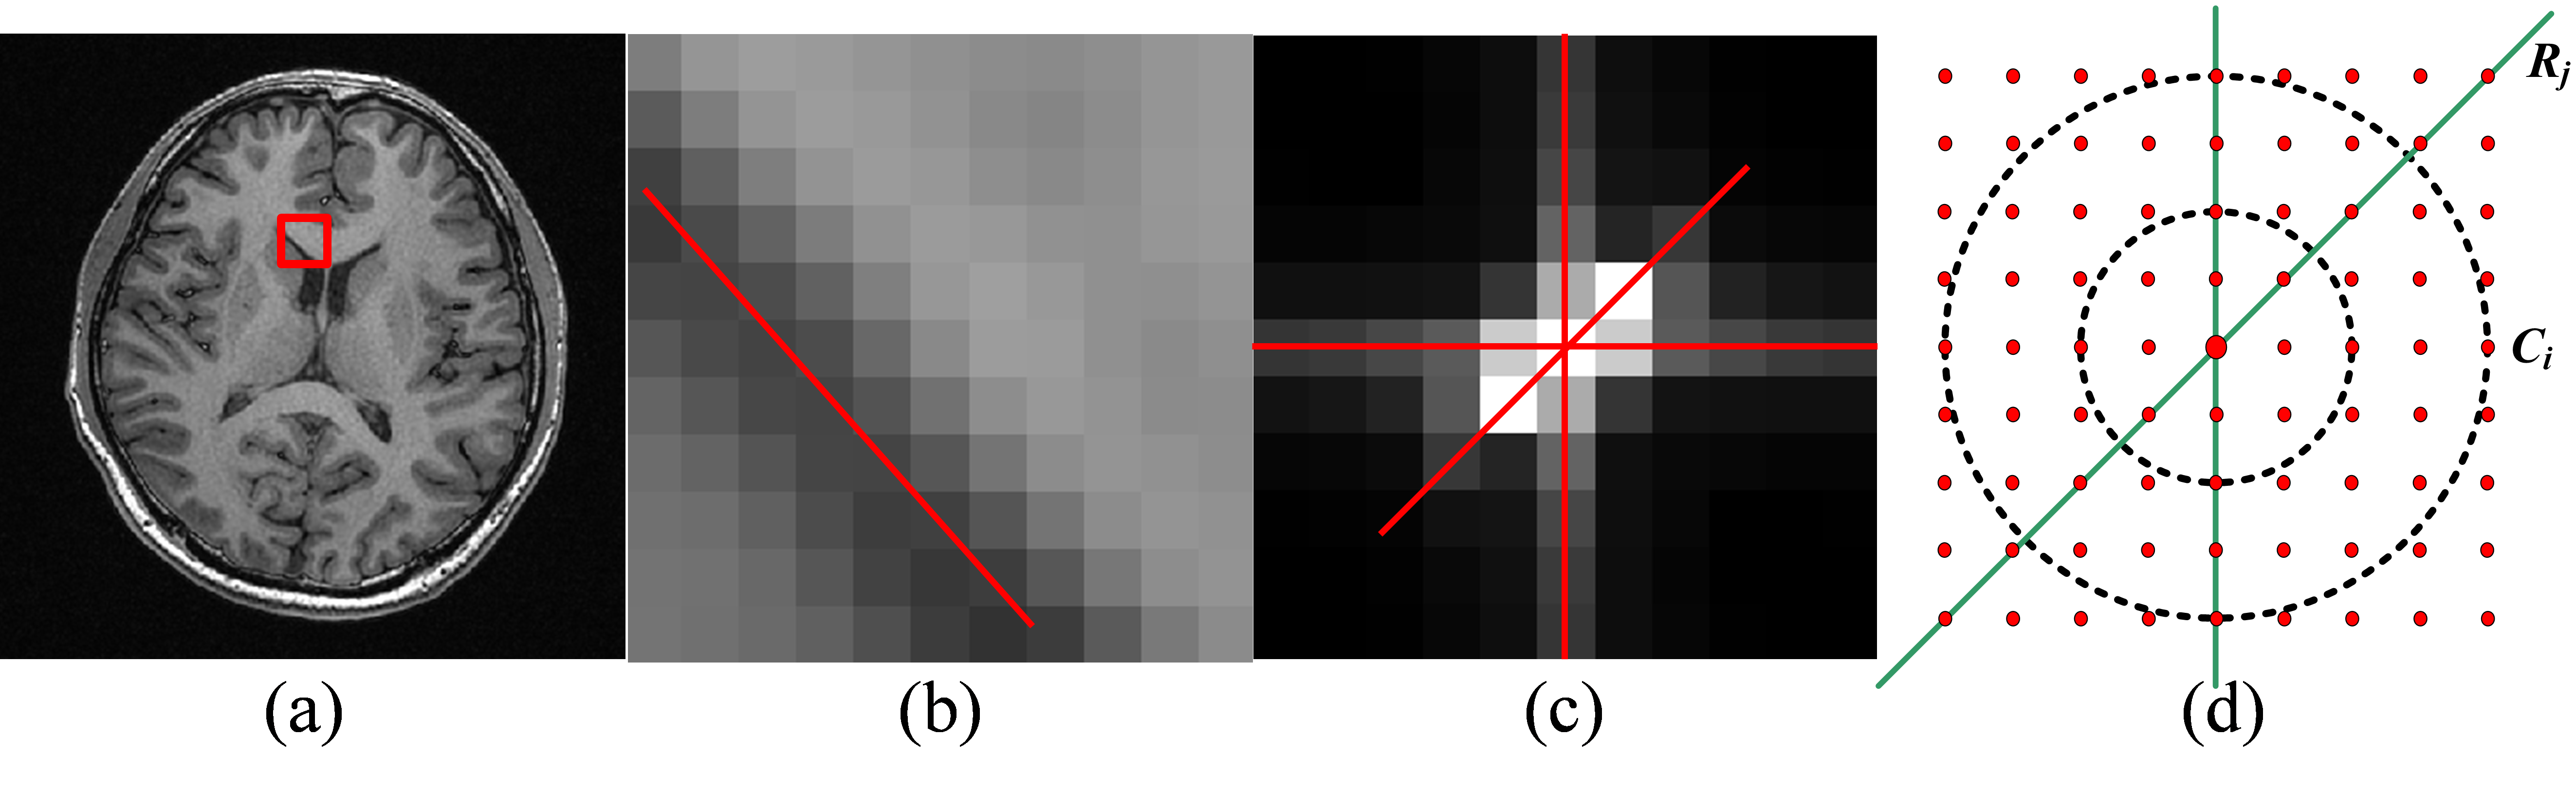
In Fig.1, we observed that for the local patch in the MRI brain image, its frequency components primarily distribute in the low and middle frequency areas in the spectrum along three directions, among which the direction having maximum energy is perpendicular to the edge in the spatial domain. To illustrate the spectrum of size n×n, we denote the total frequency energy in the direction j as Rj, with the spectrum evenly sampled into K directions in the range of [0, π]. The frequency energy of all directions are sorted in descending order as $$$R=\left \{ R_{1},R_{2},...,R_{K} \right \}$$$, where the direction corresponding to R1 is defined as the first primary direction. In the same way, the frequency components along the circumference Ci are calculated to statistic different frequency levels, denoted as $$$C=\left \{ C_{1}, C_{2},..., C_{(n-1)/2)} \right \}$$$. While there are many clustering algorithms, we use the standard K-means in our method, since it is relatively fast and performs well.
a. Coarse clustering
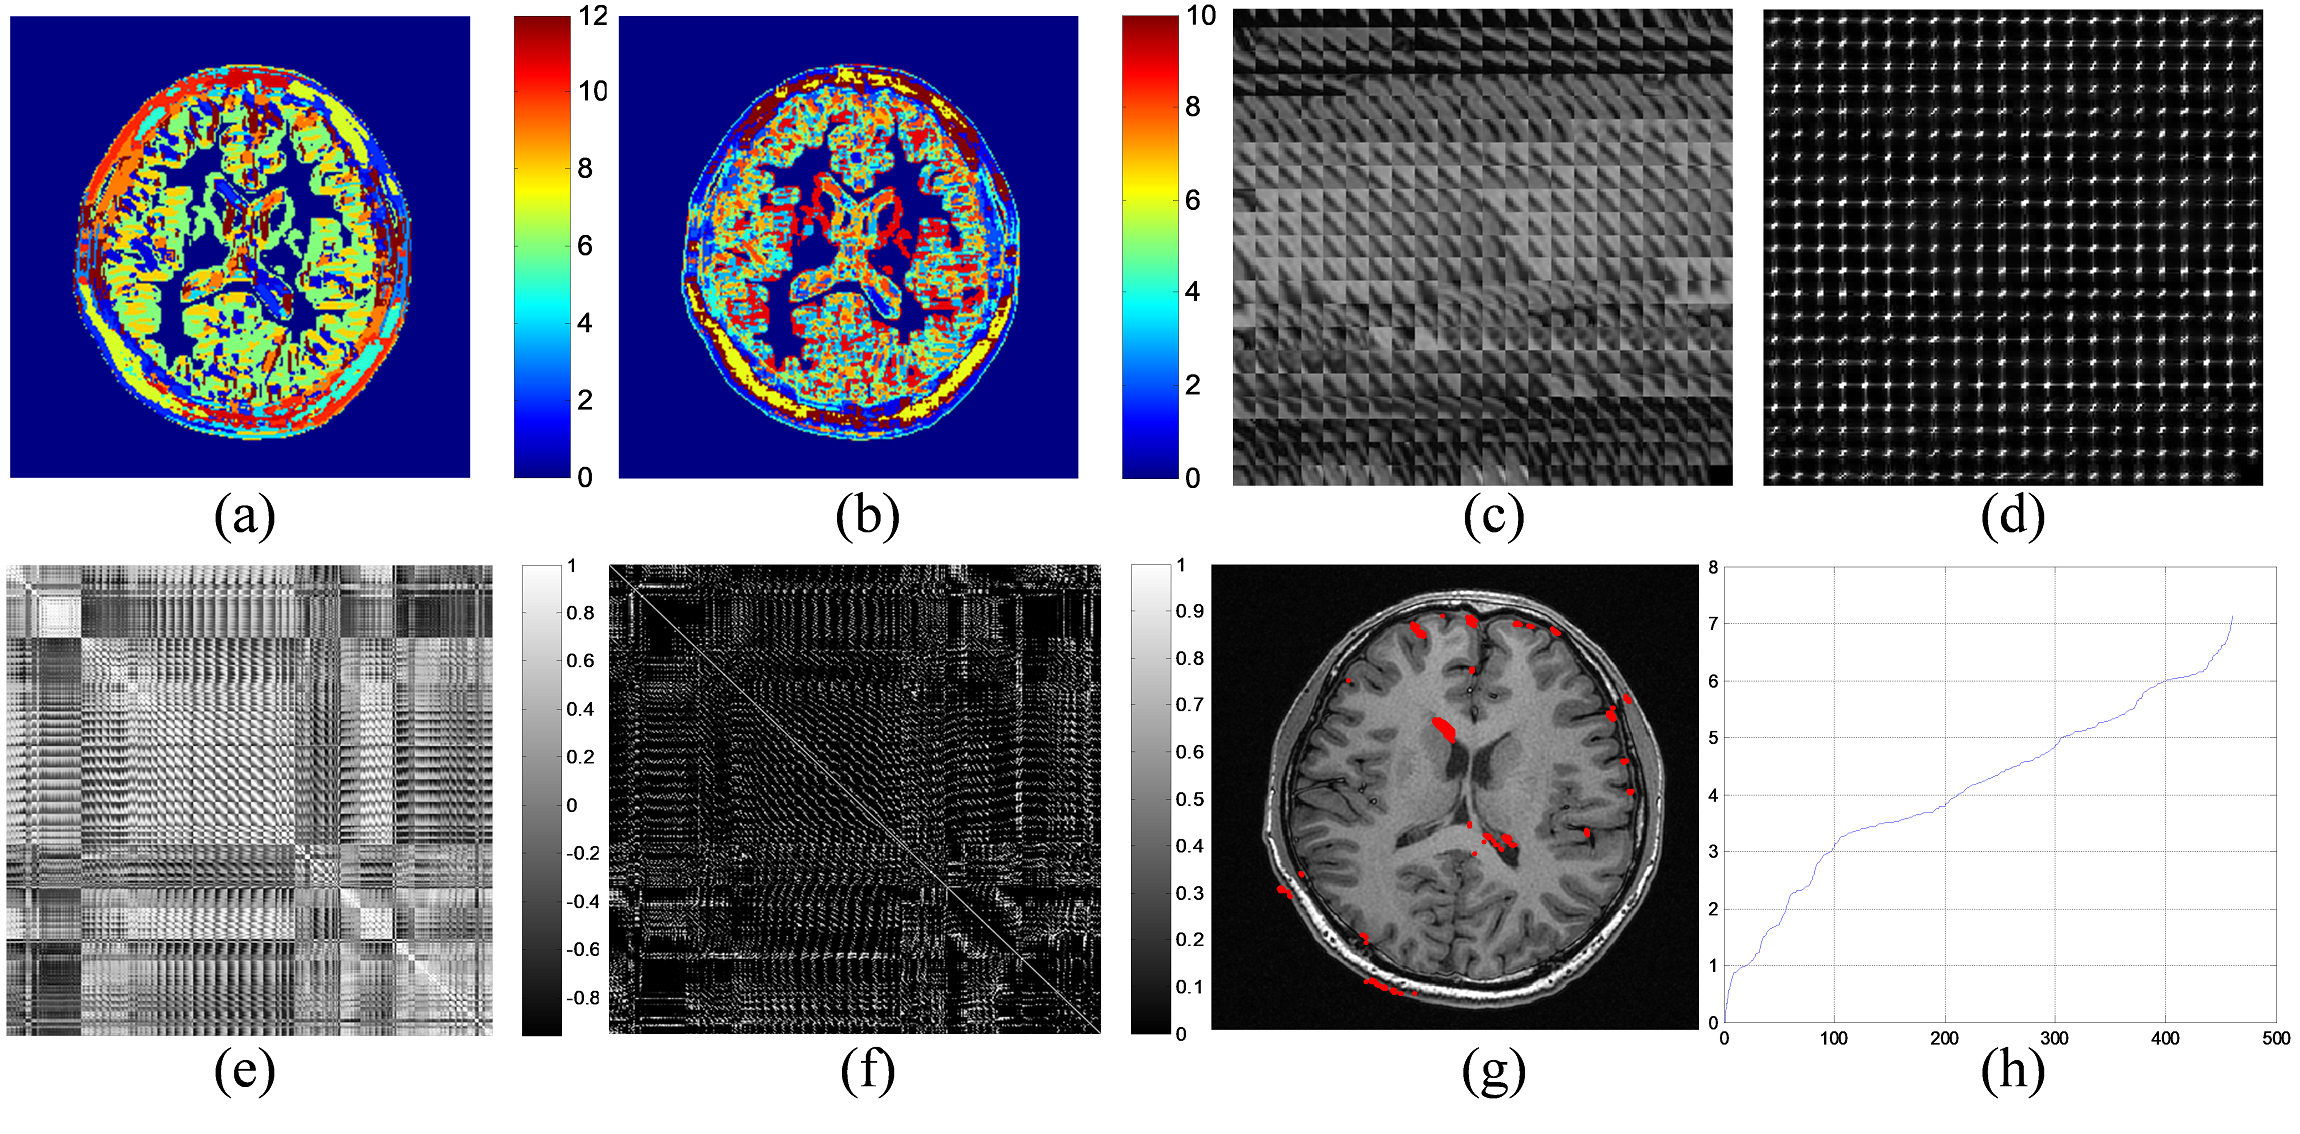
In Fig. 2, the clustering results using R and C as the feature descriptor separately are shown, with homogeneous patches removed from clustering. Combining R and C as a complex feature descriptor, the patch in Fig. 1b is clustered into the group in Fig. 2c. To evaluate the clustering performance, a matrix was used to measure the correlation coefficient between any two patches, and a matrix of p-values (p<0.05) for testing the hypothesis of correlation. In Fig. 2g, indicating the center pixel of each patch in Fig. 2c by the red dot, it demonstrated that the similar patches locate in the global image but not non-local. Here, the nearest neighborhood search can be further implemented in the clustering result, according to the Euclidean distance to the target patch as shown in Fig.2h.
b. Fine clustering
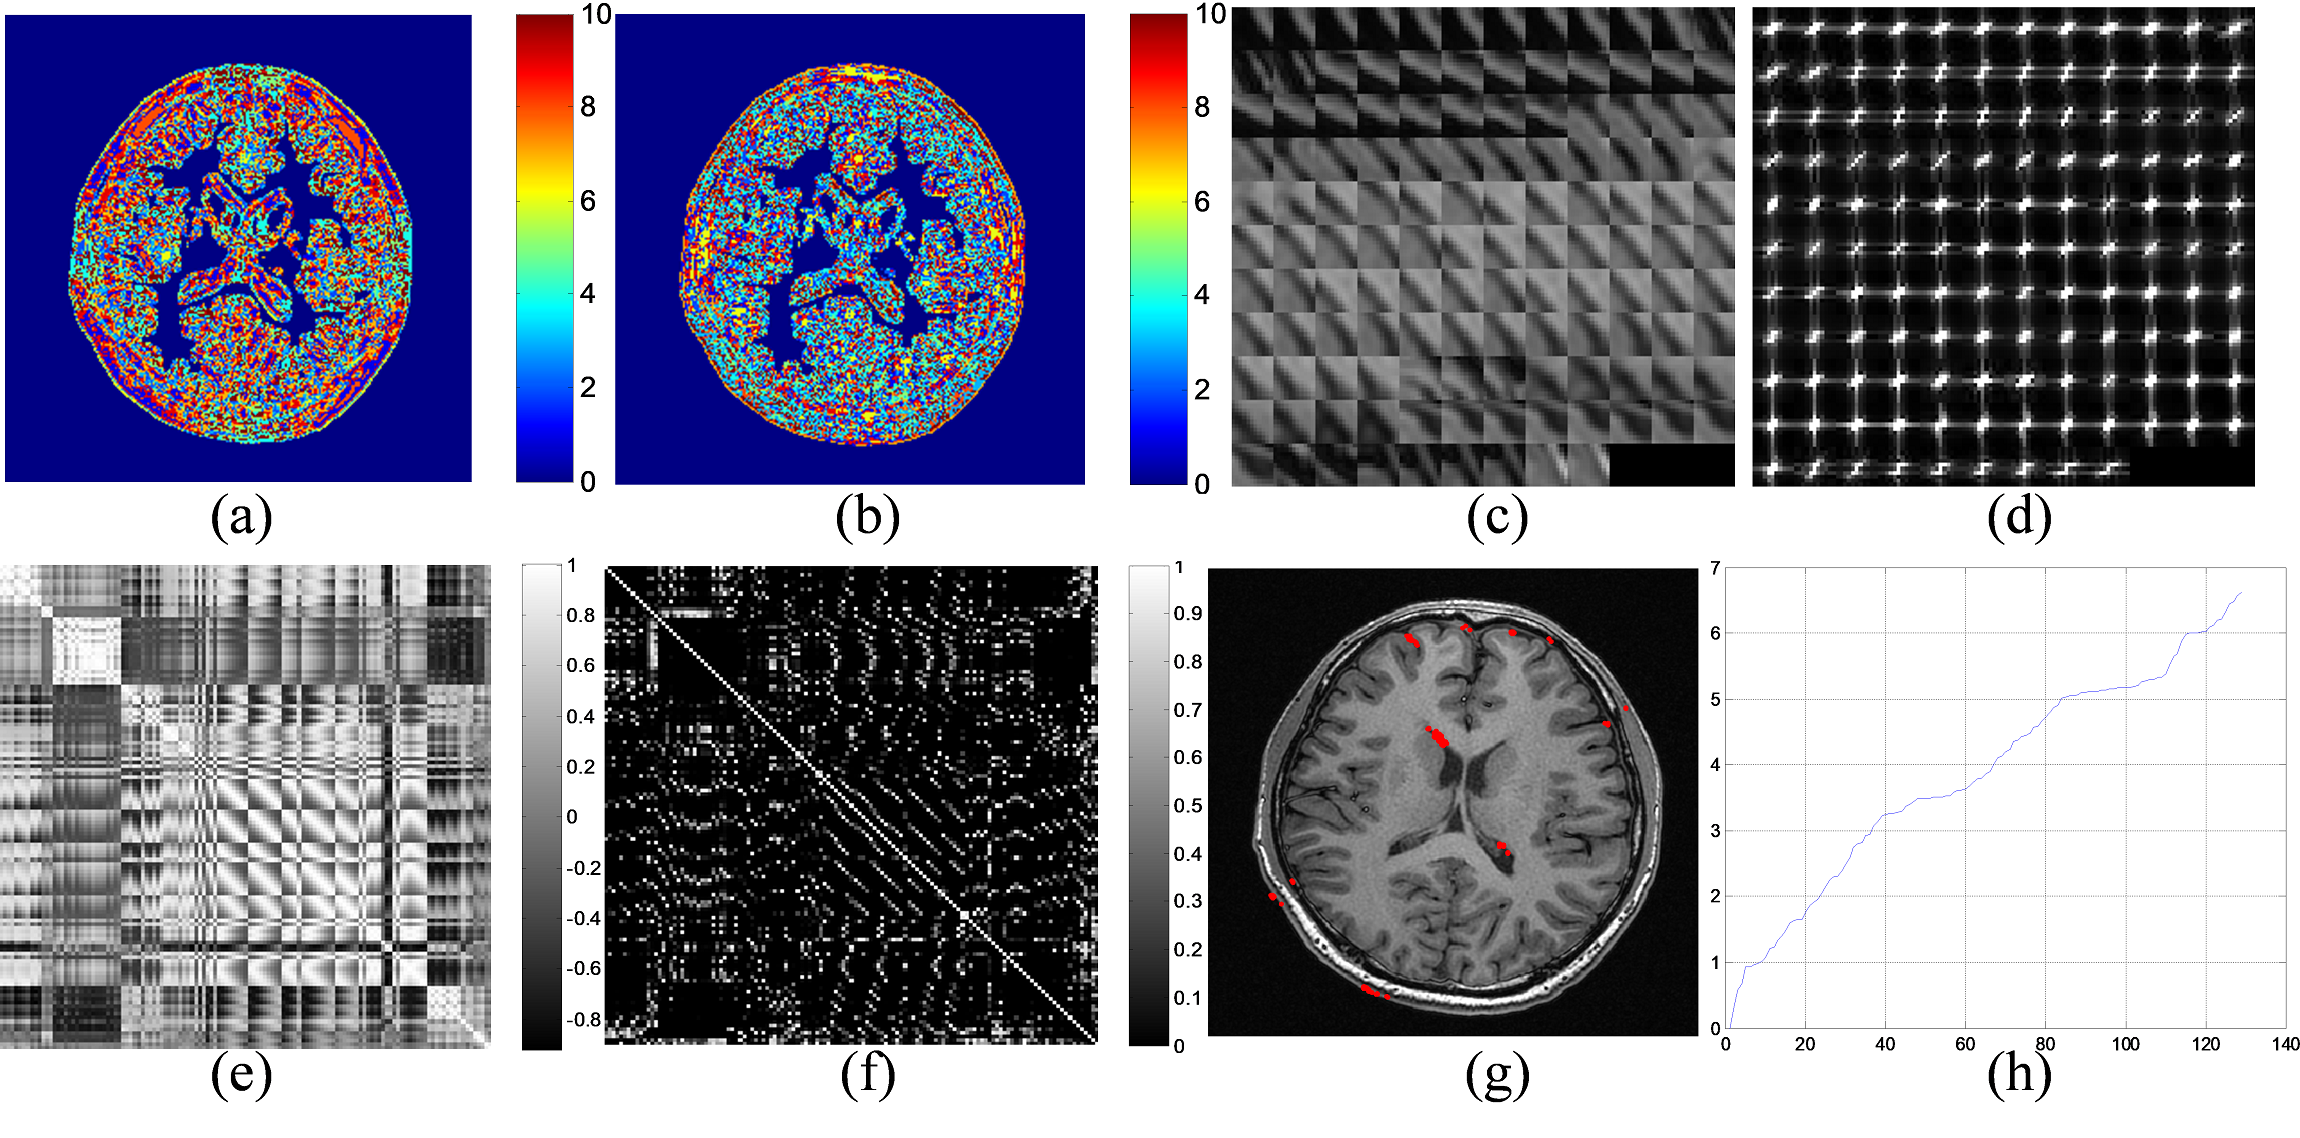
Although the feature descriptor combining R with C is qualified for general clustering, a delicate clustering is often necessary for large-scale data. Therefore, we extend the feature descriptor with more spectrum features. Since $$$R=\left \{ R_{1},R_{2},...,R_{K} \right \}$$$ aims to describe the frequency energy along each direction, the ratio of $$$R_{j}/R_{j+1}$$$ could be added into the feature descriptor to measure the direction concentration of the frequency energy. Furthermore, the value of $$$C_{i}/C_{i+1}$$$ is also introduced to determine the energy ratio of different frequency segments. In Fig. 3, the clustering results are updated, where less patches are grouped in Fig. 3c compare to Fig.2c. However, the most similar ones are preserved while those of different structure complexity are not removed.
c. Comparison with other methods
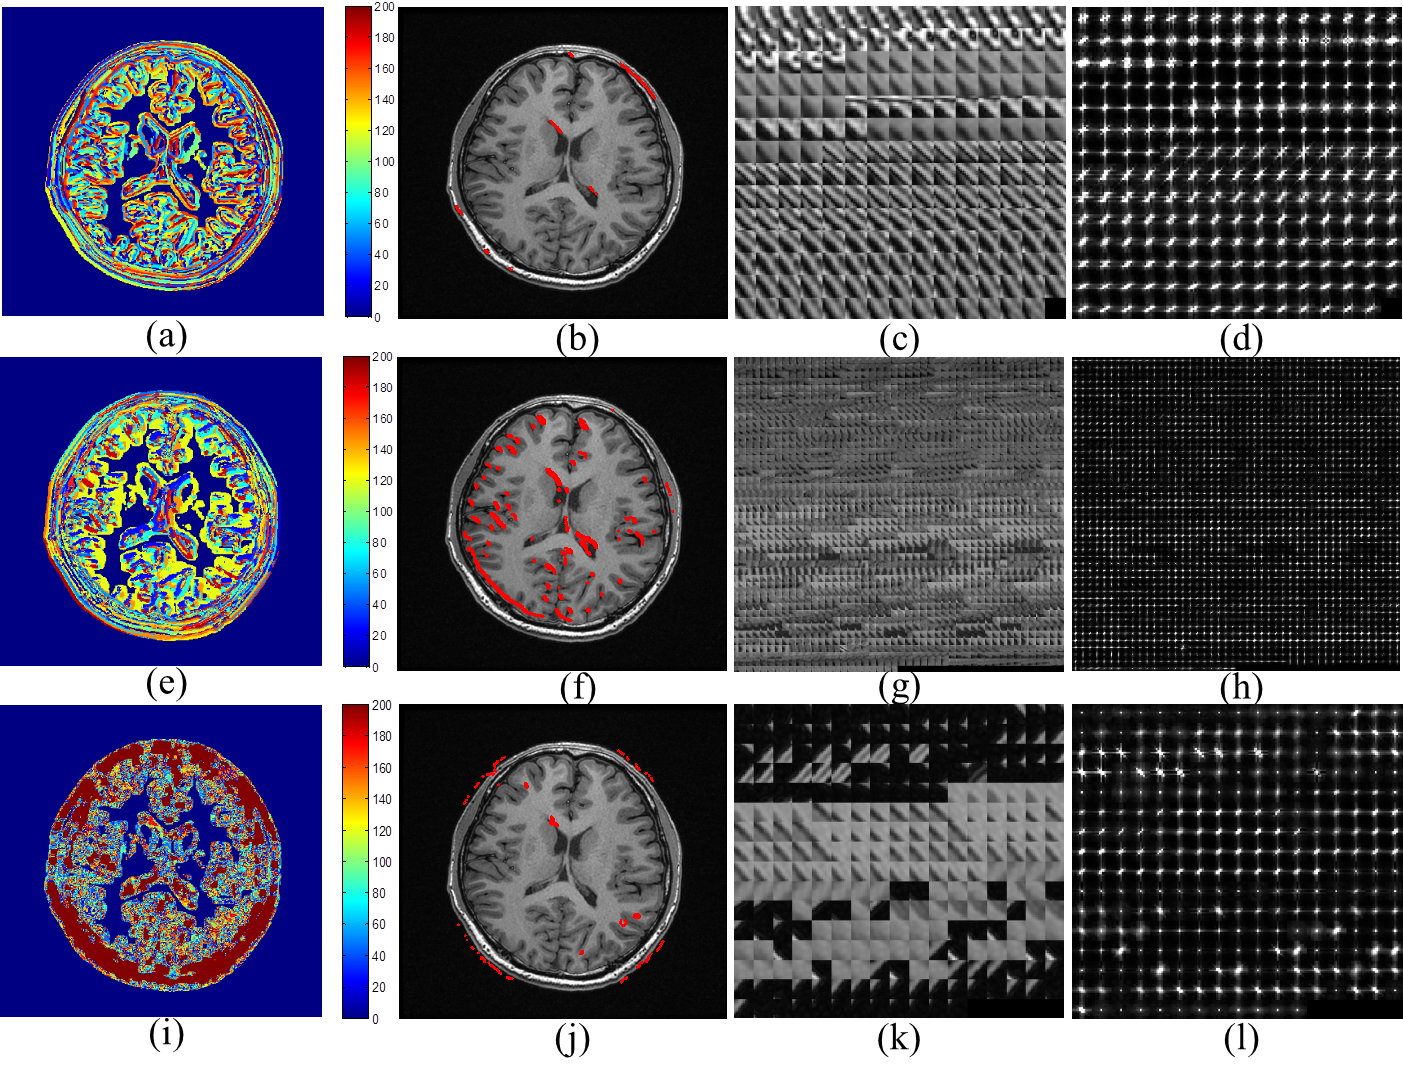
Fig.4 shows the clustering results obtained from three comparison methods: classical k-means6,7, GMM8,9 and PLOW10. We observe that the k-means method is prone to cluster the local neighbor patches into a group without considering structure features. As for the GMM, the exampled cluster has so many patches of different structure types and the PLOW method groups some patches of perpendicular edge directions in one cluster. In contrast, our method is more efficient and also easy to apply with no complicated computation. It takes about 33s to calculate the feature descriptors for an image of size 512×512 implemented in MATLAB on a windows 7 workstation with an Intel Xeon CPU E5-1620 without parallel computing.
Discussion and Conclusion
Due to the MRI principle, a tissue may present different signal intensity in acquisition with different pulse sequences, especially for cross-modality in the radiomics. Therefore, the clustering feature descriptors based on the intensity information in the spatial domain is not sufficient and reliable. In this work, we propose a new clustering method based on the features extracted from the frequency spectrum, which are always neglected in other methods. It can be either applied alone for patch or image clustering, or combined with feature descriptors designed in the spatial domain, to describe image while decreasing the data dimension in the clustering related MRI processing problems.Acknowledgements
This work was supported by the NNSF of China under Grants 81301277, the Research Fund for the Doctoral Program of Higher Education of China under Grant 20130121120010 and NSF of Fujian Province of China under Grant 2014J05099.References
1. Anil K. Jain, Data Clustering: 50 Years Beyond K-Means, Pattern Recognition Letters, 2010; 31(8):651-666.
2. Andrew Y. Ng, On Spectral Clustering: Analysis and an algorithm, https://ai.stanford.edu/~ang/papers /nips01-spectral.pdf
3. Matthew Brown, Gang Hua, Member, Simon Winder, Discriminative Learning of Local Image Descriptors, IEEE Transactions on Pattern Analysis and Machine Intelligence, 2011; 33(1),45-57.
4. Karen Simonyan, Andrea Vedaldi, Andrew Zisserman, Learning Local Feature Descriptors using Convex Optimisation, IEEE Transactions on Pattern Analysis and Machine Intelligence, 2014; 36(8):1573-1585.
5. Muja Marius, Lowe G. David. Scalable nearest neighbor algorithms for high dimensional data. IEEE Transactions on Pattern Analysis and Machine Intelligence, 2014; 36(11):2227–2240.
6. Dabov Kostadin, Foi Alessandro, Katkovnik Vladimir, Egiazarian Karen, Image Denoising by Sparse 3-D Transform-Domain Collaborative Filtering, IEEE Transactions on Image Processing, 2007; 16(8): 2080-2095.
7. Dong Weisheng, Zhang, D., Shi Guangming, Wu Xiaolin, Image Deblurring and Super-Resolution by Adaptive Sparse Domain Selection and Adaptive Regularization, IEEE Transactions on Image Processing, 2011; 20(7): 1838-1857.
8. Yu Guoshen, Sapiro, G., Mallat, S., Solving Inverse Problems with Piecewise Linear Estimators: From Gaussian Mixture Models to Structured Sparsity, IEEE Transactions on Image Processing, 2012; 21(5):2481-2499.
9. Wang Yi Qing, Morel Jean Michel. SURE Guided Gaussian Mixture Image Denoising. SIAM Journal on Imaging Sciences, 2013; 6(2):999-1034.
10. Priyam Chatterjee, Peyman Milanfar, Patch-Based Near-Optimal Image Denoising, IEEE Transactions on Image Processing, 2012; 21(4), 1635-1649.
Figures