2807
Multivariate pattern analysis of multi-band MRI k-space1Functional MRI Laboratory, University of Michigan, Ann Arbor, MI, United States, 2Biomedical Engineering, University of Michigan, Ann Arbor, MI, United States, 3Carillon Research Institute, Virginia Tech, Roanoke, VA, United States
Synopsis
Multi-band MRI allows for accelerated MR acquisition. However, the reconstruction algorithms, being more complex, require increased reconstruction time without advanced hardware. In this work, we extend classification of MR k-space data to multi-band imaging, enabling rapid prediction of brain state without the need for image reconstruction. We also demonstrate that high prediction accuracy can be achieved even with reduced k-space coverage.
Introduction
Multi-band MRI allows for accelerated MR acquisition, enabling higher temporal rates or increased spatial resolution. However, the reconstruction algorithms have increased processing demands, making rapid analysis or real-time imaging challenging without advanced hardware.
Multivariate pattern classification and prediction offers an alternative to standard univariate techniques. It has been applied in functional MRI analysis using support vector machines (SVM)1, and used to attain real-time feedback2. The standard approach has been to use reconstructed image magnitude data3. However, classification may also be done directly on Fourier (k-space) data4, and this has been demonstrated in traditional 2D MRI acquisitions5.
In this work, we extend classification of MR k-space data to multi-band imaging, enabling prediction of brain state without lengthy image reconstruction time. We also demonstrate that reduced k-space acquisitions can achieve high prediction accuracy.
Methods
Data Acquisition: Four subjects were scanned on a 3T GE 750 MR scanner (Waukesha, WI). Two versions of a multi-band EPI sequence were used to collect data: 1) Multi-band factor 3, 45 slices, 2.7x2.7x3 resolution, TR=1.2 s, 2 subjects 2) Multi-band factor 6, 60 slices, 2.4x2.4x2.4 resolution, TR=0.8 s, 2 subjects (based off the current ABCD multisite study). Two runs of alternating right-hand, left-hand finger tapping (20s each condition in a cycle, 8 cycles) were scanned in each subject.
Analysis: Multivariate prediction was done using SVM with a linear kernel in MATLAB, with the model trained on run 1 and tested on run 2. SVM analysis was done on the magnitude k-space data for each subject, for every slice grouping. Reconstructed image data was also analyzed for comparison. Weight vector maps were calculated to examine distribution of model weights. Feature reduction was also investigated by rerunning the classification by using only the central 5% of k-space.
Results
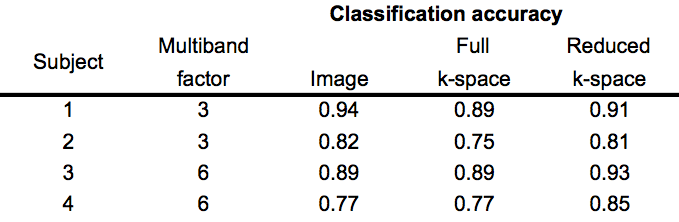
Classification accuracy using the multi-band k-space data was very comparable to using the reconstructed image data (Table 1). The reduced k-space data had higher accuracy compared to full k-space data, for both multi-band factors.
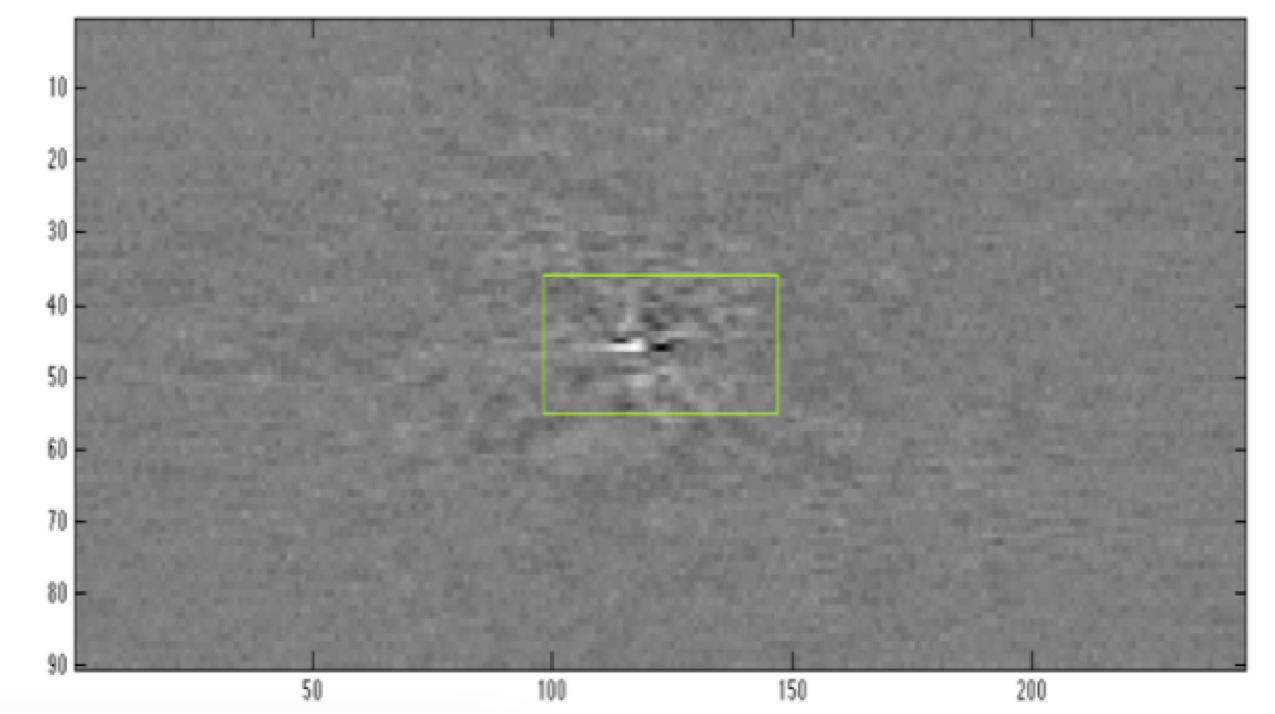
Significant k-space model weights are largely located in more central k-space, while outside of central k-space the model weights are fairly sparse (Figure 1). The green outline shows the region used for reduced k-space classification.
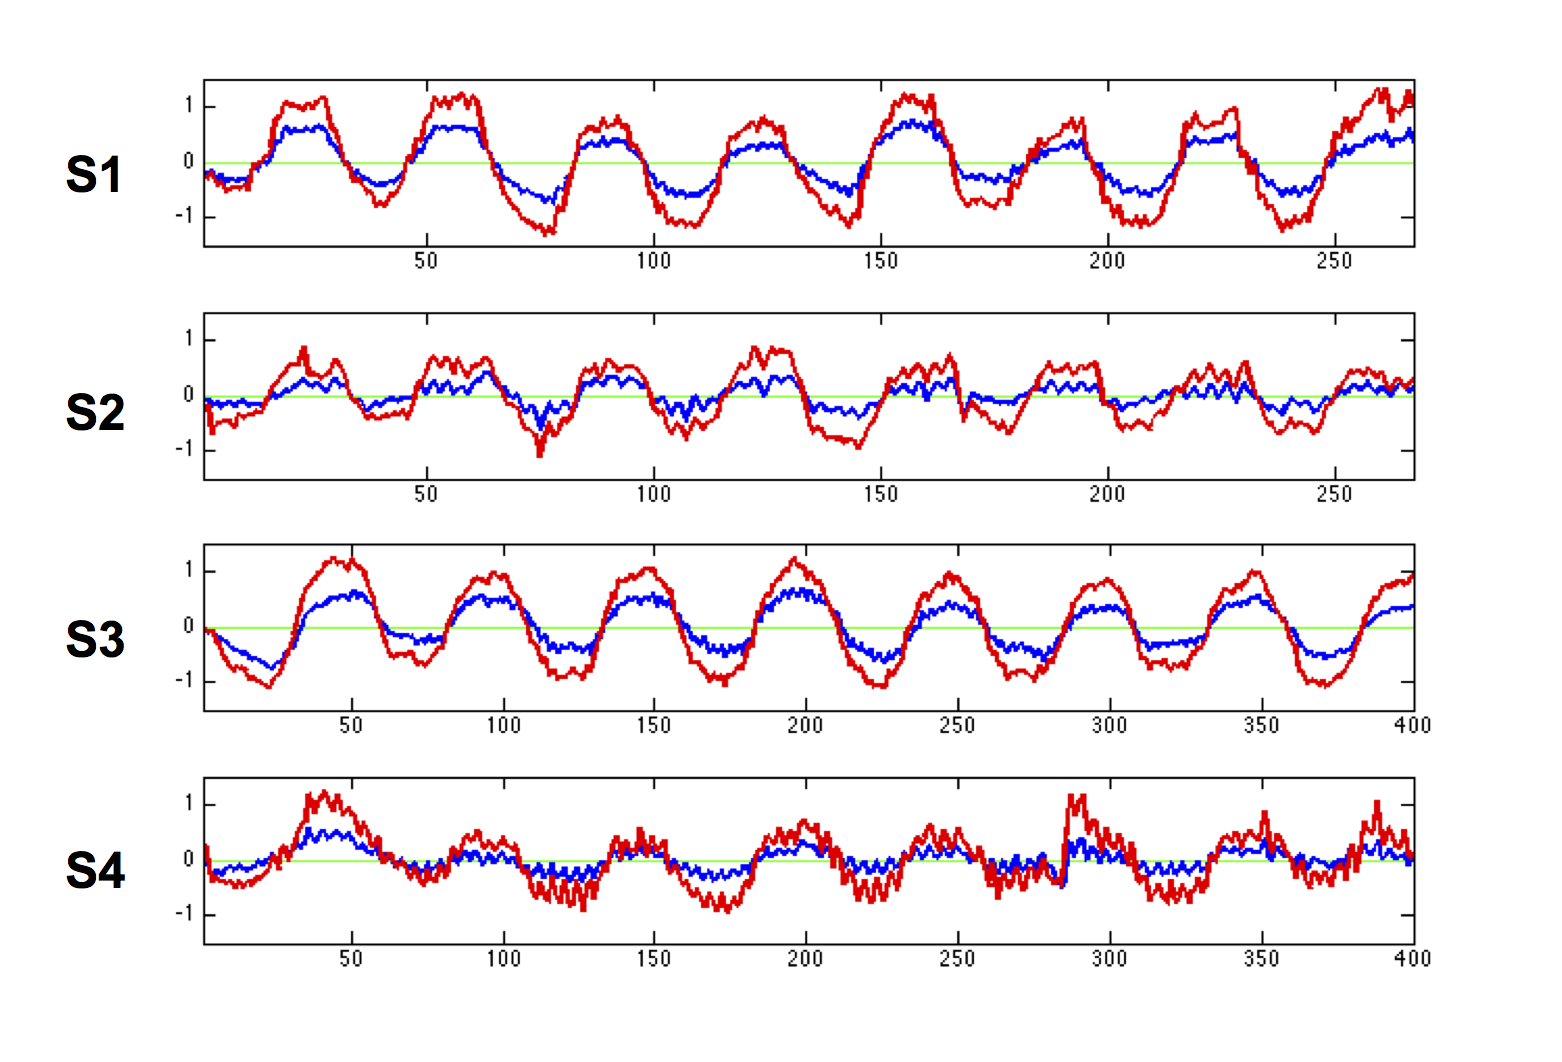
Figure 2 plots the average predicted timecourses using the full and reduced k-space data, for all subjects. It can be seen that using the reduced k-space data increases discrimination between the two conditions, particularly for subjects 2 and 4.
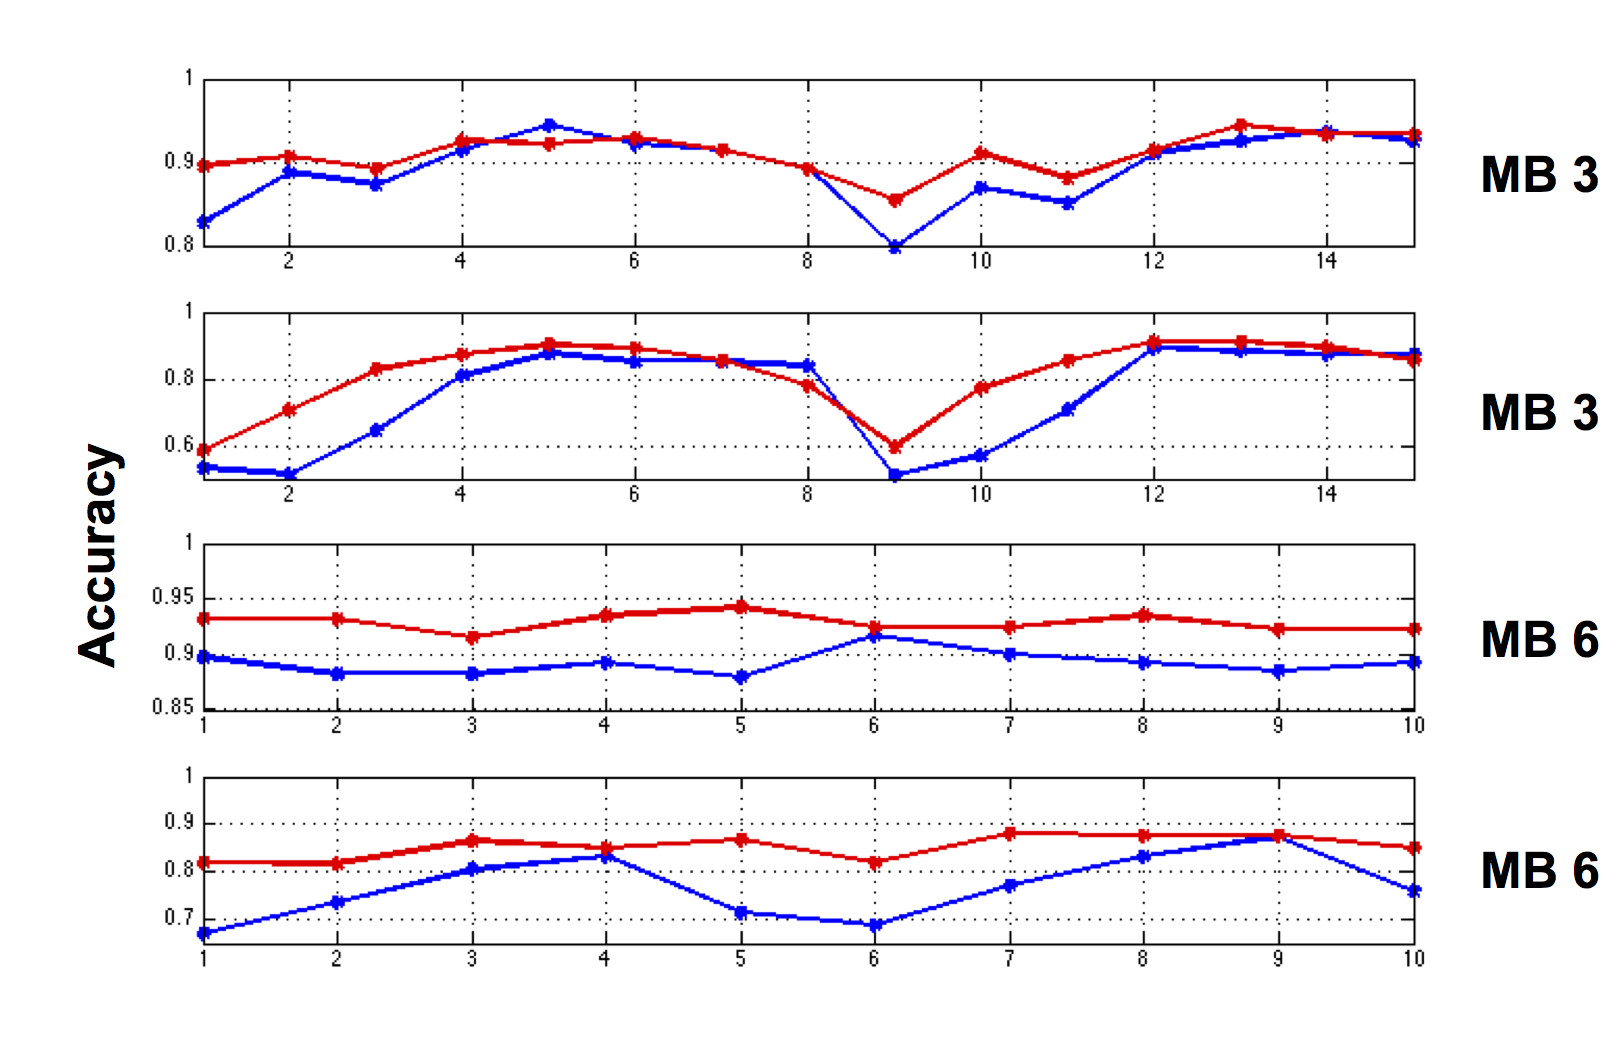
The classification accuracy per multi-band slice grouping is shown in Figure 3. The reduced k-space data classification has increased accuracy in almost all instances, with the majority being above 80% accuracy.
Conclusion
We have demonstrated the feasibility of using multivariate classification on unreconstructed multi-band k-space data. High prediction accuracy was achieved, even when using reduced k-space for classification.
Further work will apply these results to real-time monitoring in multi-band experiments, and the exploration of limited k-space acquisitions for extremely rapid temporal sampling.
Acknowledgements
No acknowledgement found.References
1) S.M. LaConte, S. Strother, V. Cherkassky, and X.P. Hu, NeuroImage, vol. 26, 2005, 317-329.
2) S.M. LaConte, S.J. Peltier, and X.P. Hu, Human Brain Mapping, vol. 28, 2007, 1033-1044.
3) K.A. Norman, S.M. Polyn, G.J. Detre, J.V. Haxby, Trends Cogn Sci., vol.10, 2006, 424-430.
4) H. Spies, and I. Ricketts, 'Face Recognition in Fourier Space', Proc. Vision Interface, 2000, 38-44.
5) S.J. Peltier, J. Lisinski, D.C. Noll, and S.M. LaConte. 'Support vector machine classification of k-space fMRI data', Proc. Human Brain Mapping, 2009.
Figures