2794
Synthetic FLAIR image from multi-echo GRE using U-Net1School of Electrical and & Electronic Engineering, Yonsei University, Seoul, Republic of Korea, 2Seoul St. Mary's Hospital, College of Medicine, The Catholic University of Korea, Seoul, Republic of Korea
Synopsis
The fluid-attenuated inversion recovery(FLAIR) image is one of the most frequently scanned images useful for detecting and diagnosing various lesions. The FLAIR technique suppresses cerebrospinal fluid(CSF) signal by using specific TR and long TE. The WM-GM contrast is similar to the T2-weighted image, except that CSF signal is suppressed. Multi-echo GRE(mGRE) has increasingly been used for medical diagnosis. Here, we used the mGRE images to create a synthetic FLAIR image using deep learning.
Introduction
There were several previous studies indicating mGRE to potentially have some relevant information with FLAIR1,2. However, mapping from mGRE to FLAIR is nonlinear and not straight-forward. With the advent of deep learning, questions arise as to whether mGRE images can be learned to produce FLAIR-like contrast. The U-Net structure has been widely used for medical image processing3,4. We applied U-Net to determine whether synthetic FLAIR can be generated from mGRE.Methods
Data set
We scanned 17 volunteers in their 24 to 29 years old. Of the 17 subjects, 15 were used as train data and 2 were used as test data. Input: 11 echo mGRE (1mm*1mm, 2mm slice thickness), 192*192*32*11 echoes. Output: FLAIR (1mm*1mm, 2mm slice thickness), 192*192*32. We obtained 40 slices in the z direction, but we used only 32 slices in the central part. Preprocessing tasks included normalization and data augmentation. The data amount is augmented 4x by inverting upside down, right and left.
Pulse sequence
mGRE was acquired with a total of 11 echoes starting from TE1 = 4.1ms and echo spacing of 3.9ms. TR was 50ms and the total scan time (TA) was 6:26. FA = 30o. The FLAIR was scanned with the following parameters: TE = 94ms, TI = 2500ms, TR = 9000ms, TA = 3:38, FA = 150o.
Network architecture and image quality assessment
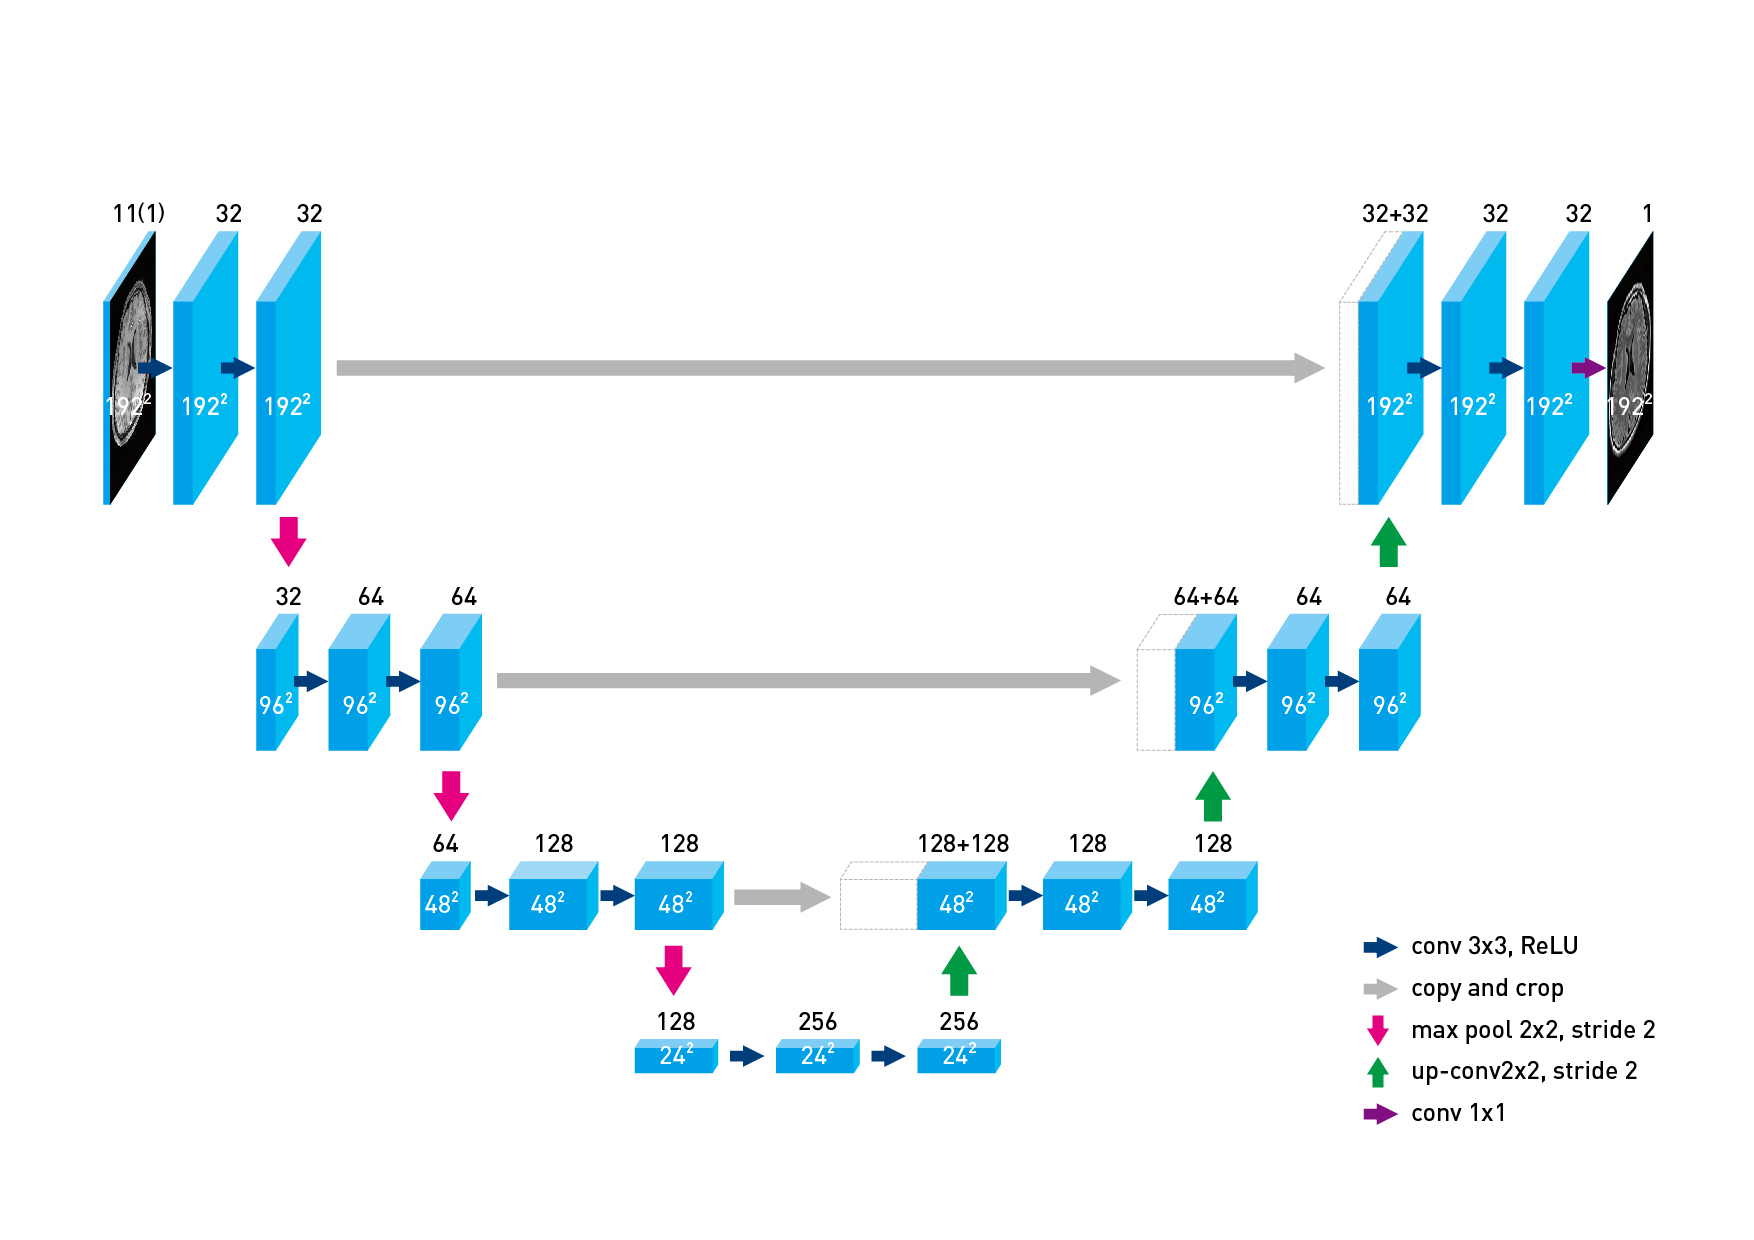
The structure of U-Net includes encoder-decoder and skip connection (Fig. 1). Up-sampling was performed without unpooling nor interpolation. The U-Net minimizes the L1 losses. We used convolution kernel size of 3x3, ReLU transfer function and Adam optimizer. We tested the difference between using only 1 early echo and all the 11 echoes.
We used the Structural similarity(SSIM)5 to compare using 1 echo and using all echo and calculated the mean absolute error (MAE) to evaluate the image quality.
Results
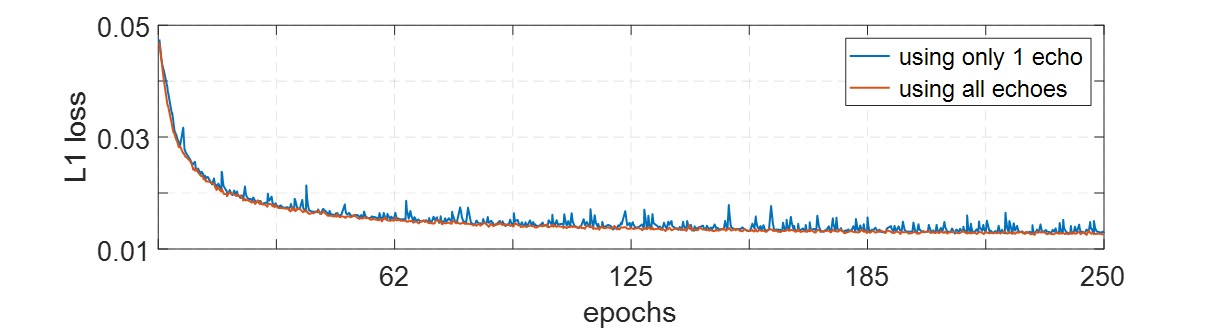
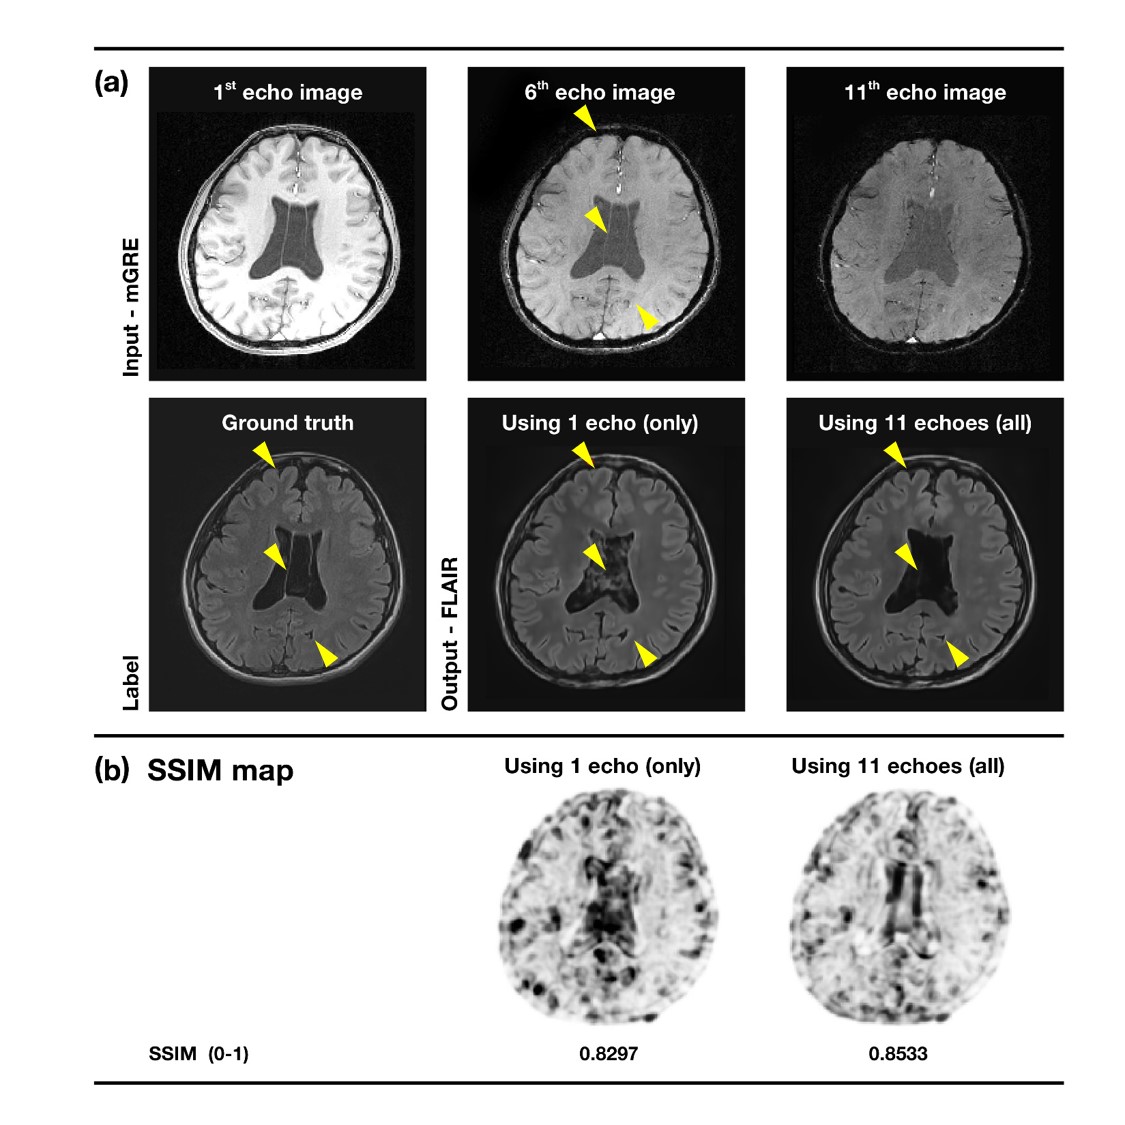
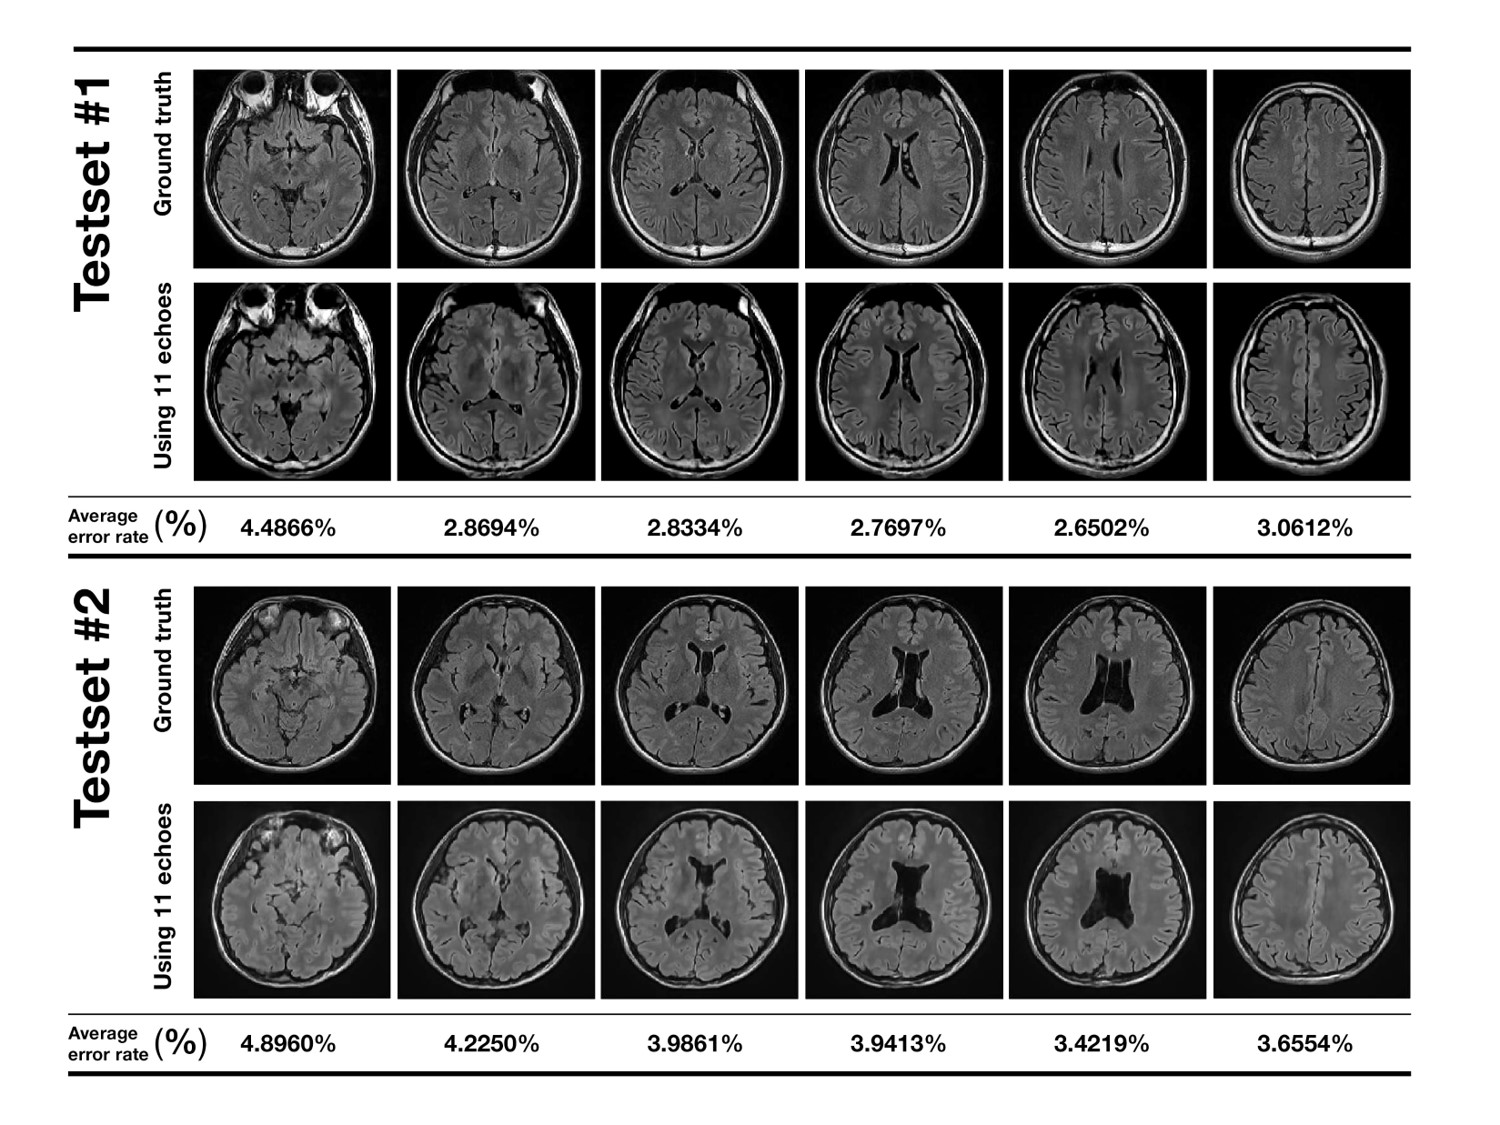
The change in the loss value when using only 1 echo and all the echoes are shown in Fig. 2. When using only 1 echo the variance in the loss function is high, while the loss value drops more steadily using 11 echoes. Figure 3a shows comparison in synthetic FLAIR generated from 1 echo GRE and that from all the echoes. In the CSF region, it can be seen that is more noise in the case of using 1 echo. Additionally, in the peripheral region, using all echoes follow the true FLAIR more accurately (yellow marker). As for the SSIM, we found that using 1 echo (0.8297) gave smaller values than using all echo (0.8533) on average. The SSIM map also confirms this (Fig. 3b). Figure 4 demonstrates resulting test data from the two different subjects: synthetic FLAIR and the ground truth. The error rate was from 2.65% to 4.89%. Also, it could be seen that the water region in CSF is well suppressed in synthetic image consistent with the ground truth.Discussion
In this study, we showed that mGRE images can be used to generate synthetic FLAIR images by using deep learning. Since mGRE can be used to generate various contrast images1,6 mostly by a linear mapping function, the ability to generate synthetic FLAIR using nonlinear U-Net structure expands the usefulness of this sequence. Also, we investigated the effectiveness of choosing multi echoes images for input compared to single echo image input. This may be due to the fact that multi echo input may supplement the low contrast to noise ratio (CNR) of the first echo input, i.e. in peripheral region, CSF. In this study, we validated our method using only normal subjects. However, our result should be tested on patient data as well.
Acknowledgements
This research was supported by Basic Science Research Program through the National Research Foundation of Korea(NRF) funded by the Ministry of Science, ICT and future Planning (NRF-2016R1A2B3016273)References
1. Luo J., et al. Gradient Echo Plural Contrast Imaging — Signal model and derived contrasts: T2*, T1, Phase, SWI, T1f, FST2*and T2*-SWI. Neuro Image. 2012. p.1073-1082
2. Joseph V. Hanjnal., et al. Use of Fluid Attenuated Inversion Recovery (FLAIR) Pulse Sequences in MRI of the Brain. J Computer Assist Tomogr. 1992. p. 841-844
3. O. Ronneberger, P. Fischer, and T. Brox. U-net: Convolutional networks for biomedical image segmentation. In MICCAI. 2015. p. 234–241
4. Yo S. Han., et al. Deep Residual Learning for Compressed Sensing CT Reconstruction via Persistent Homology Analysis. arXiv. 2016. 1611.06391v2
5. Wang Z., et al. Image Quality Assessment: From Error Visibility to Structural Similarity. IEEE Trans. Image Processing. Vol. 13. 2004. p. 600-612
6. Deistung A., et al. Toward in vivo histology: A comparison of quantitative susceptibility mapping (QSM) with magnitude-, phase-, and R2*-imaging at ultra-high magnetic field strength. Neuro Image. 2013. p. 299-314
Figures