2792
Tailored Magnetic Resonance Fingerprinting: optimizing acquisition schedule and intelligent reconstruction using a block approach1Medical Imaging Research Center, Dayananda Sagar Institutions, Bangalore, India, 2Wipro GE Healthcare, Bangalore, India, 3Dept.of Radiology, Columbia University Medical Center, NewYork, NY, United States
Synopsis
Magnetic Resonance Fingerprinting technique concurrently generates multiple parametric maps providing for accelerated quantitative imaging. However, quantification of tissues with long T2 such as Cerebrospinal Fluid (CSF) remains a challenge. The main aim of this study is to design acquisition parameters to quantify tissues with long T2 values employing a block based, contrast Tailored MRF (TMRF) approach. In addition, this work emphases on a Neural Network (NN) approach that does not demand noise simulation and/or dictionaries.
Purpose & Introduction:
Magnetic Resonance Fingerprinting technique1 concurrently generates multiple parametric maps providing for accelerated quantitative imaging. However, quantification of tissues with long T2 such as Cerebrospinal Fluid (CSF) remains a challenge1. The primary aim of this study is to design acquisition parameters to quantify tissues with long T2 values employing a block based, contrast Tailored MRF (TMRF) approach. Secondly, this work emphasizes on a Neural Network (NN) approach that does not demand noise simulation and/or dictionaries.Methods:
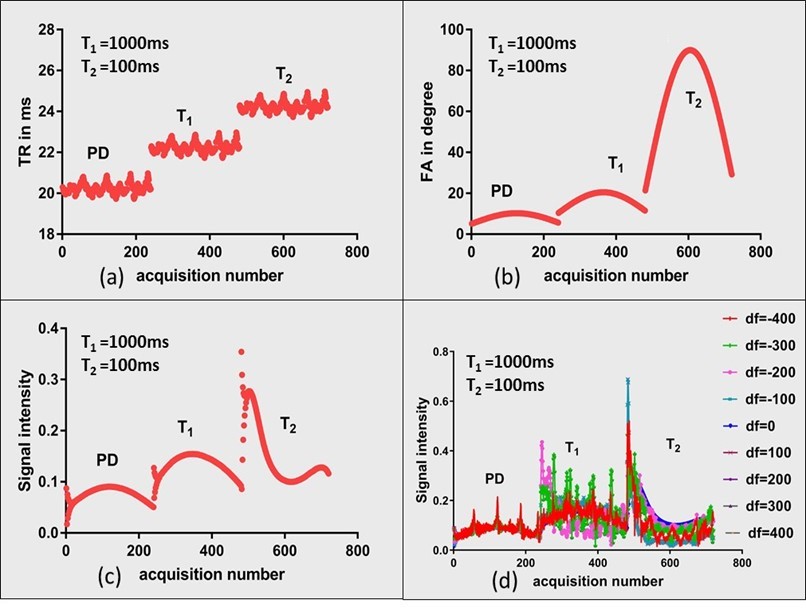
Acquisition: The signal intensity of a gradient echo based sequence is more reliant on the Flip Angle (FA) than the Repetition Time (TR) due to the minimal TRs usually employed in such cases2. Consequently, the required contrast can be achieved by an optimal choice of the FA. We form three blocks that optimize contrast for Proton Density (PD), T1 and T2 weighting as shown in Fig. 2(a). This lets each tissue type to enhance in one of the three blocks. TRs and FAs were independently designed for each block and then combined into a single sequence. A 5s delay between each block was provided to decrease the effect of magnetization history from preceding block. Each block comprised of 240 acquisitions as shown in Fig 1(a-b), signal evolution for gray matter with different off-resonance (df) is shown in Fig 1(c-d). An inversion pulse is played before the acquisition with inversion time of 2750ms to suppress the signal from CSF in the first block. TRs were designed based on Perlin noise pattern while FAs were designed based on the equation below. Here, range block is defined for each block based on the Ernst angle curve and minFA is minimum FA used. Three human in vivo brain data, each of 16 slices, 256 x 256 matrix size, were acquired on a 1.5 T GE Signa with a spiral readout time of 5ms with a fixed Echo Time (TE) of 2.7ms, as part of an institution approved study. The spiral trajectory consisted of 48 arms. A total of 720 images were acquired in 49s, inclusive of Inversion Time (TI) and delay between the blocks employed for magnetization recovery. FA = Sine(2*pi*t/500)*rangeblock*minFA
Reconstruction: The sliding window based reconstruction method was employed to obtain an improved initial estimate3. In contrast to existing supervised learning/NN based MRF reconstruction approaches, median filtered MRF data was trained on conventionally acquired parametric maps. This alleviated the need to include synthetically generated noise in the network and the subsequent challenges to determine structure of the noise that accurately represents the data acquired from the scanner. The NN consisted of a single hidden layer of 20 nodes, trained on 10K samples of conventionally acquired maps, binned into training (70%), cross-validation (15%) and testing (15%) categories. The regression plots for T2 map training are shown in Fig. 2(b). The reconstructed maps were utilized to generate signal intensity images with acquisition parameters of the conventionally acquired maps as well as to synthesize contrast with any combination of TR/FA/TE. Normalized Root-Mean-Square-Error (NRMSE) metric was employed to quantify the differences between the NN reconstruction and Ground Truth (GT) data. In addition, T2 values greater than 500ms (long T2 - CSF related) were considered as the fifth case and compared to test the block-based hypothesis.
Results:
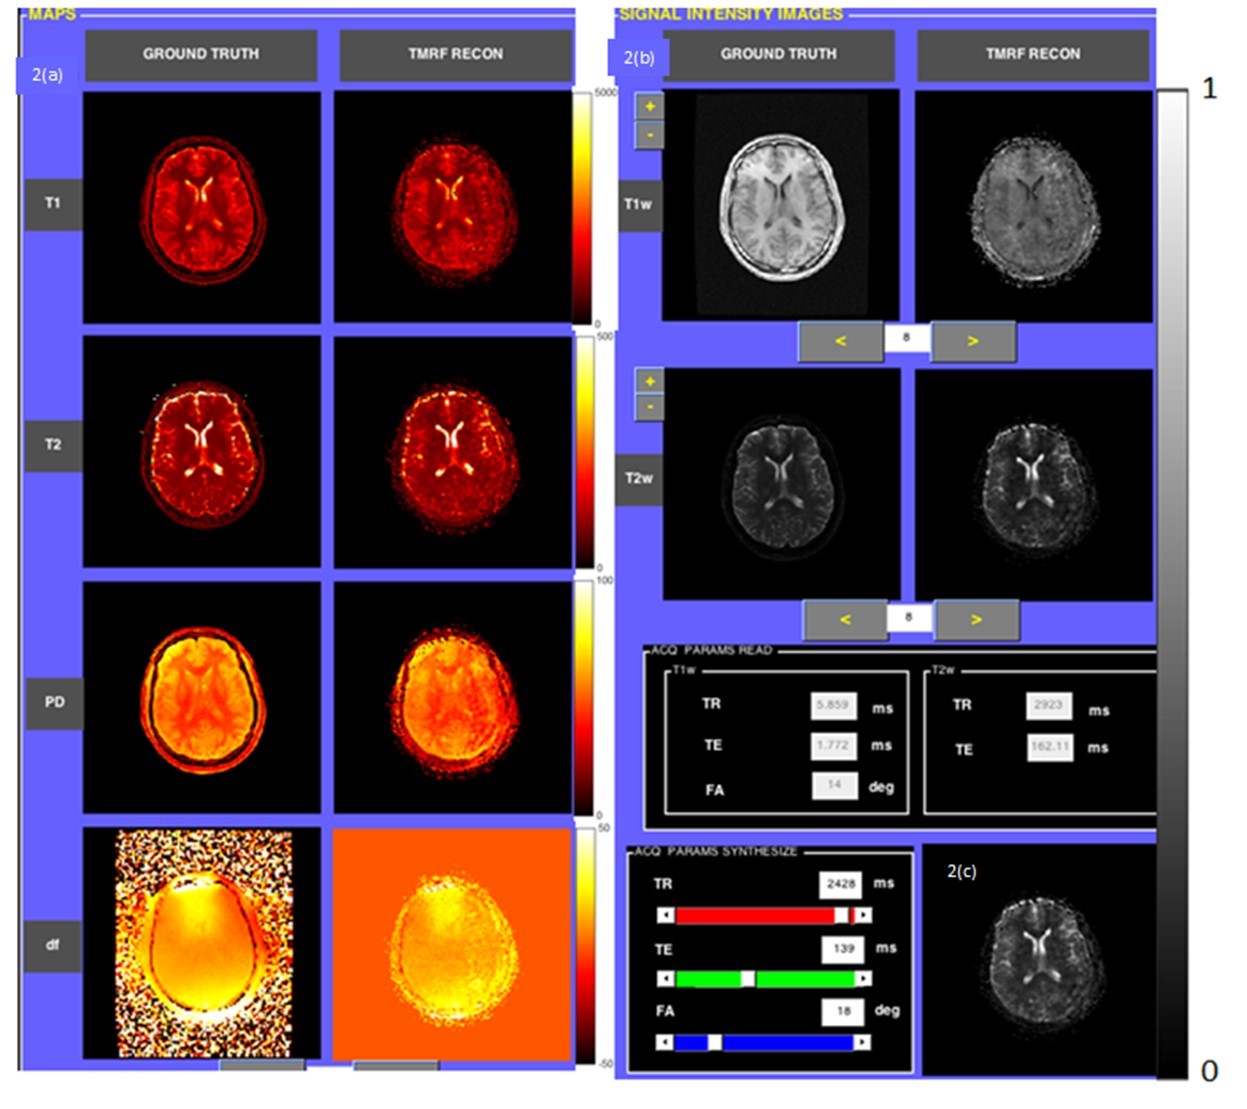
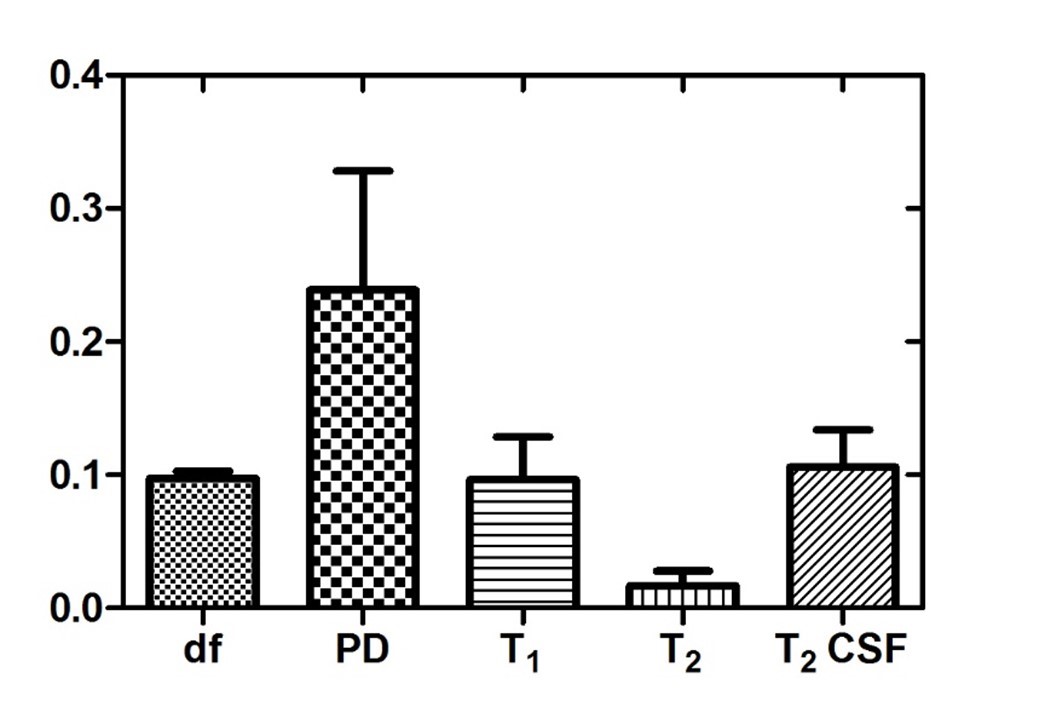
Fig. 3(a-c) depict the central slice of reconstruction from Dataset1 (D1). It can be noted that the four maps (3a) and synthesized signal intensity images (3b) are qualitatively similar. In particular, T2 quantitation of CSF was accurate due to the presence of the third block. Fig. 3(c) illustrates the capability of synthetic MR with the options to vary acquisition parameters (sliders in User Interface, Fig. 3(c)). The estimated and target data in regression plots shown in Fig. 2(b) depict a high degree of correlation. This is also reflected in the qualitative results shown in Fig. 3(a) and quantitative results of NRMSE values shown in Fig. 4. The T2 values are well estimated as can be seen in columns 4 and 5 (long T2) in Fig. 4.Conclusion & Discussion:
Accelerated acquisition of multi-parametric MR data based on schedule optimization for tailored contrast has been demonstrated, with robust estimation of long T2 components. Dictionary-less, rapid, robust, computationally efficient MRF data reconstruction with low memory requirements has been proposed and preliminary data demonstrated. The acquisition time is longer than that of conventional MRF method. This can be attributed to the long TRs employed to obtain weighting essential for quantifying high T2. TMRF could be used as a tool to optimize anatomy specific protocol to highlight/suppress tissues of choice.Acknowledgements
This work was supported by Department of Science and Technology (DST) - DST/TSG/NTS/2013/100 and Vision Group on Science and Technology (VGST), Govt. of Karnataka, Karnataka Fund for strengthening infrastructure (K-FIST), GRD#333/2015.References
[1] Dan Ma, et. al., Nature [2] Truhn et.al, ISMRM 2017 [3] Cao, et. al., MRM 2016Figures