2777
Reproducibility of Native Renal T1 mapping for Renal Tissue Characterization1Radiology, Leiden University Medical Center, Leiden, Netherlands, 2Nephrology, Leiden University Medical Center, Leiden, Netherlands
Synopsis
Introduction
Renal disease often progresses unnoticed as clinical parameters deteriorate late in the disease course, indicating the need for the non-invasive imaging biomarkers. Renal disease is characterized by alterations in renal tissue composition, which could be used for differentiating specific renal diseases and disease monitoring via the mapping of true T1 values (T1 mapping). Preclinical studies have shown that T1 mapping could be helpful for identifying acute kidney injury and prediction of chronic kidney disease (1), (2), (3), and recent clinical studies showed promising results for the detection of fibrosis and prediction of graft functioning after kidney transplantation (4), (5). However, studies investigating the reproducibility of renal T1 mapping are lacking. Here we describe the assessment and reproducibility of native T1 mapping for renal tissue characterization.Methods
Renal native T1 mapping was performed in 15 healthy human volunteers using the Modified Look-Locker Imaging (MOLLI) 5s(3s)3s sequence on a clinical 3.0 T MR system. For intra-session reproducibility measurements were repeated without changing the position of the original planning in the same session. Inter-session reproducibility was assessed on the same day, and thus after removal of the subject from the magnet, and repositioning of subject, coil, and repeated planning.
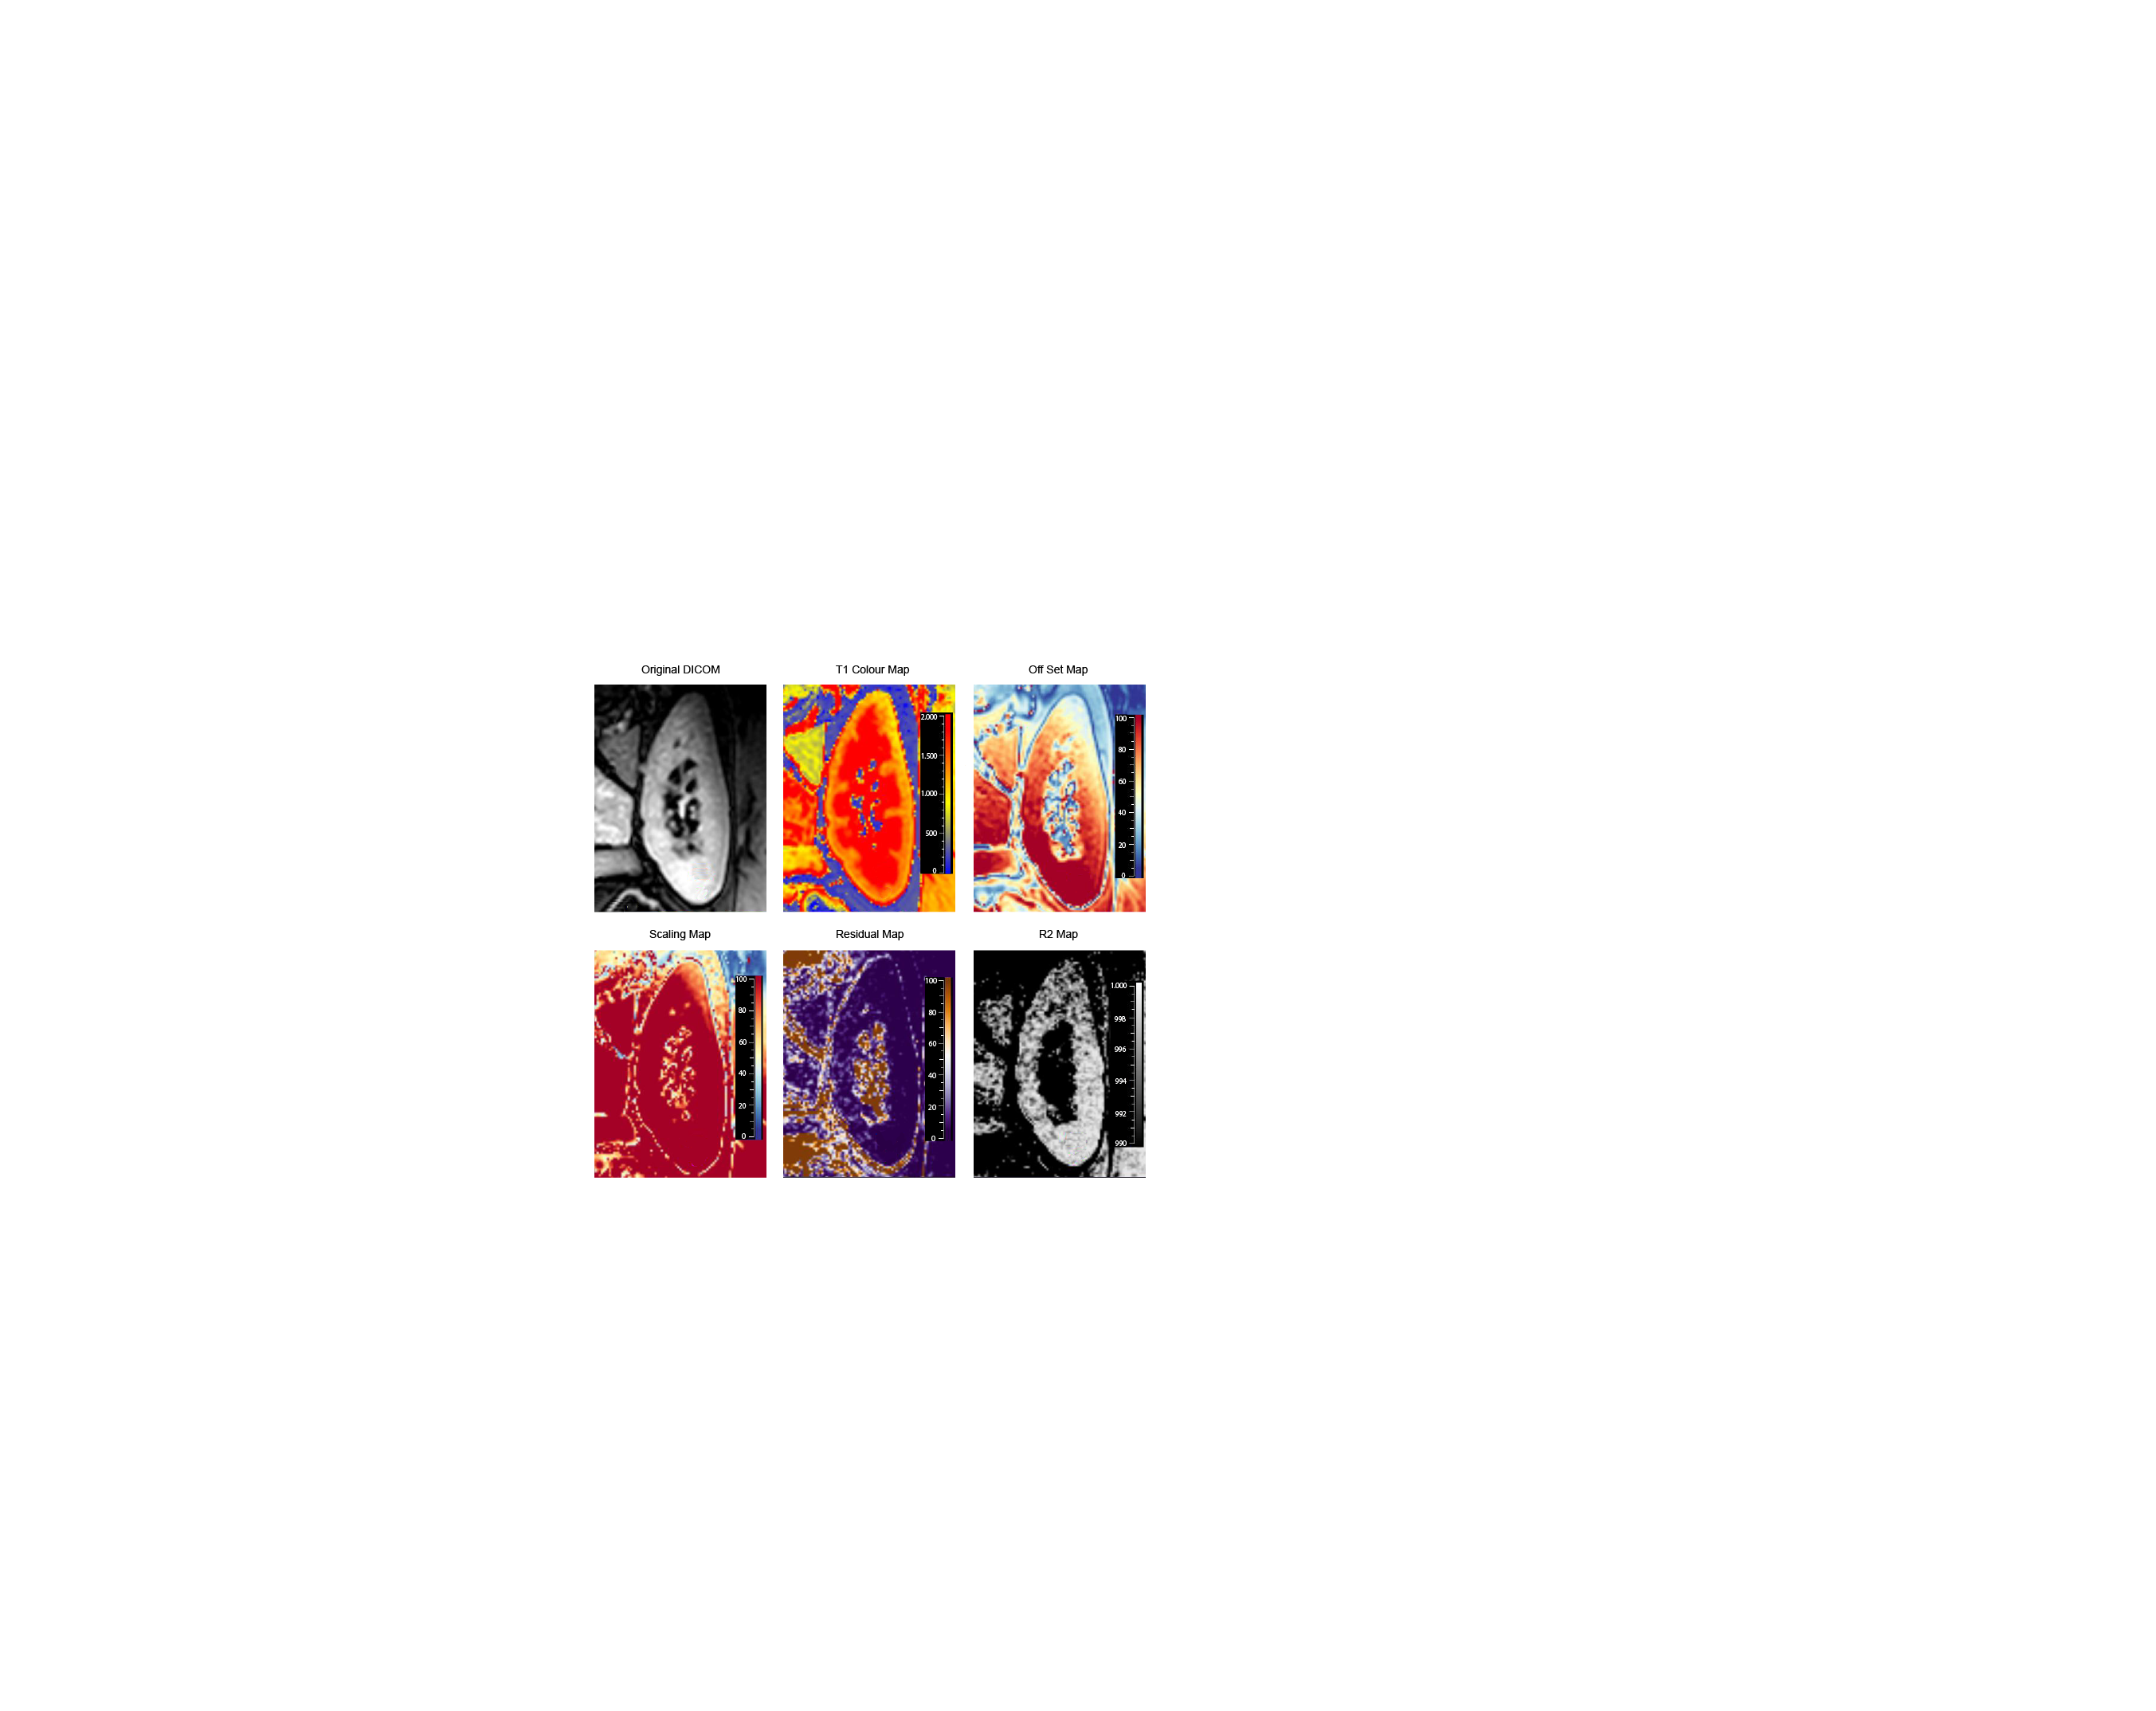
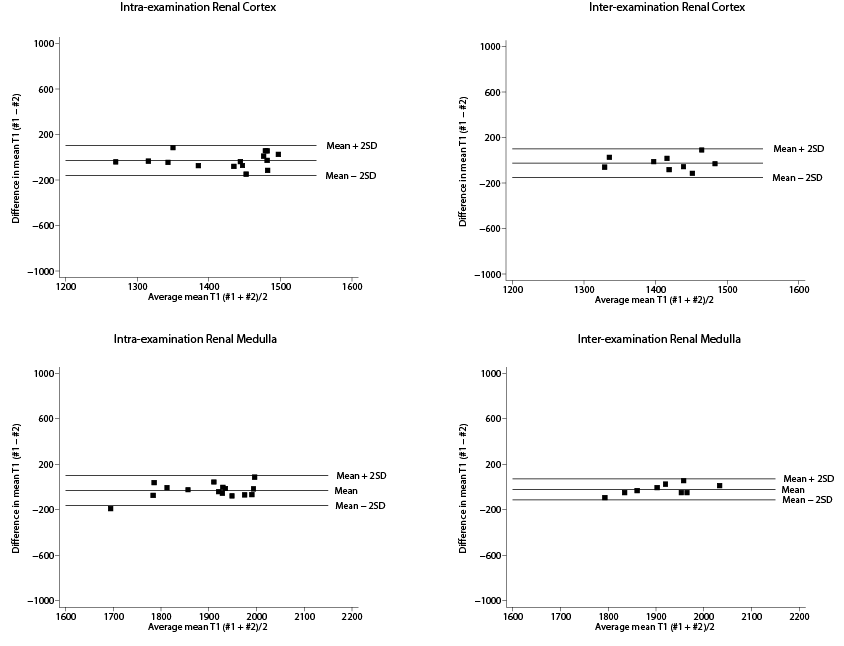
Post-processing was done using QMap Research Edition (Medis, Leiden, the Netherlands) using received data in DICOM format. Colour coded T1-maps were derived for intra- and inter-examination measurements, and corresponding T1 values of renal medulla and cortex were assessed. Reproducibility was determined using Bland-Altman analysis and intra-class correlation coefficients were calculated.
Results
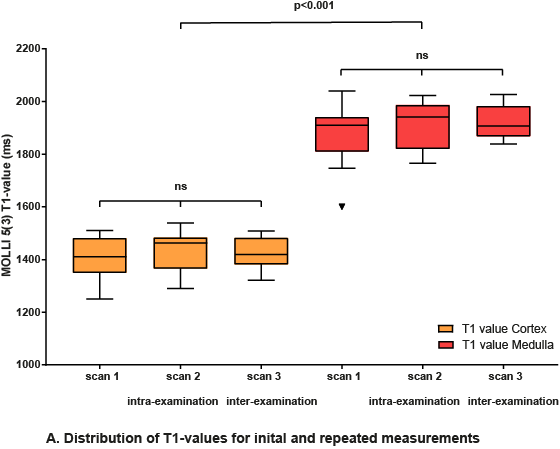
Mean age 30 ±13 years (range 19, 63), males 47% (n=7). Overall mean T1-values of MOLLI 5s(3s)3s were 1437 ± 59 ms (range 1695-2006 ms) for renal cortex, 1912 ±62 ms (range 1270-1487 ms) for medulla. Both intra-examination (r=0.65) and inter-examination (r=0.49) measurements were highly correlated with renal cortex first T1-value measurements. Also for medullary measurements, both intra-examination (r=0.80) and inter-examination (r=0.88) measurements were highly correlated with first T1-value measurements. Intra-examination ICC’s of renal cortex and renal medulla were respectively 0.77 (95% CI 0.34, 0.92) and 0.86 (95% CI 0.57, 0.95). Inter-examination ICC’s for renal cortex and medulla were 0.65 (95% CI -0.38, 0.92) and 0.99 (95% CI 0.59, 0.98). The Bland-Altman lower and upper limits of agreement for intra-examination and inter-examination T1 measurements of renal cortex were respectively -160 ms (95% CI -224, -98) and 102 ms (95% CI 40, 166), and -149 (95% CI -234, -66) and 101 ms (95% CI -18, 185). Intra- and inter examination Bland-Altman lower and upper limits of agreement for renal medulla were -160 ms (95% CI -222, -98), 100 ms (95% CI 38, 162), and -112 ms (95% CI -173, -51), 72 ms (95% CI 11, 133).
Discussion
Renal native T1-mapping is a promising reproducible technique that could be used for renal tissue characterization. Found intra- and inter-examination ICCs of 0.77 and 0.65 for renal cortex, and 0.86 and 0.99 for renal medulla indicate good reproducibility. Bland-Altman analysis showed good agreement for both intra- and inter-examination measurements. More studies are needed to assess the reproducibility of renal T1 mapping at different imaging centers with various MRI scanner manufacturers, in order to compare current measurements to other centers and to establish normal reference values. Possible clinical applications of renal native T1-mapping could be kidney transplant monitoring, evaluation of drug-treatment effects, and ultimately renal native T1-mapping could be used as a non-invasive diagnostic tool replacing renal biopsies.Acknowledgements
No acknowledgement found.References
1. Hueper K, Peperhove M, Rong S, Gerstenberg J, Mengel M, Meier M, et al. T1-mapping for assessment of ischemia-induced acute kidney injury and prediction of chronic kidney disease in mice. European radiology. 2014;24(9):2252-60.
2. Hueper K, Hensen B, Gutberlet M, Chen R, Hartung D, Barrmeyer A, et al. Kidney Transplantation: Multiparametric Functional Magnetic Resonance Imaging for Assessment of Renal Allograft Pathophysiology in Mice. Investigative Radiology. 2016;51(1):58-65.
3. Tewes S, Gueler F, Chen R, Gutberlet M, Jang M-S, Meier M, et al. Functional MRI for characterization of renal perfusion impairment and edema formation due to acute kidney injury in different mouse strains. PLOS ONE. 2017;12(3):e0173248.
4. Friedli I, Crowe LA, Berchtold L, Moll S, Hadaya K, de Perrot T, et al. New Magnetic Resonance Imaging Index for Renal Fibrosis Assessment: A Comparison between Diffusion-Weighted Imaging and T1 Mapping with Histological Validation. Scientific reports. 2016;6:30088.
5. Peperhove M, Vo Chieu VD, Jang MS, Gutberlet M, Hartung D, Tewes S, et al. Assessment of acute kidney injury with T1 mapping MRI following solid organ transplantation. Eur Radiol. 2017.
Figures
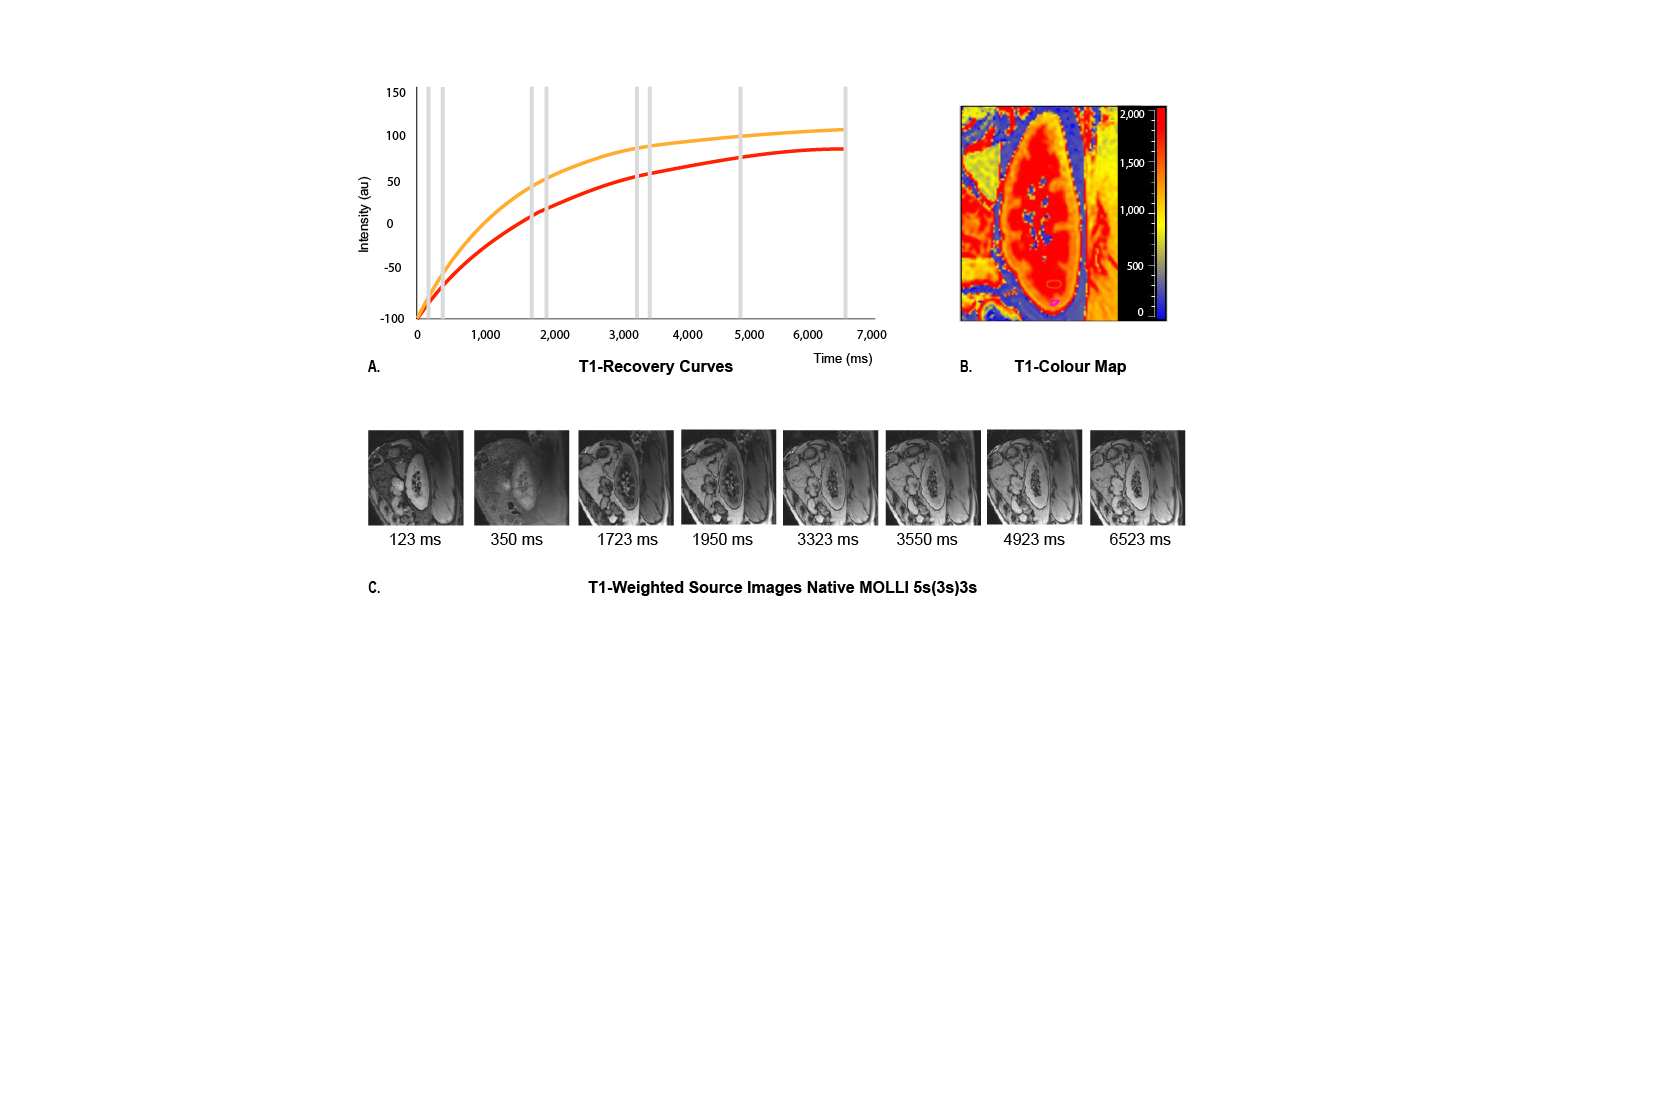
Fig. 1. Acquisition protocol of native MOLLI 5s(3s)3s. (A) Inversion recovery curves for renal cortex (orange) and medulla (red) generated from the source images, (B) Generated colour-encoded T1 map in which pixel values represent corresponding T1 relaxation times per voxel, (C) T1-weighted source images in sagittal plane taken at different times (ms) after an inversion pulse at time t=0 for MOLLI 5s(3s)3s all acquired during a single breath-hold.