2775
In vivo feasibility of T1-corrected Dual-TR Chemical Shift Encoded Fat Quantification Method1Biomedical Engineering, University of Wisconsin-Madison, Madison, WI, United States, 2Radiology, University of Wisconsin-Madison, Madison, WI, United States, 3Medical Physics, University of Wisconsin-Madison, Madison, WI, United States, 4Medicine, University of Wisconsin-Madison, Madison, WI, United States, 5Emergency Medicine, University of Wisconsin-Madison, Madison, WI, United States
Synopsis
In chemical shift encoded (CSE) fat quantification techniques, a low flip angle is most commonly used to avoid T1 bias at the expense of SNR. Alternatively, dual flip angle (DFA) acquisitions can be used for T1-corrected fat quantification, however DFA doubles the scan time. A dual TR (DTR) method is proposed where a small percentage increase of scan time allows the independent estimation of T1 of water and fat, and T1-correced fat quantification. This work demonstrates the feasibility of DTR in phantoms and liver imaging.
Introduction
Introduction
In chemical-shift-encoded (CSE) fat quantification techniques, a low flip angle is most commonly used to reduce the bias related to T1 differences between water and fat1,2,3. However, low flip angle (LFA) acquisitions result in reduced signal-to-noise ratio. Alternatively, dual flip angle (DFA)4 acquisitions can be used to estimate the T1 of water and fat and obtain T1-corrected fat quantification. Unfortunately, acquiring DFA doubles the scan time. A dual TR (DTR)5 method is proposed where a small percentage increase of scan time allows T1 mapping and T1-corrected estimation of the proton density fat fraction (PDFF). In this study, DTR-based liver fat quantification compared with the standard low flip angle (LFA) method and stimulated-echo acquisition mode (STEAM) MR spectroscopy.Methods
Acquisition,
signal model, and reconstruction of dual TR CSE-MRI:
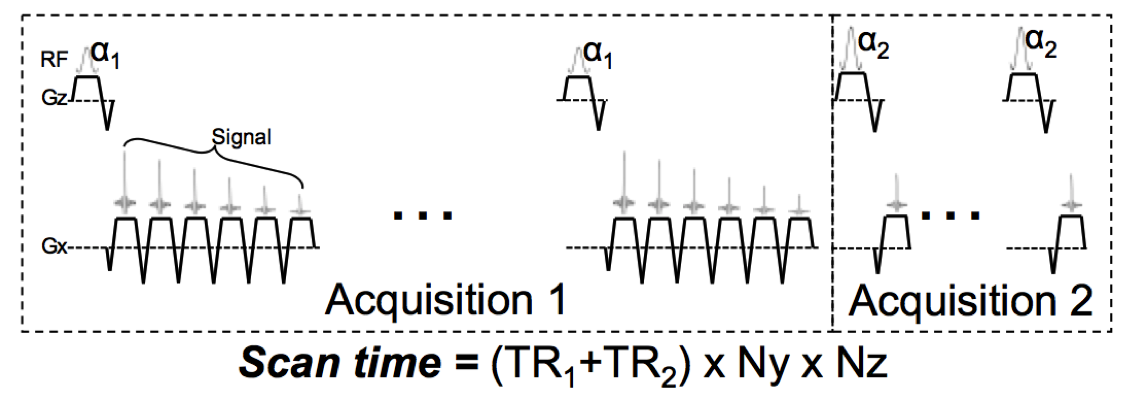
The proposed DTR method acquires 2 different SGRE
acquisitions, one with 6 echoes and a relatively long TR, one with a single
echo in each TR and a shorter TR, enabling a more rapid acquisition. The signal
acquired in DTR can be modeled as:
s(W,F,ϕ,R2^{*},ψ,T1_{F},T1_{w} ; t_{(n,m)},∝_m,TR_m ) =e^{i(2πϕ∙t_{(n,m)} )}∙e^{-R2^*∙t_{(n,m)}}∙(W\frac{ (1-e^{-TR_m/T1_w})sin(∝_m) }{(1-e^{-TR_m/T1_w}cos(∝_m))}+F\frac{ (1-e^{-TR_m/T1_f})sin(∝_m) }{(1-e^{-TR_m/T1_f}cos(∝_m))})\sum_{p=1}^P e^{i(2πΔf_p∙t_{(n,m)})}
where W and F are the water and fat proton densities, ψ is the common initial phase of water and fat, φ denotes the field inhomogeneity (Hz), TRm and αm are repetition time and flip angle of the mth acquisition, and tn,m denotes the echo time of the nth echo in the mth acquisition. The proposed DTR method estimates PDFF by performing a non-linear least-squares estimation of W and F, and subsequent estimation of PDFF corrected for T1, R2* and field inhomogeneity.
Results
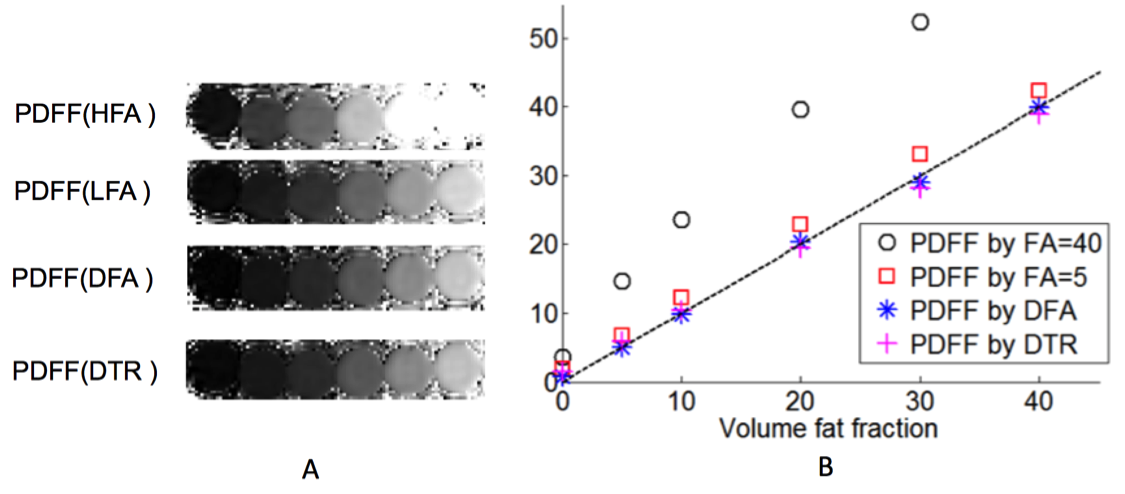
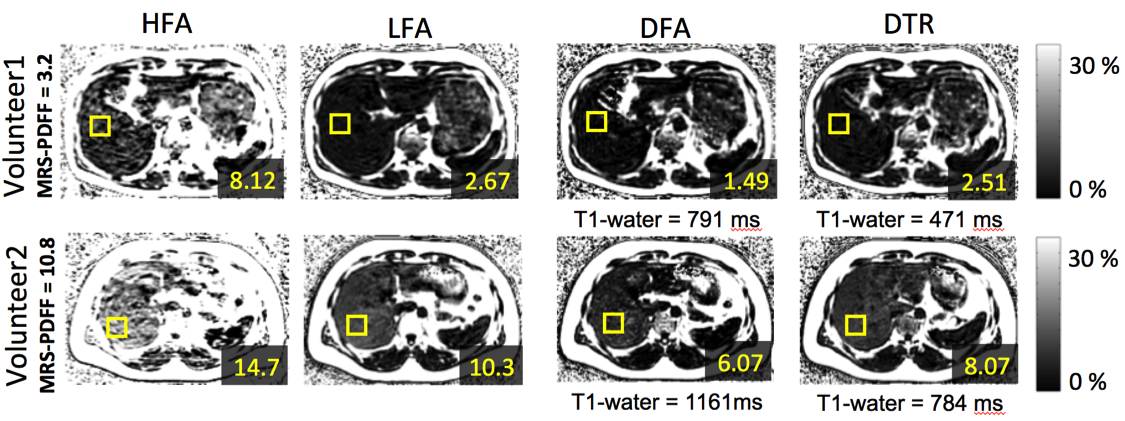
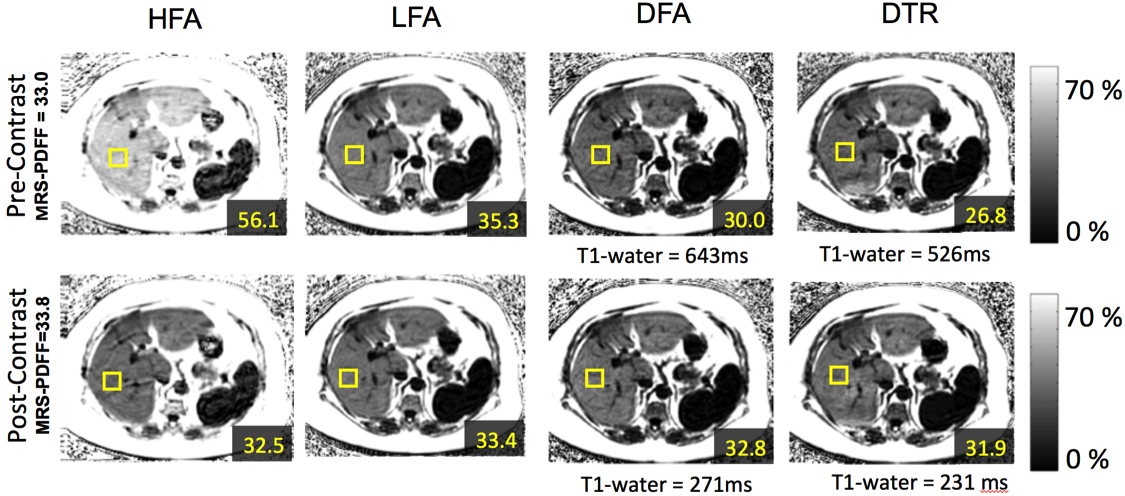
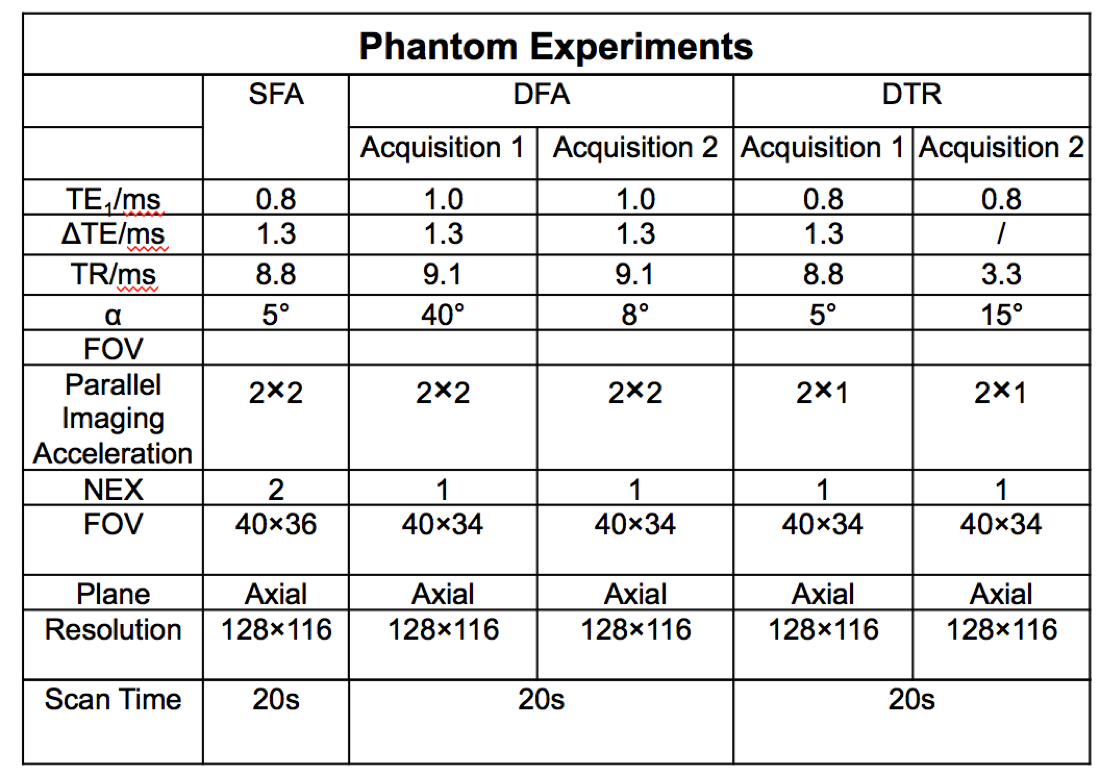
MRI experiments: CSE-MRI experiments were performed on a clinical 1.5T system, using an 8-channel torso or cardiac coil array. 3D volume multi-echo CSE SGRE data were acquired for LFA, DFA and DTR fat quantification (see acquisition parameters in Table 1). Four volumetric PDFF maps were reconstructed for each dataset: 1) SGRE of 40° flip angle (HFA) with no T1 correction, 2) 5° flip (LFA) angle with no T1 correction, 3) DFA, and 4) DTR. These acquisitions and reconstructions were performed on both phantoms and subjects, as described below. Phantom experiments were performed on a set of fat fraction phantom vials with T1 of approximately 1100ms and PDFF varying between 0% and 40%. Nominal volume fat fraction was used as a reference for PDFF measurements. In vivo experiments were performed on 4 healthy volunteers and 2 patients after IRB approval and informed written consent. In patients, the same CSE imaging sequence were performed before and 15 minutes after injection of 0.05mmol/kg of gadoxetic acid. In addition to the experiments described above, multi-echo stimulated-echo MRS (STEAM-MRS) was acquired to serve as a reference for CSE fat quantification. An ROI co-localized with reference STEAM-MRS voxel was used to estimate PDFF from the MRI PDFF maps. T1 of water was also measured from T1 maps of the water signal using a 3.5cm2-ROI positioned in the center slice of the liver avoiding obvious motion and other artifacts. Results In phantom fat quantification (Figure 2), excellent accuracy was observed with T1-corrected DTR and DFA. Single flip angle fat quantification (HFA, LFA) overestimated the PDFF. Even with the LFA acquisition there was a small degree of residual T1-related bias. In volunteer experiments (Figure 3), reasonable PDFF and T1w estimates were achieved by DFA and DTR. Although some artifacts remained in DTR fat quantification in a patient (Figure 4), plausible changes in T1w (526ms before and 231ms after contrast) were detected by this method6. For comparison, DFA resulted in higher T1 measurements: 686ms before and 271ms after contrast. Discussion T1 bias in CSE fat quantification using single flip angle can be particularly problematic in patients with conditions that lengthen the T1 of liver tissue such as fibrosis. It is clearly shown in phantom study that T1 corrected methods reduce T1 bias that exist even with low flip angles. The two T1 corrected methods, DFA and DTR, show potential for T1 corrected liver fat quantification. DTR in this study generated robust in vivo PDFF maps in most cases. Although both DFA and DTR produce T1 maps, longer T1s were generally measured in DFA compared to DTR. Further, in some cases, additional artifacts were introduced in the process of T1-corrected PDFF estimation. These artifacts could result from model mismatch between the reconstruction and data acquisition. Further work is needed to address these remaining challenges. Conclusion The proposed T1-corrected dual TR technique may be promising for applications where T1 of water is changed by pathology in liver or the presence of contrast agents.Discussion
Conclusion
Acknowledgements
No acknowledgement found.References
[1] Meisamy, et al, Radiology 2011; 258:767-775. [2] Hines, et al, JMRI 2011;33:873-881. [3] Hines, et al, Radiology 2011;258:767-775 [4] Liu, et al, MRM 2007;58:354-364. [5]Wang, et al, ISMRM 2017;p3961. [6]Park, et al, Abdom Radiol 2017;42(4):1189-1198Figures