2774
T2-based MR oximetry with background-suppressed T2-bSSFP to reduce partial volume errors13400 Spruce St, University of Pennsylvania, Philadelphia, PA, United States, 2University of Pennsylvania, Philadelphia, PA, United States
Synopsis
In small tortuous vessels in the presence of motion it is not possible to prescribe the imaging slice perpendicular to minimize the partial volume effect, which is a significant source of error in T2-based oximetry. We propose background suppression (BS) commonly used in ASL prior to T2-preparation. BS reduces SNR but can be compensated with increased slice thickness and reduced inplane resolution. We tested the method in a controlled experiment via quantification of femoral vein blood oxygenation, which has been measured extensively in our laboratory. The utility of the method is further demonstrated in human umbilical vessels in vivo.
Motivation
The accuracy of T2-based oximetry (T2Ox) is independent of the local geometry or orientation of the vessel of interest1,2. T2Ox may be the only approach for quantifying intravascular blood oxygenation level in tortuous vessels. For smaller vessels, higher in-plane resolution is necessary but will significantly reduce SNR. We propose background suppression (BS) commonly implemented in ASL protocols to allow for larger voxel size to enhance SNR while minimizing partial volume effect (PVE) that can confound T2 estimation.Methods
Background Suppression (BS)
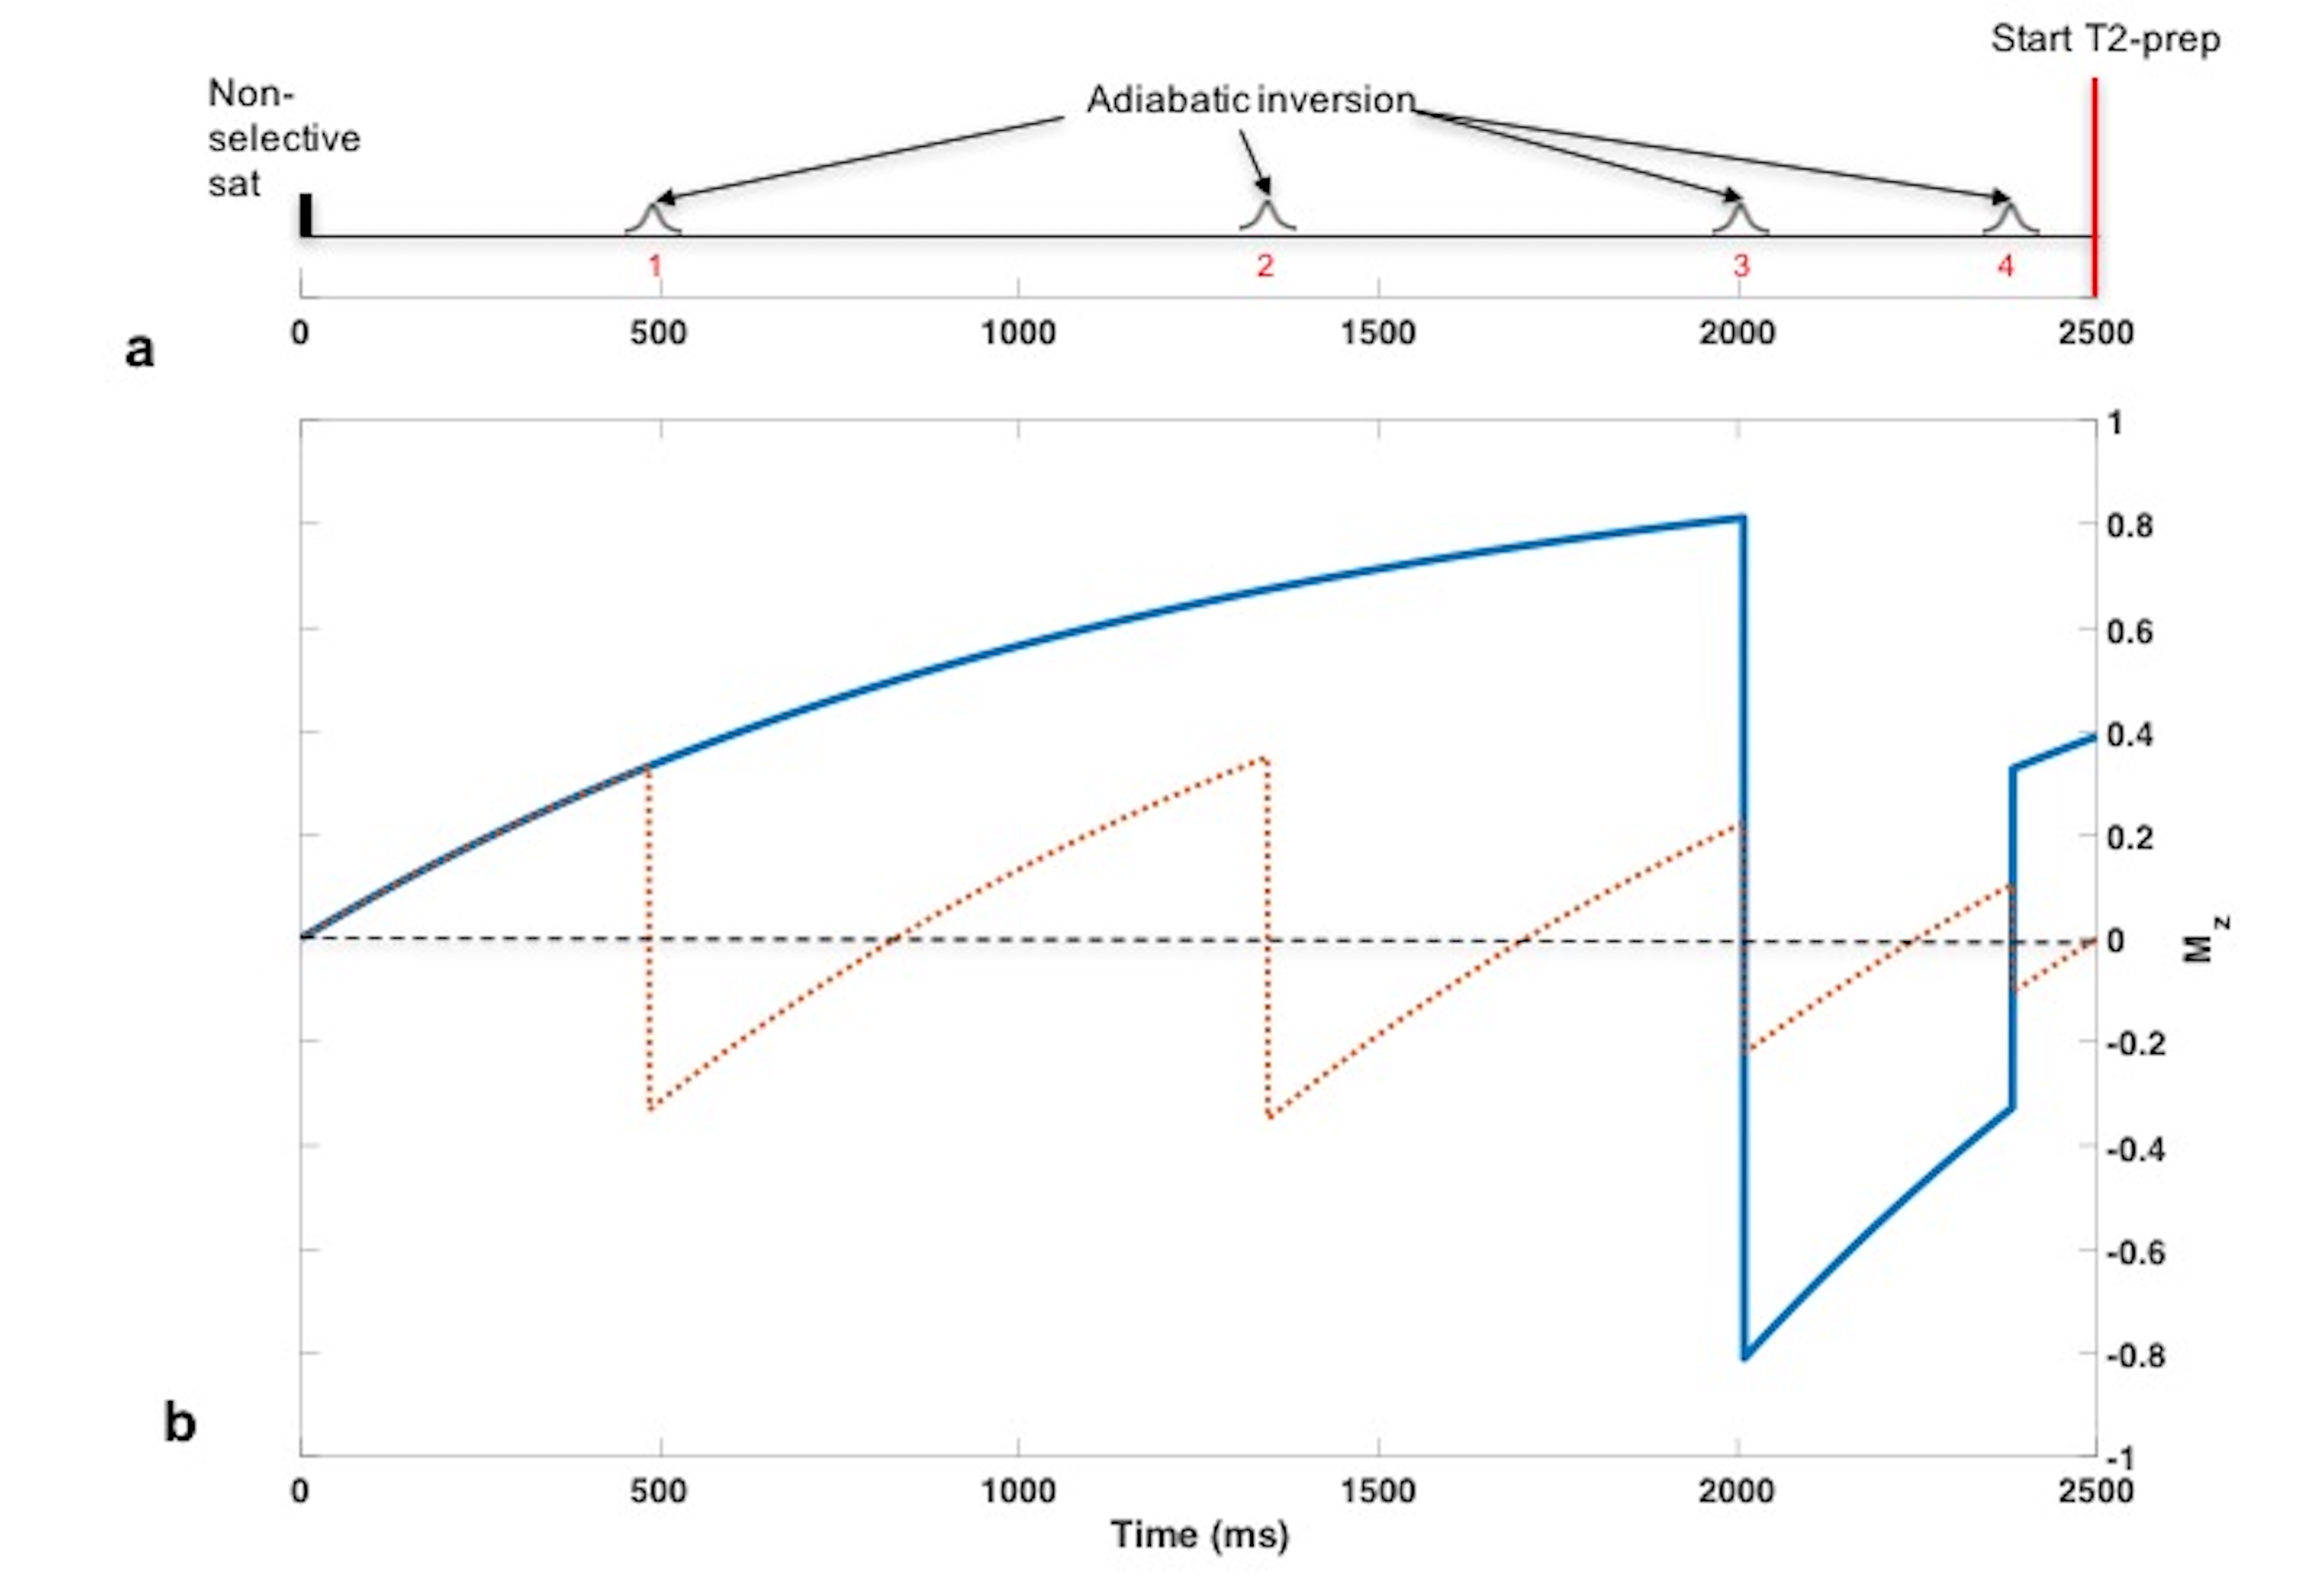
BS3 for a wide range of T1 values (250 to 4500ms) is achieved with four adiabatic inversion pulses following a saturation pulse (Fig 1a). At the imaging slice both blood and static tissue will be suppressed if the inversion pulses are non-selective (4NS). If the first two inversions are slice-selective (2SS+2NS) and coincide with the imaging slice, then the spins that flow into the imaging slice after the second SS inversion are only affected by the NS inversions. The magnetization for the blood water protons (Fig 1b) will be non-zero and T2-preparation can be applied. For saturation time of 2500ms (Fig 1a, the saturation pulse applied at t=0 ms) the inflow time is 1150ms, i.e. the time from the second SS inversion to the end of the BS module.
After the T2-preparation the acquisition of k-space center is delayed by 90ms (see below). The static tissue magnetization will relax and the BS will be sub-optimal. To improve BS, at the cost of increased acquisition time, interleaved images between 2SS+2NS and 4NS inversion modules at each T2-prep or TE are subtracted.
T2-prepared bSSFP (T2-bSSFP)
T2-preparation, bSSFP, and T2 estimation
Following the BS module T2-preparation is initiated with a 90o RECT excitation pulse, followed by MLEV-4 type refocusing pulses4 (τ180 =12ms), and composite tip-up (270x360-x). Duration of MLEV-4 cycle is 48ms and comprises four composite refocusing pulses each consisting of 90x-180y-90x RECT pulse triplet separated by 150µsec. The amplitude of all RECT pulses is fixed5 and the duration is 500µsec/90o. Pulse sequence parameters: slice thickness 8mm, TE/TR=1.8/3.6ms, flip angle 60o, in-plane resolution 1.5mm. The sequence uses half-Fourier sampling with linear ramp-up signal stabilization and 14 reference lines for reconstruction phase correction. Consequently, the static tissue magnetization will have 90ms to build up signal and potentially contaminate the blood signal by the time the k-space center is traversed on 25th pulse cycle.
T2 is estimated by fitting the average ROI pixel intensities from each of the five images to a three-parameter equation6, Ae-Bt+C. Corrected TEs are used to reduce the error associated with T1 decay between RECT pulses7.
In vivo studies: T2-bSSFP vs Background Suppression T2-bSSFP
All studies were performed on a 1.5T system (Siemens Avanto).
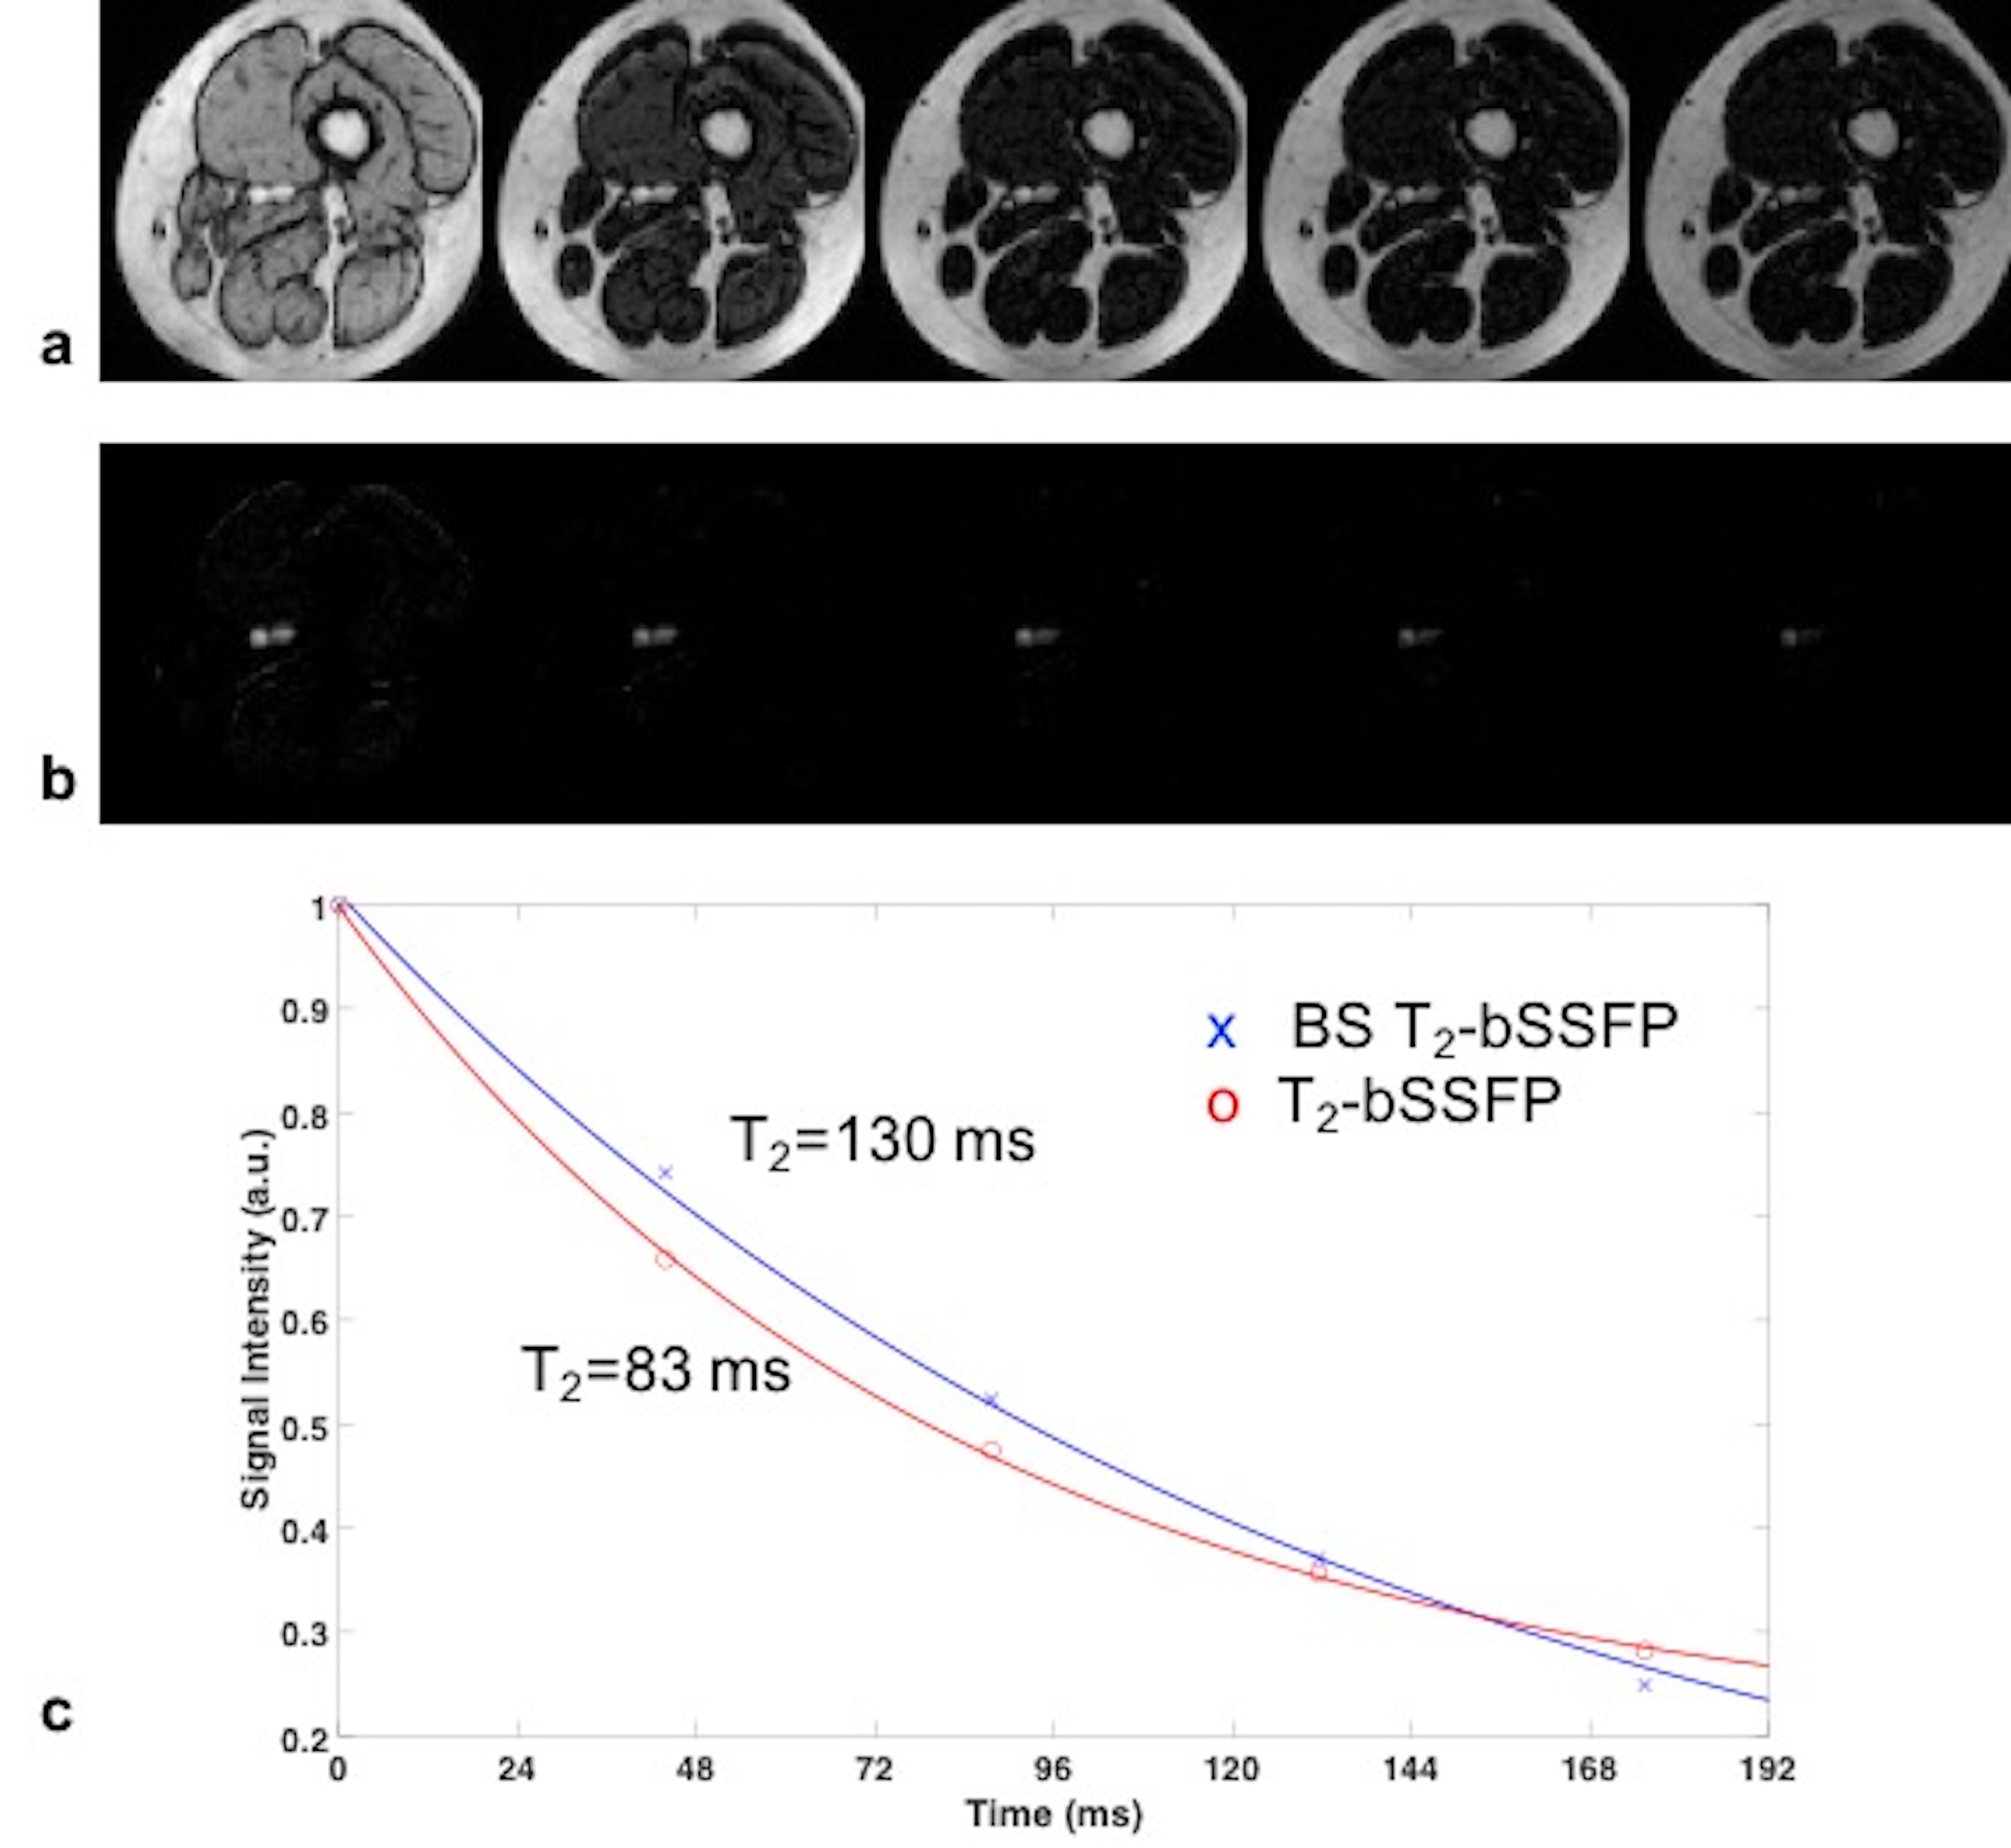
Superficial femoral vein: Blood T2 of superficial femoral vein (SFV) of a 29-year-old female (Hct=0.39) was quantified with T2-bSSFP and BS T2-bSSFP. The imaging slice was prescribed axially (imaging plane perpendicular to the z-axis) and perpendicular to the vein to assess PVE. SFV was chosen because the vessel tilt with respect to the main field is typically 20o and the blood flow is steady and low (~2 cm/s).
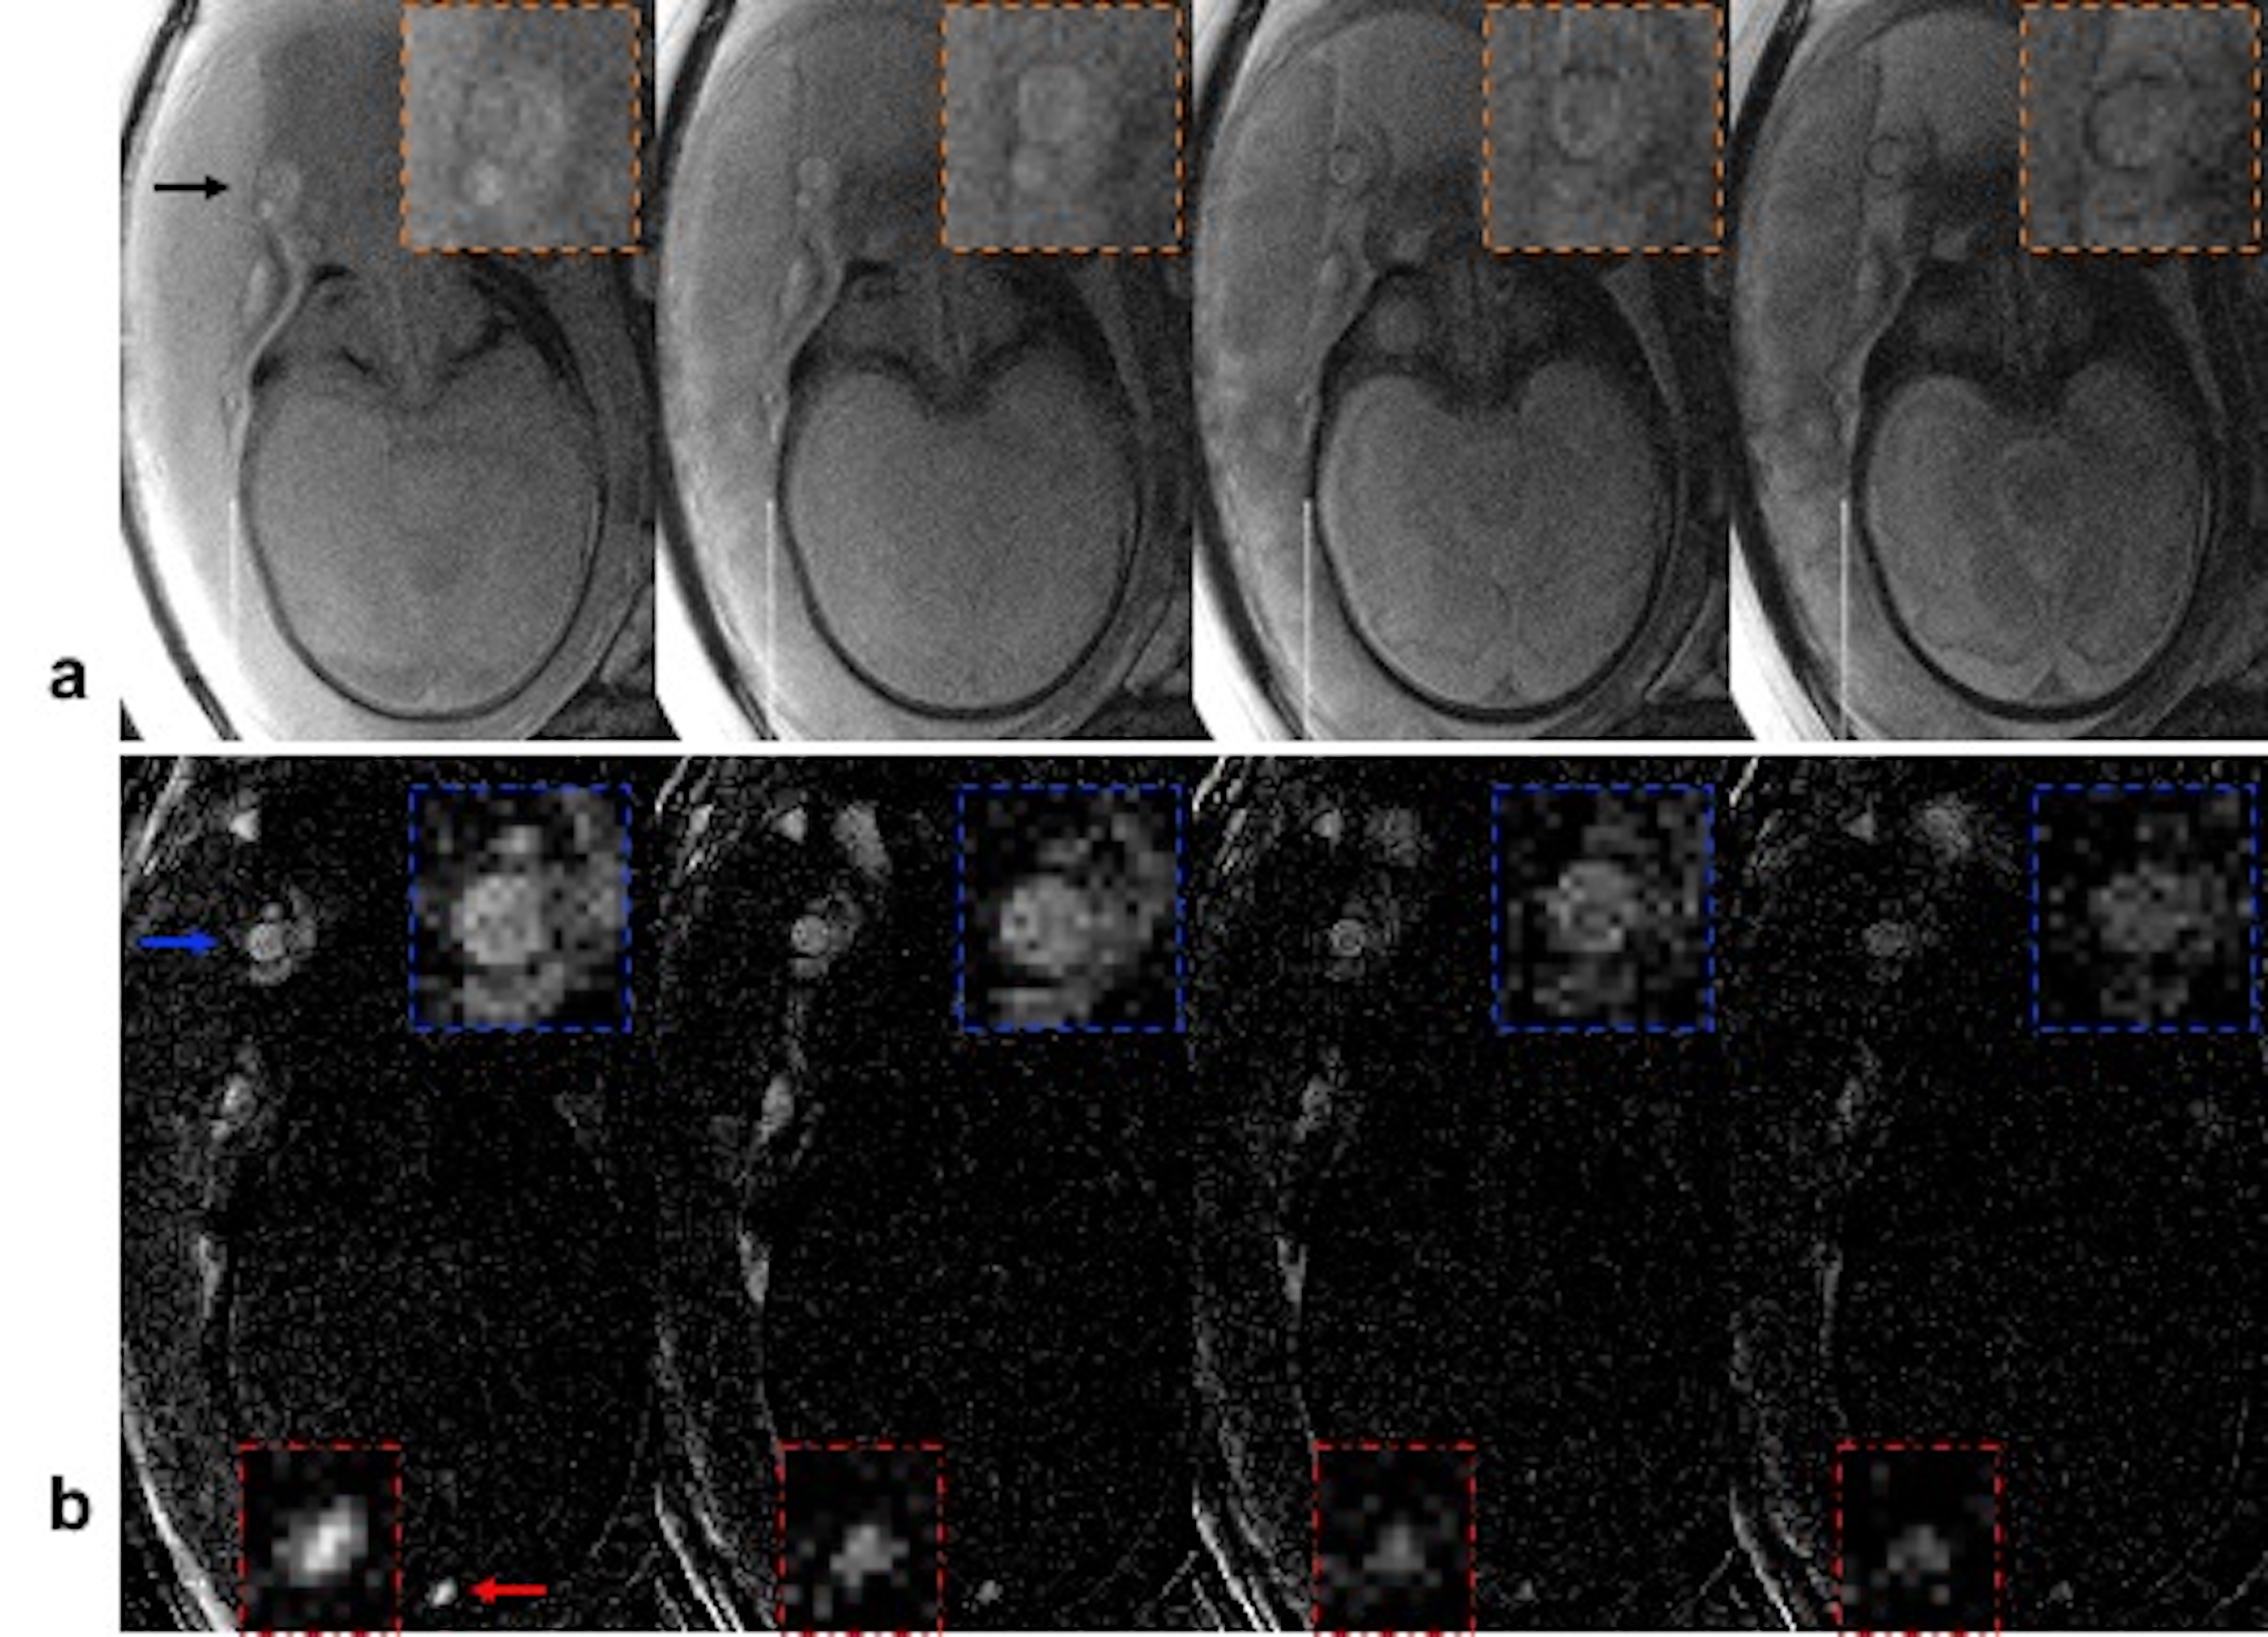
Umbilical vessels (UV): Images of UV were acquired with T2-bSSFP and BS T2-bSSFP for comparison with a combination of cardiac and spine coils in pregnancy as an add-on protocol to an existing study8. The gestational age of the fetus was 32 weeks and the normal fetal blood Hct (0.5)9 was chosen for converting T2 to HbO2.
Results
Superficial femoral vein: T2-bSSFP vs BS T2-bSSFP
Exemplary axial images of the SFV acquired with T2-bSSFP (Fig 2a) and BS T2-bSSFP (Fig 2b) shown at the same window level demonstrate excellent static tissue suppression. Fig 2c shows a T2 fit based on the images of Figs 2a, b.
Umbilical vessels
Coronal images of the fetus acquired with T2-bSSFP (Fig 3a) and BS T2-bSSFP (Fig 3b) demonstrate potential of BS for quantifying T2 in the umbilical vein (the major conduit of oxygen supply to the fetus). Also, BS enables better visualization of the fetus’ superior sagittal sinus (Fig 3b). The T2 values of fetal blood were converted to %HbO2 based on recent calibration experiments performed in our laboratory10; see Fig 3 caption.
Conclusions
The likely source leading to under- and overestimation of HbO2 in SFV and umbilical vein T2, respectively, is the PVE. It is not always possible to reduce the voxel size or image the vessel perpendicular to the blood flow direction. BS allows better visualization of the vessels of interest and should improve measurement accuracy by avoiding PVE. Further investigation is warranted.Acknowledgements
NIH Grants K25 HL111422, U01 HD087180 and UL1TR001878 supported this work.References
[1] Wright et al, JMRI 1991; [2] Luz et al, J Chem Phys 1963; [3] Maleki et al, MR Mater Phy 2012; [4] Levitt et al, JMR 1981; [5] Langham et al, MRM 2017; [6] Akcakaya et al, MRM 2015; [7] Foltz et al, MRM 1997; [8] Rodríguez-Soto et al, ISMRM 2016; [9] Gregory IC, J Physiol 1974. [10] Rodríguez-Soto et al, MRM In Press. [11] Patz et al, JMRI 2007.Figures