2771
The change in R2* with PDFF in liver can be explained by the water/fat susceptibility difference1Aix Marseille University, Marseille, France, 2University of California San Diego, San Diego, CA, United States
Synopsis
Proton density fat fraction (PDFF) measurements can be confounded by small effects that are not properly accounted for in modeling. This abstract seeks to understand the empirically observed correlation between R2* and PDFF in terms of the susceptibility difference between water and fat. Numerical fitted values were found to be close to literature values for triglyceride unsaturation and magnetic susceptibility in liver.
Introduction
There are several parameters involved in proton density fat fraction (PDFF) quantification: a scaling term, R2* and B0 inhomogeneity, as well as PDFF. There are also parameters that are the same for all pixels and may be expected to be constant within a data set: chemical shift frequency difference between H2O and CH2, fat spectrum and noise bias. Then there are functional forms to characterize the decay as exponential, biexponential or non-exponential.
Neglecting one or more parameters can lead to a confounded estimate of PDFF, in the sense that a measure designed to assess a particular construct inadvertently measures something else as well. A simple example is 2-point Dixon using in-phase (IP) and opposed-phase (OP) images, which neglects R2* and thereby measures the following quantity [1].
PDFF (2-pt) = (IP – OP) / 2 IP ≈ PDFF – R2* (0.5 / PDFF – 1) ΔTE
A pragmatic way to identify confounders is to look for significant relationships where none should exist, e.g. by measuring PDFF before/after administration of a contrast agent [2,3] or by measuring correlation between PDFF and imaging parameters [4,5]. In the past few years, several sources of systematic error have been observed and resolved by including refinements in numerical models.
However, several recent studies note a
non-negligible correlation between PDFF and R2* in liver [6,7,8]. In order to understand this effect, the present study has modeled the signal versus echo time
from spoiled gradient echo (SPGR) images for a
large number of subjects. Full details can be found in Ref [9] but the present
abstract focuses only on R2* for the purpose of understanding the influence of PDFF
on R2*.
Modeling
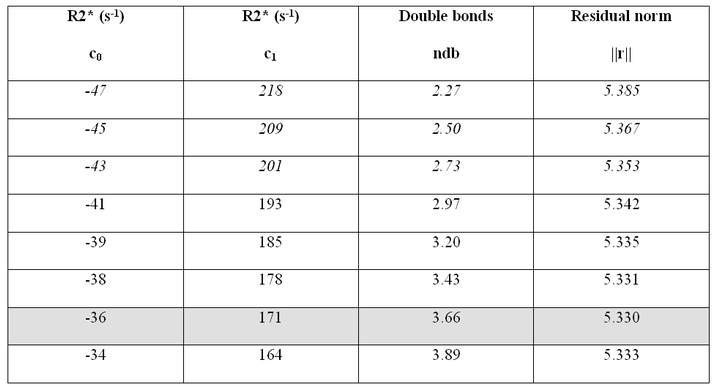
The model includes a PDFF and R2* parameter for each subject and also 7 global parameters: multi-peak fat spectrum, non-exponential decay (Gaussian), bi-exponential decay, degree of fat saturation, water frequency shift and noise bias. Bi-exponential decay was modeled using a global difference in R2* between water and fat
ΔR2* = R2*(water) – R2*(fat) = c0 + c1 PDFF
with constant and linear terms, respectively, modeling systematic differences in R2* (e.g. due to T2 or chemical heterogeneity) and susceptibility-induced dephasing caused by a difference in the magnetic susceptibilities. Under the static dephasing regime, a spherical dipole (fat droplet) embedded in a substrate (water) would give rise to a change in R2* that depends on Δχ and the volume fraction (η) of the fat droplet [10]:
ΔR2* ~ (2π/9√3) γB0 Δχ η ~ c1 PDFF
The substitution of η by PDFF is reasonable since the densities and proton to mass ratios for fat and water are similar [11]. Taking the susceptibility difference Δχ = 0.65–0.75 ppm from in vivo measurements in muscle and marrow [12] yields an estimate of 210–243 s-1 for c1.
Methods & Results
Scanning was performed at 3.0T on a GE HDx scanner using an 8-element torso coil, 2D SPGR, flip angle 10, repetition time 100–240 ms, field of view 40-44 cm, matrix 192, bandwidth 142 kHz and slice thickness 8 mm. A fractional echo factor of 0.8 was necessary to attain minimum TEs of 1.1–1.3 ms and TE spacing of 1.1–1.2 ms in a single bipolar echo-train.
A total of 463 subjects were scanned: 379 with 6 echoes and 84 with 16 echoes. The modeling procedure minimized the sum of squares residual over 3618 data points with respect to 1396 free parameters (1389 subject-specific and 7 global). Computation took 2 hours in MATLAB 2016a (Levenberg Marquardt, tolerance 10-10).
Fitting results are shown in Figures 1 and 2.
Discussion
Liver PDFF measurements exhibit correlation with R2* that can be modeled as a bi-exponential decay. The fitted ΔR2* parameters have opposite signs and therefore tend to cancel out at low to moderate PDFFs, which means the usual assumption of monoexponential R2* can be a good approximation.
The constant term indicates that R2*(fat) > R2*(water) in liver, i.e. fat peaks have a broader linewidth than water by approximately 15 Hz. The linear term indicates that the presence of fat increases R2* in the water component, which can be understood in terms of susceptibility-induced dephasing due to the difference in magnetic susceptibility.
Previous studies have reported a positive correlation between R2* and PDFF. After removing the effect of susceptibility dephasing, however, the correlation becomes negative. This depends strongly on c0 and c1 and, by artificially reducing their values by a factor of 3, the correlation can be removed entirely (slope of 0). It would be appealing in the sense of Ref [13] to remove the effect of susceptibility dephasing from R2* although it is not presently clear whether correlation between PDFF and R2* is real or artefactual.
Acknowledgements
No acknowledgement found.References
[1] Bydder M, Yokoo T, Hamilton G, Middleton MS, Chavez AD, Schwimmer JB, Lavine JE, Sirlin CB. Relaxation effects in the quantification of fat using gradient echo imaging. Magn Reson Imaging 2008; 26: 347
[2] Takeshi Yokoo, Julie M. Collins, Robert F. Hanna, Mark Bydder, Michael S. Middleton, Claude B. Sirlin. Effects of intravenous gadolinium administration and flip angle on the assessment of liver fat signal fraction with opposed-phase and in-phase imaging. J Magn Reson Med 2008; 28: 246
[3] Liau J. Shiehmorteza M, Girard OM, Sirlin CB, Bydder M. Evaluation of MRI fat fraction in the liver and spine pre and post SPIO infusion. Magnetic Resonance Imaging. 2013; 31:1012
[4] Hansen KH, Schroeder ME, Hamilton G, Sirlin CB, Bydder M. Robustness of fat quantification using chemical shift imaging. Magn Reson Imaging. 2012;30:151
[5] Levin YS, Yokoo T, Wolfson T, Gamst AC, Collins J, Achmad EA, Hamilton G, Middleton MS, Loomba R, Sirlin CB. The effect of echo-sampling strategy on the accuracy of out-of-phase and in-phase multi-echo gradient-echo magnetic resonance imaging hepatic fat fraction estimation. 2014; 39: 567
[6] Lee JT, Liau J, Murphy P, Schroeder ME, Sirlin CB, Bydder M. Cross-sectional investigation of correlation between hepatic steatosis and IVIM perfusion on MR imaging. Magn Reson Imag 2012; 30: 572
[7] Hernando D, Haufe WM, Hooker CA, Schlein A, Wolfson T, Artz NS, Reeder SB, Sirlin CB. Relationship between liver proton density fat fraction and R2* in the absence of iron overload. Proc ISMRM 2015:4118
[8] Mamidipalli A, Hamilton G, Manning P, Hong CW, Park CC, Wolfson T, Hooker J, Heba E, Schlein A, Gamst AM, Durelle J, Paiz M, Middleton MS, Schwimmer JB, Sirlin CB. Cross-Sectional Correlation Between Hepatic R2* and Proton Density Fat Fraction (PDFF) in Children With Hepatic Steatosis. J Magn Reson Imaging (In Press, 2017)
[9] Mark Bydder, Gavin Hamilton, Ludovic de Rochefort, Ajinkya Desai, Elhamy R Heba, Rohit Loomba, Jeffrey B Schwimmer, Nikolaus M. Szeverenyi, Claude B Sirlin. Sources of Systematic Error in Proton Density Fat Fraction (PDFF) Quantification in the Liver Evaluated From Magnitude Images With Different Numbers of Echoes (In Press, 2017)
[10] Haacke EM, Brown RW, Thompson MR, Venkatesan R. Magnetic Resonance Imaging: Physical Principles and Sequence Design: John Wiley & Sons; 1999, pp. 614 (Eq. 20.85)
[11] Reeder SB, Hu HH, Sirlin CB. Proton density fat-fraction: a standardized MR-based biomarker of tissue fat concentration. J Magn Reson Imaging. 2012;36:1011
[12] de Rochefort L, Brown R, Prince MR, Wang Y. Quantitative MR Susceptibility Mapping Using Piece-Wise Constant Regularized Inversion of the Magnetic Field. Magn Reson Med 2008; 60: 1003
[13] Hernando D, Vigen K, Shimakawa A, Reeder S. R2* mapping in the presence of macroscopic B0 field variations. Magn Reson Med 2012; 68: 830
Figures
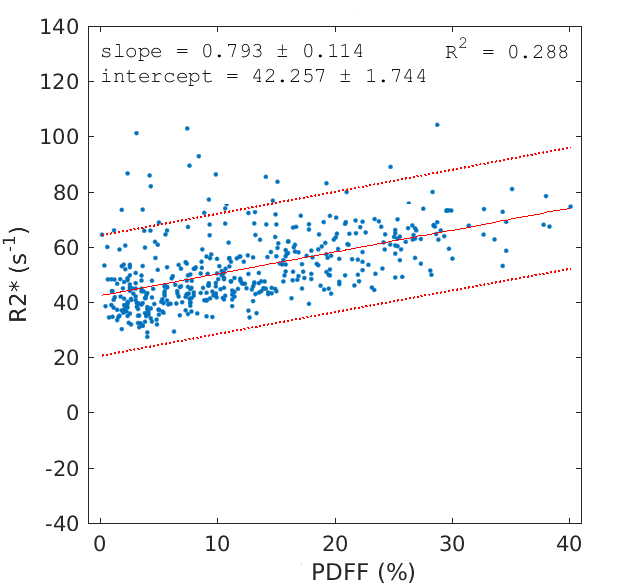
Plot of R2* versus PDFF in 463 subjects. As noted in the text, the
positive correlation is within the range that can be explained by the magnetic susceptibility difference between water and fat. The parameters c0 and c1 have a strong influence on the correlation and the slope can be made zero or negative for certain parameter values.