2770
Analytical Characterization of Statistical Bias in Multi-Point Apparent Diffusion Coefficient (ADC) Measurements: Application to Prostate Cancer Imaging1Mayo Clinic, Rochester, MN, United States
Synopsis
In most diffusion studies, two or more DW images are acquired and an apparent diffusion coefficient (ADC) map is generated, with the goal of providing quantitative diffusion information that is independent of acquisition settings or secondary tissues properties. However, ADC values can vary significantly following protocol changes. In this work, we analytically determine the statistical bias in ADC maps generated from multi-point DWI acquisitions, and show how the derived model rationalizes noise-based error propagation as the source of ADC inconsistencies observed in our own clinical practice.
Purpose
Diffusion-weighted imaging (DWI)1 is widely used for studying ischemia, and increasingly as a biomarker of elevated tissue cellularity2,3. For prostate
cancer (PCa), DWI-derived information is a primary determinant of lesion scoring under PI-RADSv24. Typically, several differently parameterized DW
images are acquired within a series, and a single apparent diffusion coefficient (ADC) map is derived. ADC maps aim to provide quantitative diffusion
information that is independent of acquisition settings and/or secondary tissues properties (e.g., T2). However, ADC values can vary significantly
following even modest protocol changes5-8. While it is broadly accepted that such variations are due to noise-based model fitting errors, rigorous
mathematical investigation of this phenomenon has been limited – only Saritas et al.9 have analytically characterized ADC map noise, for the specific case
of monodirectional two b-value acquisitions. Here, we generalize those results for multi-point ($$$\geq2$$$ b-values) acquisitions – commonly used for prostate
MRI – and derive a closed-form expression for statistical bias in ADC maps generated using the conventional fitting strategy. Following theory
development, we highlight a clinical prostate case where different multi-point DWI acquisitions executed serially yielded different ADC values, and show
how the derived model explains these differences.Purpose
Theory
Theory
For brevity, we herein focus on isotropic diffusion. In a DWI exam that generates $$$T$$$ images, the complex-valued signal at any voxel is modeled as
$$f_{t}=me^{-j\phi_{t}}e^{-TE/T2}e^{-b_{t}ADC}+n_{t}~[EQ1]$$
where $$$m$$$ is background signal, $$$\phi_{t}$$$ is image-dependent phase, $$$b_{t}$$$ is the b-value, and $$$n_{t}$$$ is zero-mean Gaussian noise. As DWI often varies the number of excitations (NEX) with b-value, the per-channel variance of is $$$\sigma_{t}=NEX_{t}\sigma_{0}^{2}$$$. ADC values are typically estimated via linear-least-squares fitting of logarithms of magnitudes of DWIs; specifically,
$$\hat{ADC}=\delta_{2}^{T}\left[ \begin{array}{cc}1&-b_{1}\\\vdots&\vdots\\ 1&-b_{T}\end{array}\right]^{\dagger}\left[\begin{array}{c}\ln|f_{1}|\\\vdots\\\ln|f_{T}|\end{array} \right]~[EQ2]$$
where $$$\delta_{2}^{T}=[0;1]^{T}$$$ and $$$\dagger$$$ denotes the pseudo-inverse. It is readily shown that the bias of this method-of-moments estimator is
$$\mathbb{BIAS}\left[\hat{ADC}\right] =\mathbb{E}\left[\hat{ADC}\right]-ADC=\delta_{2}^{T}\left[ \begin{array}{cc}1&-b_{1}\\\vdots&\vdots\\ 1&-b_{T}\end{array}\right]^{\dagger}\left[\begin{array}{c}\mathbb{E}[\ln|f_{1}|]-\ln|\mathbb{E}[f_{1}]|\\\vdots\\\mathbb{E}[\ln|f_{T}|]-\ln|\mathbb{E}[f_{T}]|\end{array} \right]~[EQ3]$$
Denoting $$$SNR=m/(\sqrt{2}\sigma_{0})$$$, the expected value ($$$\mathbb{E}[\cdot]$$$) of the log-Rician distributed quantity $$$\ln|f_{t}|$$$ is:
$$\mathbb{E}[\ln|f_{t}|]-\ln|\mathbb{E}[f_{t}]|=-\frac{1}{2}Ei\left(-NEX_{t}^{-1}\left(SNR~e^{-TE/T2}e^{-b_{t}ADC}\right)^{2}\right)~[EQ4]$$
where $$$Ei(\cdot)$$$ is the exponential integral11,9. Using this identity, and after considerable simplification, it follows that:
$$\mathbb{BIAS}\left[\hat{ADC}\right]=\frac{\sum_{t=1}^{T}Ei\left(-NEX_{t}^{-1}\left(SNR~e^{-TE/T2}e^{-b_{t}ADC}\right)^{2}\right)\left(b_{t}{T}-\sum_{s=1}^{T}b_{s}\right)}{2\left(T\left(\sum_{t=1}^{T}b_{t}^{2}\right)-\left(\sum_{t=1}^{T}b_{t}\right)^{2}\right)}~[EQ5]$$
This generalized model enables prediction of shifts in ADC values under multi-point DWI protocol changes, as well as retrospective corroboration that observed ADC shifts are likely due to statistical artifact. The result derived in [REF9] is a special case of our result in EQ5.
Methods
A patient with suspected PCa was sequentially imaged on a GE 3T Discovery 750W using a three-point reduced field-of-view (axial-oblique;22x11cm) DWI
sequence (matrix=144x72; ASSET=2; slices=16x4mm; coil=GEM+ERC). For the first protocol (P1), TR/TE=3700/82.8ms, b=[100;1000;1600]s/mm2, and NEX=
[5;16;16]; and for the second protocol (P2), TR/TE=4050/69.3ms, b=[100;400;1000]s/mm2, and NEX=[3;5;14]. All images were reconstructed with complex
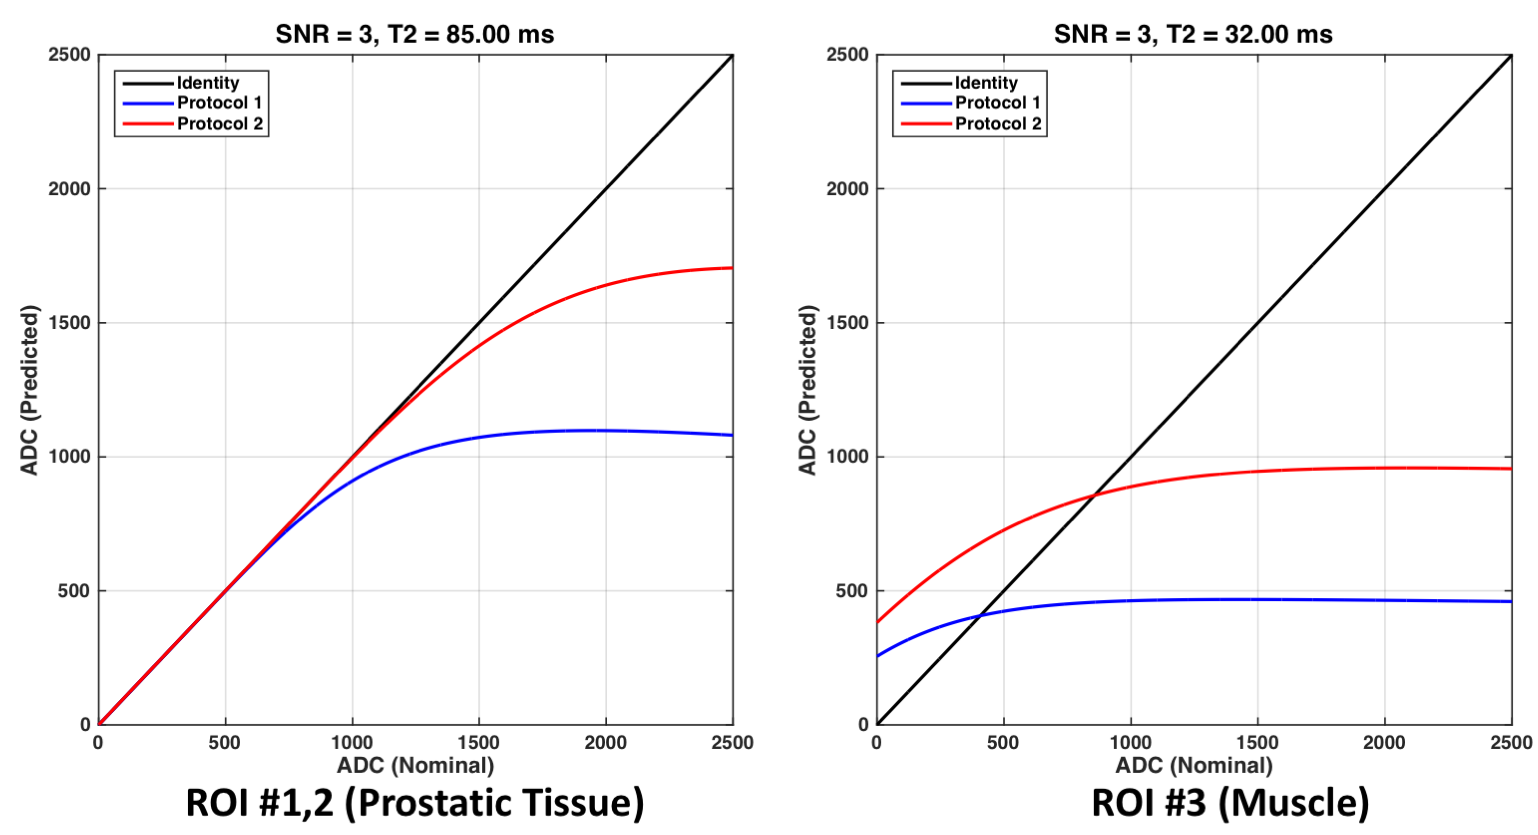
averaging12. Region-of-interests (ROIs) were drawn over two suspected restricted diffusion areas within the prostate, and surrounding muscle. T2 values of the prostatic and muscle tissue were presumed to be 85ms and 32ms, respectively13-14. The (normalized) image SNR was estimated as SNR=3. For
each ROI, a plot of the nominal versus predicted ADC values was created over the range [0;2500]mm/s. The generating ADC value was then estimated
by minimizing the Euclidean distance between the predicted (i.e., biased estimate) curves and mean ROI values from each ADC image.Methods
Results
Figure 1 shows cropped enlargements of one slice of the ADC maps generated by the applied protocols, with ROIs demarcated. Figure 2 shows plots of
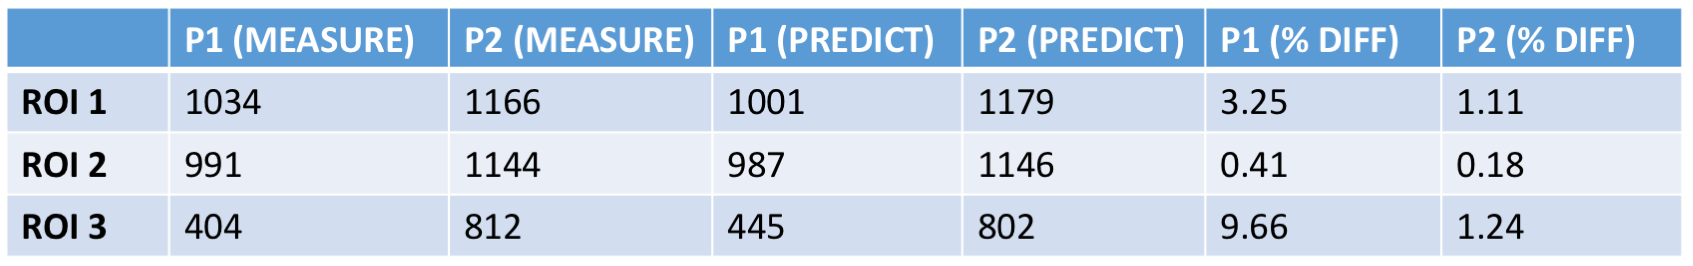
nominal versus predicted (via EQ5) ADC values for each protocol for both prostatic and muscle tissue. Figure 3 includes a table of the mean ADC values
measured in each ROI shown in Figure 1. The generating ADC values obtained for the three ROIs via Euclidean projection were: 1198, 1160, and
679mm/s. Using these values, the predicted ADC values for each ROI and protocol are also included in the table in Figure 3. The relative differences
between the measured and predicted ADC values are small (<10%), indicating that EQ5 explains the observed shift in ADC values that occurs between
the considered protocols.Results
Discussion
We derived a closed-form mathematical expression for noise-induced bias in ADC maps created from multi-point DWI sequences. This generalized bias
model can be used to predict the effects of protocol changes on ADC distributions, and guide the reassignment of diagnostic thresholds. As
demonstrated for prostate imaging, this model also enables the feasibility of noise-based error propagation as the source of ADC shift to be
interrogated. The bias analysis executed herein readily generalizes from isotropic to anisotropic diffusion, which will be investigated in future work.Discussion
Conclusion
Statistical bias in ADC maps generated from multi-point DWI via conventional fitting procedures can be exactly characterized, enabling better
understanding of existing DWI protocols and objective assessment of new ones. Conclusion
Acknowledgements
This work was supported by the Mayo Clinic Discovery Translation Program.References
[1] Stejskal EO, Tanner JE. Spin diffusion measurements: Spin echoes in the presence of a time-dependent field gradient. J Chem Phys 1965;42:288–92
[2] Zelhof B et al. Correlation of diffusion-weighted magnetic resonance data with cellularity in prostate cancer. BJU Int 2009;103:883–888
[3] Gibbs, P et al. Correlation of ADC and T2 measurements with cell density in prostate cancer at 3.0 Tesla. Inv Radiol 2009;44:572-576
[4] Weinreb JC et al. PI-RADS Prostate Imaging-Reporting and Data System:2015,Version 2. Eur Urol 2016;69:16-40 [5] Jones, DK et al. Optimal strategies for measuring diffusion in anisotropic systems by magnetic resonance imaging. MRM 1999;42:515-525
[6] Alexander DC et al. A general framework for experiment design in diffusion MRI and its application in measuring direct tissue microstructure features. MRM 2008;60:439–448
[7] Sugimura, K. Clinical utility of apparent diffusion coefficient values obtained using high bvalue when diagnosing prostate cancer using 3 Tesla MRI: Comparison between ultra-high bvalue (2000 s/mm2) and standard high b-value (1000 s/mm2). JMRI 2012;36:198–205
[8] Kim CK et al. High-b-Value Diffusion-Weighted Imaging at 3 T to Detect Prostate Cancer: Comparisons Between b Values of 1,000 and 2,000 s/mm2. AJ Roentg 2010;194:W33-W37
[9] Sariitas E et al. SNR dependence of optimal parameters for apparent diffusion coefficient measurements. IEEE TMI 2011;30:424-437
[10] Jones D. Diffusion MRI, Oxford University 2010
[11] Lapidoth A and Moser S. Capacity bounds via duality with applications to multiple-antenna systems on flat-fading channels. IEEE T Info Theory 2003;49: 2426-2467
[12] McKinnon G et al. Phase Corrected Complex Averaging for Diffusion Weighted Spine Imaging. Proc. ISMRM 2000;802.
[13] Yamauichi FL et al. Prostate cancer discrimination in the peripheral zone with a reduced field-of-view T2-mapping MRI sequence, MRI 2015;33:525-30 [
14] Gold GE et al. Musculoskeletal MRI at 3.0 T: relaxation times and image contrast. AJR 2004;183:343-31
Figures