2769
Towards measurement of normal Blood-Brain Barrier leakage in individual subjects using DCE-MRI1Department of Neuroscience, Brighton and Sussex Medical School, Brighton, United Kingdom
Synopsis
The ability to measure normal BBB leakage in individual subjects would provide a technique to quantify extremely subtle BBB abnormalities in neurological disease. The technique is extremely demanding of scanner stability and vulnerable to low-level (invisible) artefacts. In phantom and healthy control scans without Gd machine stability is good when using Ernst-angle scanning. Image artefact currently limits precision in measuring BBB permeability, and is probably caused by pulsatile motion of the Superior Sagittal Sinus (SSS). Image noise is insignificant when optimised imaging parameters (e.g. FA=30o, TR=30ms) are used. Blood signal is significant and can probably be modelled using SSS signal.
Introduction
Subtle Blood-Brain Barrier (BBB) permeability measurements could characterise invisible diffuse white matter damage in several neurological diseases. Already group changes have been reported in Mild Cognitive Impairment, dementia, multiple sclerosis and stroke (2,3,4); vasculitis, HIV and migraine are probably also associated with defective BBB’s.
Leakage in normal white matter has been
reported (Ktrans = 0.1-0.6 10-3 min-1 (1-5), with a possible age-dependence. The observed
signal changes caused by BBB leakage are small (~1%), and the technique is very
demanding of scanner performance, analysis method and our ability to quantify using MR. Here we identify the
primary sources of uncertainty, propose methods to characterise and reduce them,
and seek to optimise the measurement technique.
Aim
To measure normal BBB leakage in individual subjects.
Methods
A 3D DCE-MRI protocol was set up for good SNR without needing high temporal resolution: TR=30ms, voxel size: 1.2 x 1.2 x 3 mm, matrix 217 x 240 x 168, image acquisition time: ~ 100 s. A phantom (T1= 360ms) was repeatedly imaged to study MRI machine drift; three flip angle (FA) values (15,25,35o) were used cyclically. Healthy controls were repeatedly imaged (without Gadolinium Gd, FA=5o, 17o, 30o) for up to 40 min under various conditions of scanner heating history. Controls were also imaged after injection of 0.1 mmol/kg Gd. Human images were spatially registered using SPM software. ROI’s were placed in large regions of white matter and over the Superior Sagittal Sinus (SSS) vein. Noise in the human images was estimated by subtraction of two consecutive images.
DCE data from large white matter ROI’s were analysed using the extended Tofts model (ETM) to produce estimates of BBB transfer coefficient Ktrans and blood plasma fraction vp (6); the extracellular extravascular space ve was fixed at 15-20%. Registered and unregistered image datasets were analysed.
A simulation of signal enhancement vs FA (7) was used to
predict optimal FA values.
Results
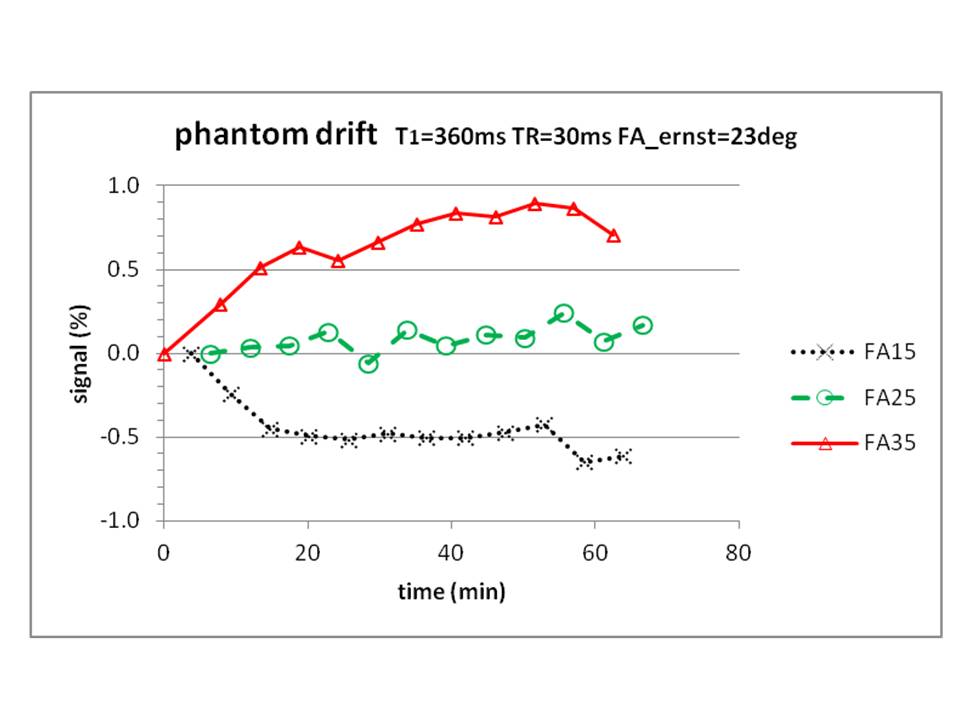
Phantom signals showed drift up to 0.9% (figure 1). Near the Ernst angle (23o), the FA=25o data were remarkably stable (maximum drift 0.25%).
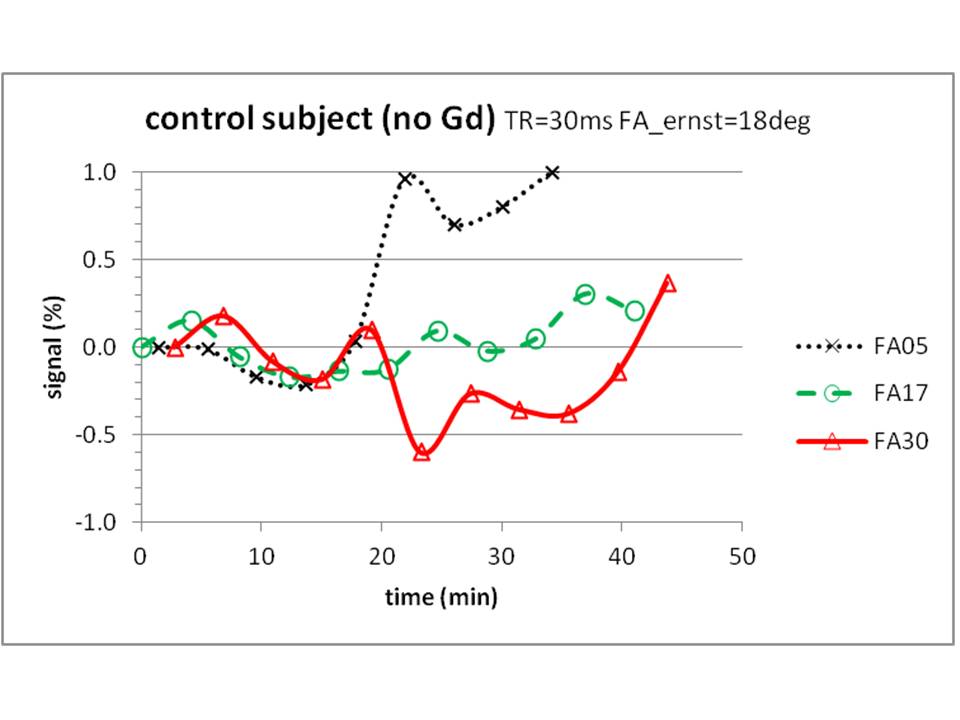
Healthy controls without Gd showed a range of drift behaviours. Least drift (<0.3% ) was shown in an evening dataset for FA=17o (near the Ernst angle); see figure 2.
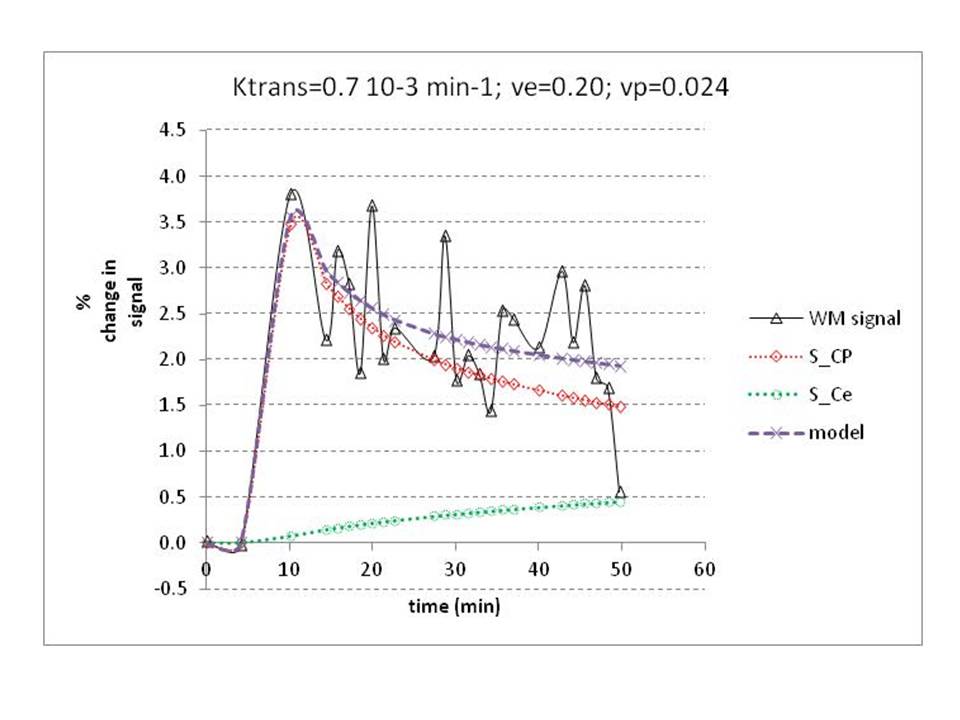
Healthy controls with Gd showed the expected enhancement curve shape; however large point-to-point random fluctuations, probably with long spatial range, were observed (figure 3): Short-TErm Long-range Fluctuations (STeLF’s).
Image noise values difference images shows noise with SD~<1.4% of mean signal; thus the noise in one image is <1.0%, and the standard error of the mean is <0.1% (for a VOI with 100 voxels).
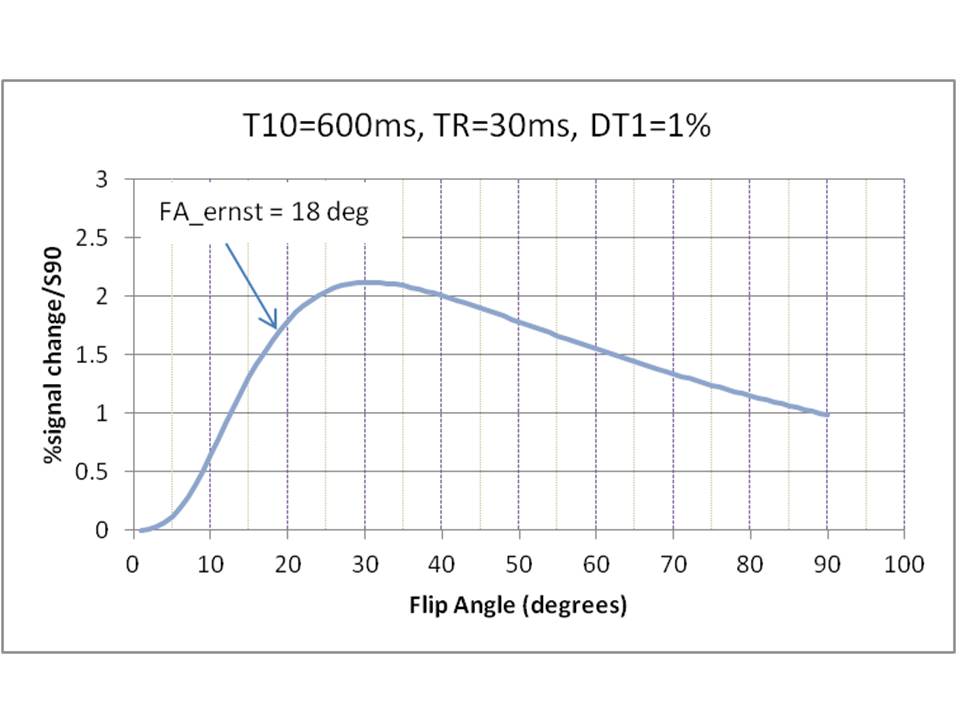
Simulation showed maximum signal sensitivity to T1 changes at FA=31o (figure 4).
Discussion
We used a long acquisition time increases the concentration of leaked Gd (figure 3). A long TR increases SNR and reduces SAR. Fixing ve improves the stability of the solution. Using the ETM allows fitting into the later part of the curve, which the Patlak model does not.
The major obstacles to measuring normal BBB leakage are the STeLF’s and scanner drift.
STeLF’s probably originate from pulsatile movement of the bright SSS. Flow compensation and saturation bands might reduce these. Registration intensity artefacts should be monitored (in non-Gd images). Drift data in phantoms (figure 1) suggest that intrinsic machine drift can be controlled to 0.2 % or better. Use of Ernst angle scanning, a cool scanner and B1+ (transmit) and B1- (receive) correction from multiple FA acquisitions might improve on this.
Temperature variations of <1oC could also produce significant drift in phantom and brain signals; temperature coefficients can be as high as 3%/oC (8). Blood concentration can probably be monitored through the SSS signal. Image noise currently does not limit the measurement.
There are few published examples of DCE curves for individual normal subjects; this is
where STeLF’s would become apparent, and the influence of drift is clear.
Conclusions
1. Four sources of uncertainty (two fast, two slow) are present in subtle BBB measurements and should be characterised. The two most important are Short-TErm Long-range Fluctuations (STeLF’s) and machine drift.
a) image noise is fast and can be made negligible by long enough TR
b) STeLF’s are also fast and are currently the dominant source in our protocol (see figure 3)
c) machine drift could be mistaken for a change in BBB leakage (figure 3)
d) uncertain blood concentration – measuring venous signal probably controls for this
2. The optimal Flip Angle is close to the Ernst angle (figure 4).
3. The ability to measure normal BBB leakage in individual subjects will open up new measurements of subtle abnormality in disease.
Acknowledgements
Paul Tofts is supported by the Centre for Dementia at BSMSReferences
1. Iannotti F et al, JCAT 1987;11:390
2. Taheri S et al, MS and Related Disorders 2013; 2:124
3. Cramer SP and Larsson HBW, JCBFM 2014; 34:1655
4. Montagne A et al, Neuron 2015; 85:296
5. Heye AK et al, Neuroimage 2016; 125:446
6. Tofts PS, Brix G et al Magn Reson Imag 1996; 14:373
7. Tofts PS, J Magn Reson Imag 1999; 10:223
8. Tofts PS p48 in Quantitative MRI of the brain 2018 eds Cercignani, Dowell
and Tofts
Figures