2768
Accurate and rapid dictionary-based T2 mapping using multi-echo turbo spin echo sequences with reduced refocusing angle1Medical Physics in Radiology, German Cancer Research Center (DKFZ), Heidelberg, Germany
Synopsis
In this work, we present a fast and accurate T2 mapping method based on standard multi-echo turbo spin echo sequences (ME-TSE) that are widely available on clinical scanners. Estimation of T2 values is done by a Bloch simulation-based algorithm. As this method can account for stimulated echoes that occur during the echo train within a TSE sequence, its use for sequences with reduced refocusing flip angle is feasible to avoid SAR problems at higher field strength.
Introduction
Quantitative magnetic resonance imaging (MRI) is still rarely used in today’s clinical practice except for diffusion MRI and relaxometry in myocardial imaging, but it can provide additional information on tissue properties1. In this work, we present a fast and accurate T2 mapping method based on a standard multi-echo turbo spin echo sequence (ME-TSE) that is widely available on clinical scanners. For higher field strength ME-TSE sequences can only be used with reduced refocusing angle due to SAR (specific absorption rate) limitations. The proposed dictionary-based method can also account for the effects of stimulated echoes that occur when using refocusing angles smaller than 180°.Methods
The relaxation of transverse magnetization $$$M_{xy}$$$ can be described using Bloch equations. In the ideal case of perfect 180° refocusing pulses, signal decay due to T2 relaxation can be modeled as $$$ M_{xy} (t) = M_0 \cdot \exp{(-\frac{t}{T_2})} $$$ . In general, the signal decay will follow a generalized echo modulation curve depending on pulse shape and refocusing angle that can be obtained by performing Bloch simulations of the actual imaging sequence2,3. The radio frequency shapes, timings and gradient schemes were read from the SIEMENS poet sequence simulation tool. Bloch simulations were performed along slice direction to account for dephasing due to non-ideal slice profile using Matlab (MathWorks, MA, USA) with an internal spatial resolution of 0.05 mm and a temporal resolution of 5$$$~$$$μs. Data was acquired with a SIEMENS Symphony fit 1.5$$$~$$$T (Siemens Healthcare, Erlangen, Germany). Imaging and simulation parameters of the multi-slice triple-echo TSE sequence were: TR = 6800$$$~$$$ms, TE = 11/142/273$$$~$$$ms, echo train length ETL = 11. In each run of the simulation, one echo modulation curve (EMC) for a specific T2 value within a range of T2 = [50,…,200]$$$~$$$ms and for different refocusing flip angles α = 120°/150°/180° was generated. Assuming that image contrast is mainly determined by the central k-space lines, only the first echo of each of the three echo trains was taken into account during the simulation4. Measured signal evolution was compared and matched to simulated EMC to find correct T2 values. Ground truth T2 data was obtained by single echo spin echo (SE) imaging with three different echo times and mono-exponential fitting of the data. The method was validated ex vivo with an agarose gel phantom with different T2 values similar to those in the human brain. In vivo measurements of the human brain were conducted in accordance with the declaration of Helsinki.Results
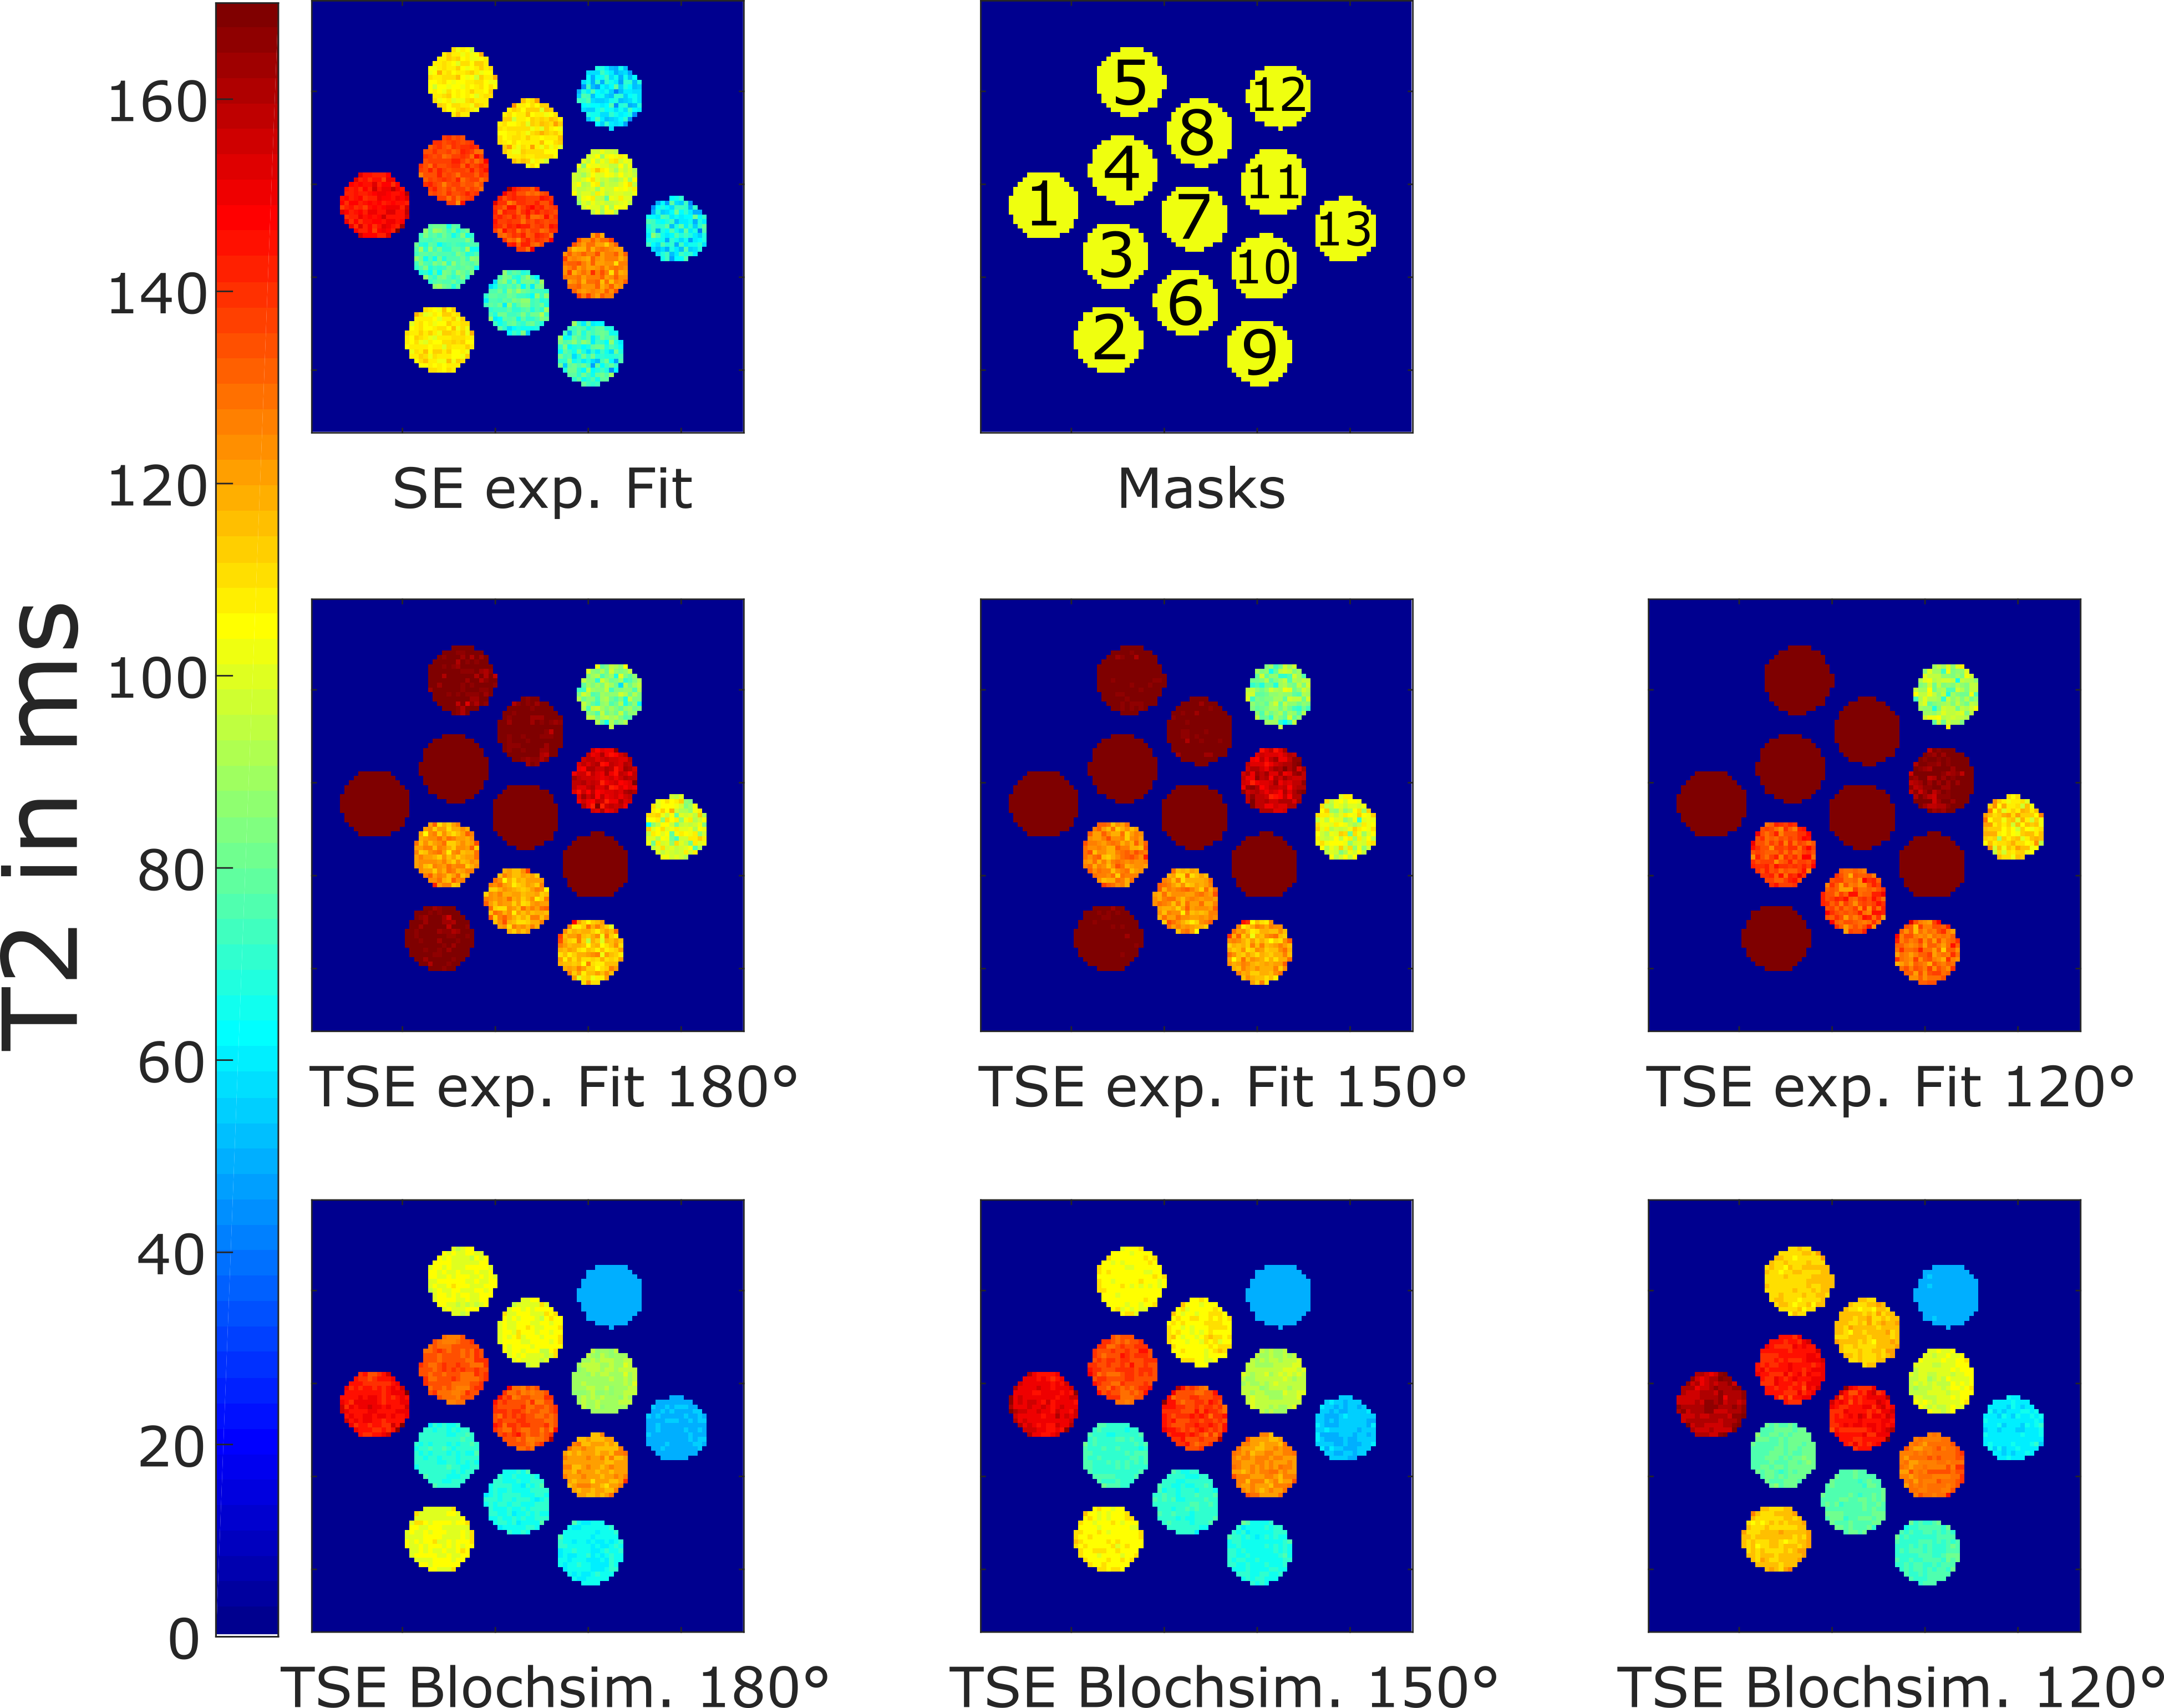
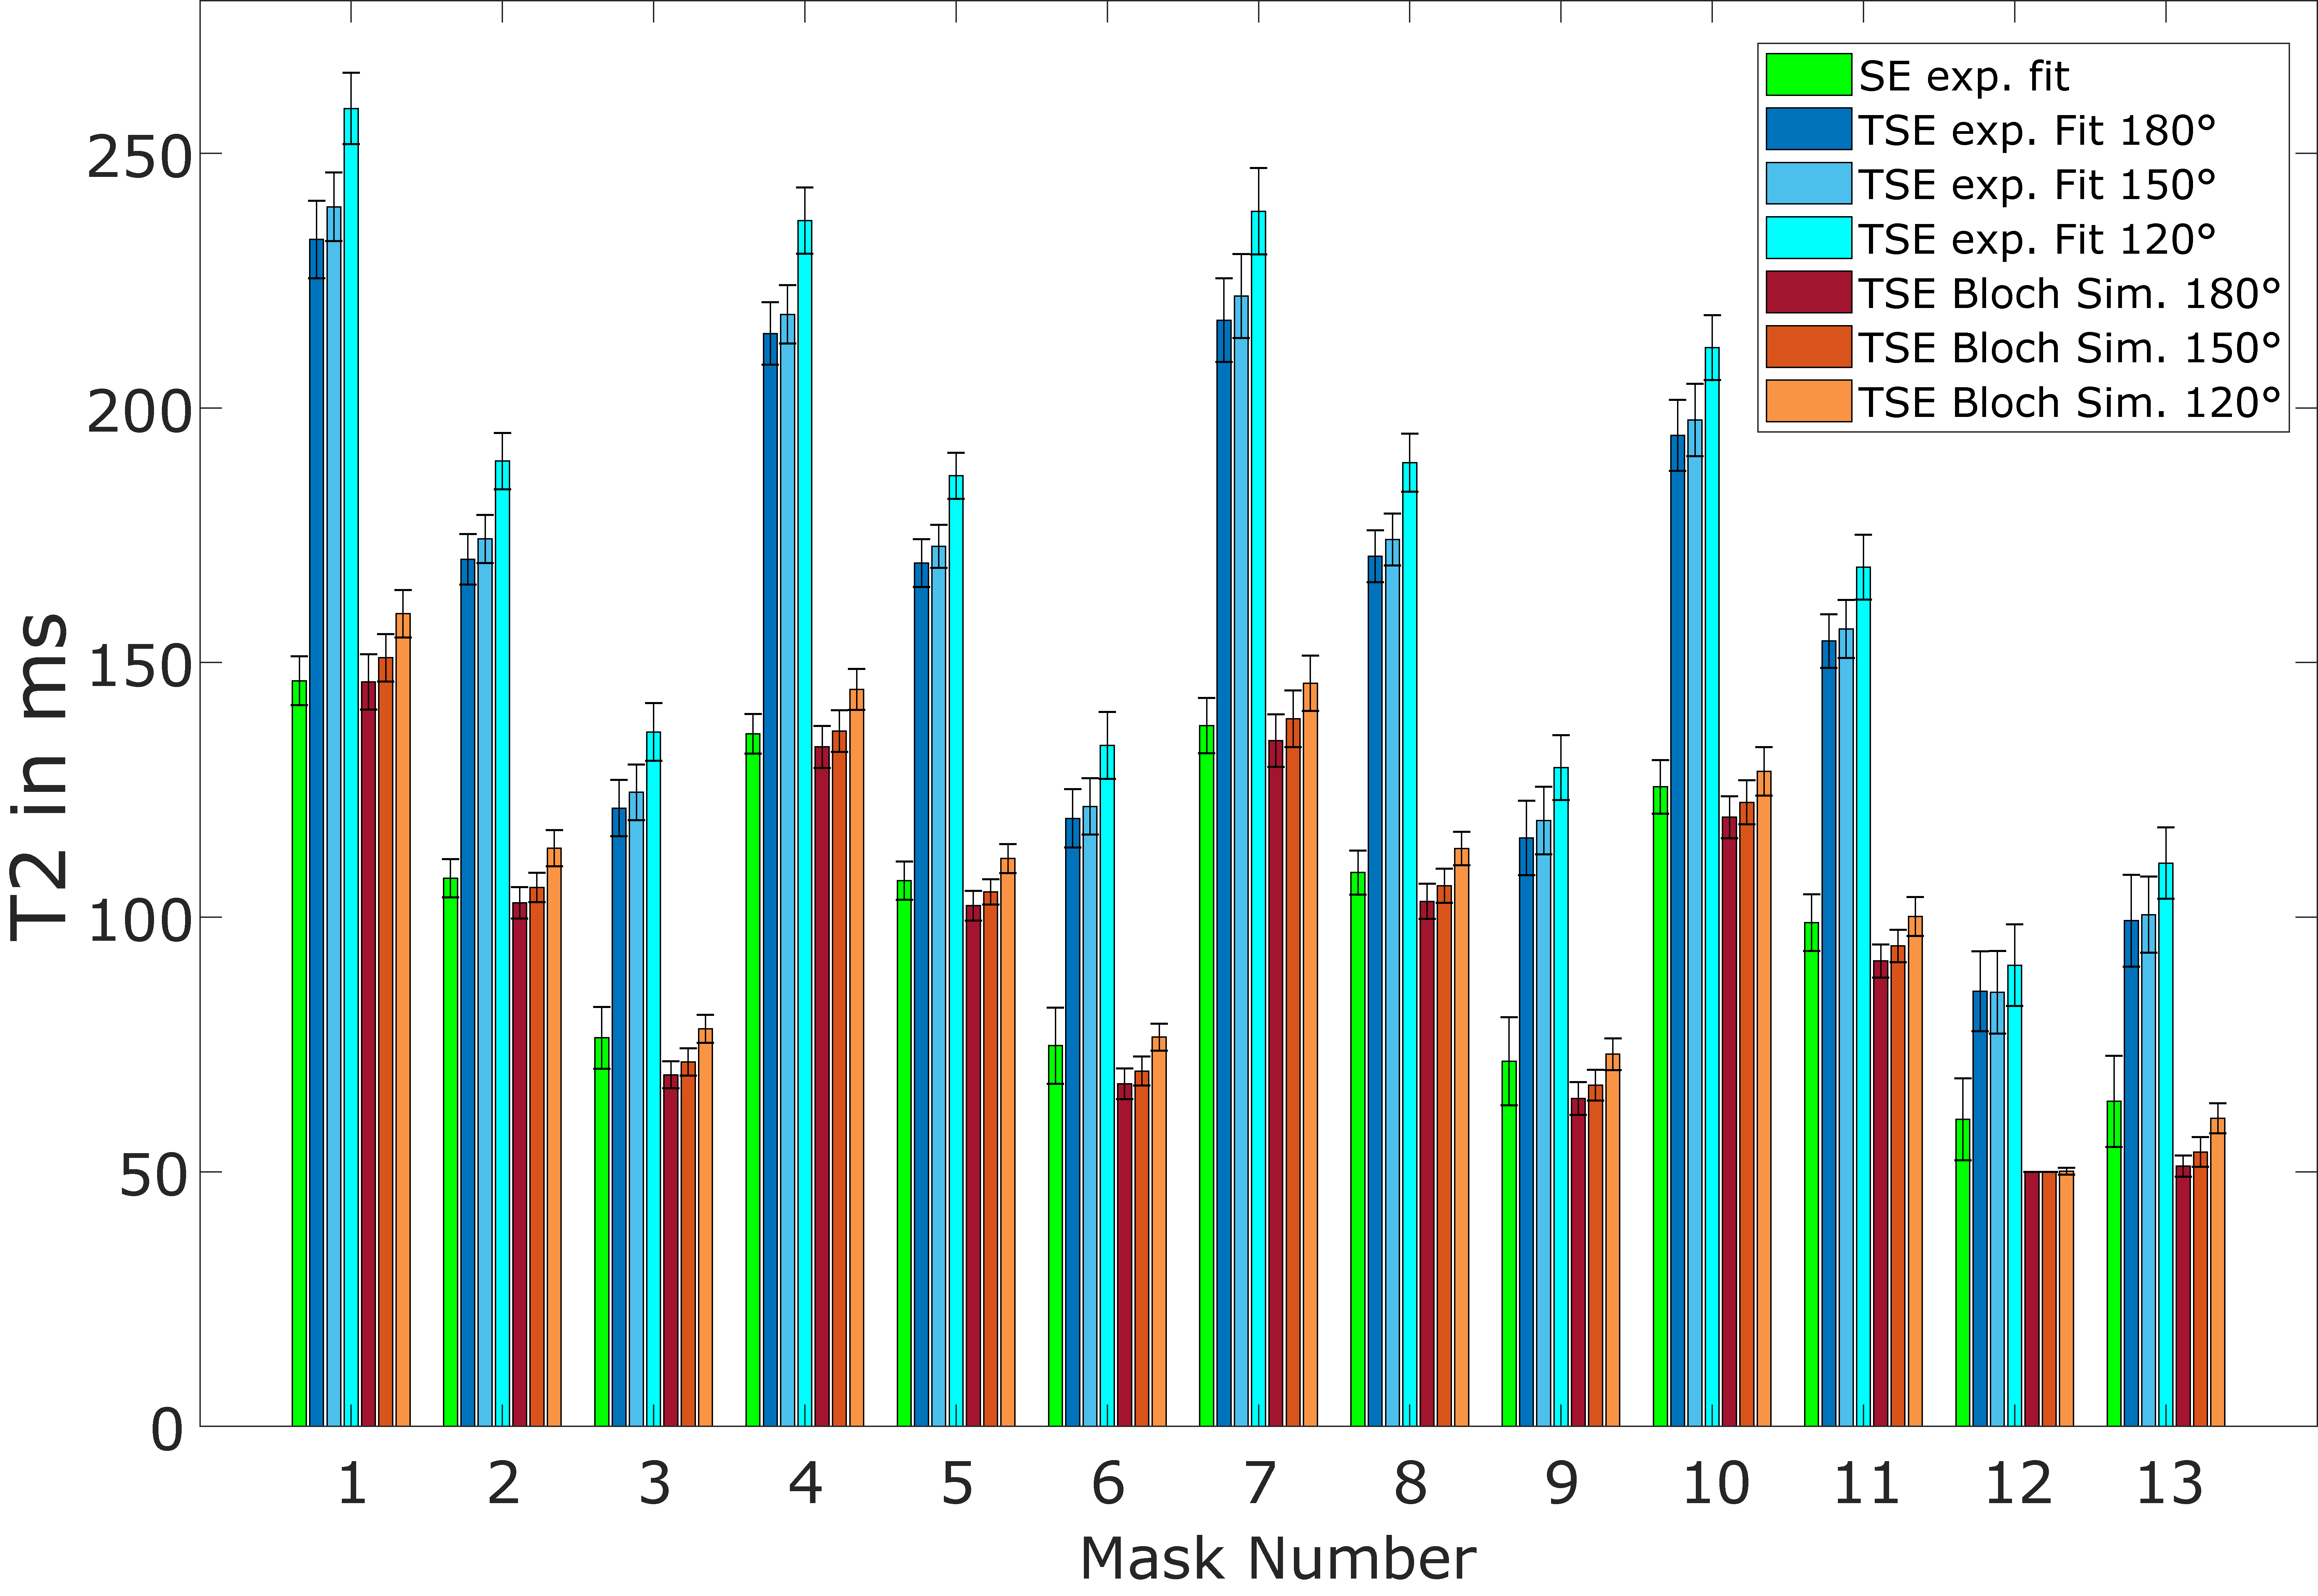
Figure 1 depicts the T2 maps from different evaluation methods. In the first row, the outcome of the spin echo experiment is shown, which was used as ground truth. In the second row of Figure 1, mono-exponential fits of the data from the TSE-experiment are shown and in the last row dictionary-based T2 maps for the different refocusing angles are presented. Evaluation results for each single mask are shown in Figure 2. The bar graphs represent mean value and standard deviation for each of the 13 masks and the different calculation methods. T2 values obtained by mono-exponential fit of TSE-data are markedly larger than the ground truth. Dictionary-based T2 mapping can provide relaxation values that coincide with the SE-experiment. Figure 3 shows that T2 values obtained by Bloch-based reconstruction can describe transverse relaxation times also in in vivo experiments. Bloch-based T2 values in the white matter region are within the range of 70-85 ms. As marked with white arrow heads T2 maps from Bloch-based reconstruction suffer less from artifacts than the SE-approach.Discussion
Bloch-based T2 mapping can provide reliable results in phantom experiments. Also in vivo T2 values coincide with literature values3. There is still a slight difference when using different refocusing angles. This might be caused by system imperfections that cause additional echo paths that cannot be accounted for by the simulations. A simple exponential fit can not model the signal evolution correctly since it does not account for stimulated echoes. Reduction of artifacts can be obtained by the shorter measurement time in TSE experiment (1:44 min) compared with the SE experiment (37:09 min). Taking more than three echoes into account could improve stability of T2 estimation but would also increase SAR and therefore limit resolution or field of view.Conclusion
The proposed method of Bloch-based reconstruction of T2 values from a multi-echo turbo spin echo sequence is a suitable tool for fast and accurate determination of T2 relaxation times. Due to short acquisition times in ME-TSE sequences compared with standard SE sequences also motion artifacts can be minimized. Especially at higher field strength T2 reconstruction from sequences with small refocusing flip angle is of high importance, since TSE sequences are otherwise limited by high SAR.Acknowledgements
The authors thank Sebastian Flassbeck and Simon Schmidt for providing the phantom and their valuable support.References
1. Horsfield MA, Jones DK. Applications
of diffusion-weighted and diffusion tensor MRI to white matter diseases – a
review. NMR in biomedicine. 2002;15(7-8):570-577.
2. Ben-Eliezer
N, Sodickson DK, Block KT. Rapid and accurate T2 mapping from multi-spin-echo
data using Bloch-simulation-based reconstruction. Magnetic resonance in medicine. 2015;73(2):809-817.
3. Whittall KP,
Mackay AL, Graeb DA, Nugent RA, Li DKB, Paty DW. In vivo measurement of T2
distributions and water contents in normal human brain. Magnetic resonance in medicine. 1997;37(1):34-43.
4. Mezrich R. A
perspective on K-space. Radiology. 1995;195(2):297-315.
Figures