2766
A new method to generate a voxel-specific input function for the analysis of dynamic contrast-enhanced MRI data in patients with brain tumours1Division of Informatics, Imaging and Data Sciences, University of Manchester, Manchester, United Kingdom
Synopsis
The parameters estimated in DCE-MRI studies vary greatly depending on the arterial input function. Moreover, a more complex model than the extended Tofts’ model (ETM) is needed in glioma patients. In this work, a method to generate a voxel-specific input function (VIF) is introduced and used with a two-tissue compartment model (2TCM) that separates the fast and slow kinetics of the Gd contrast agent. The VIF provided more accurate results in the superior sagittal sinus (SSS) than the internal carotid artery and combined with the 2TCM, significantly improved the fits to the tumour over the ETM using the SSS.
Purpose
For
the pharmacokinetic analysis of DCE-MR images, the arterial input function
(AIF) is commonly generated from the internal carotid artery (ICA) or the
superior sagittal sinus (SSS). When applied to the extended Tofts’ model (ETM),
the estimated parameters have been reported to vary greatly depending on the
blood vessel1. Models with two tissue compartments (2TCM) have been
shown to more adequately fit data from patients with glioma2,3. This
work aims i) to introduce a
voxel-specific input function (VIF) generated by taking into account both the
ICA and SSS time-concentration curves and ii) to apply it to the commonly used
ETM and the more complex 2TCM.Methods
Ten patients with glioma (three grade II, three grade III and four grade IV) underwent a pre-surgical DCE-MRI examination on a 1.5T Philips Achieva MR scanner with a SENSE coil. A dual-bolus protocol4 was adapted by acquiring the pre-bolus sagittal scan at twice higher temporal resolution than the main-bolus transaxial scan2. Pharmacokinetic analysis was performed at the voxel level using the ETM and 2TCM. The latter model assumes that the Gd contrast agent is exchanged between plasma and a fast (K1f,k2f) or a slow (K1s,k2s) tissue compartment in parallel, with the tissue concentration given by:
$$C_t(t)=(K_{1f}·e^{-k_{2f}t}+K_{1s}·^{-k_{2s}t})·C_A(t)+v_p·C_A(t)$$
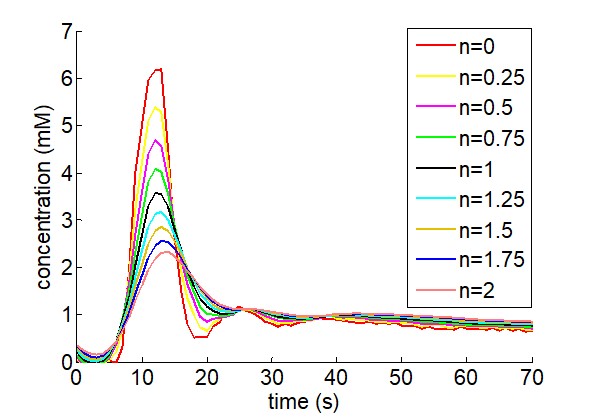
where vp is the fractional plasma volume, CA(t) is the AIF and the bolus arrival time is included as an additional fitted parameter. The aggregated parameters K1T and k2T can be estimated as a function of the four rate constants, weighted by the fraction of the corresponding extravascular spaces (VT=K1/k2). Three AIFs were used for the pharmacokinetic analysis: i) for the AIFICA, the peak was extracted from the ICA (pre-bolus) and combined with the tail of the SSS (main bolus)4, ii) the AIFSSS was extracted from the SSS (main bolus), and iii) the VIF was generated under the assumption that the AIFSSS is equal to the AIFICA convolved with a dispersion function D(t) when n=1 using:
$$FFT\{VIF(t)\}=FFT\{AIF_{ICA}(t)\}·FFT\{D(t)\}^n$$
where the power parameter n increases with the magnitude of the dispersion of the AIFICA and was included as an additional fitted parameter constrained to between 0 and 2 (figure 1).
Parametric maps were generated after correction for the non-uniform noise distribution2. The tumour region was manually delineated using the post-contrast T1-weighted and FLAIR images. Currently, two patients with glioblastoma have been fully analysed and their results reported here.
Results
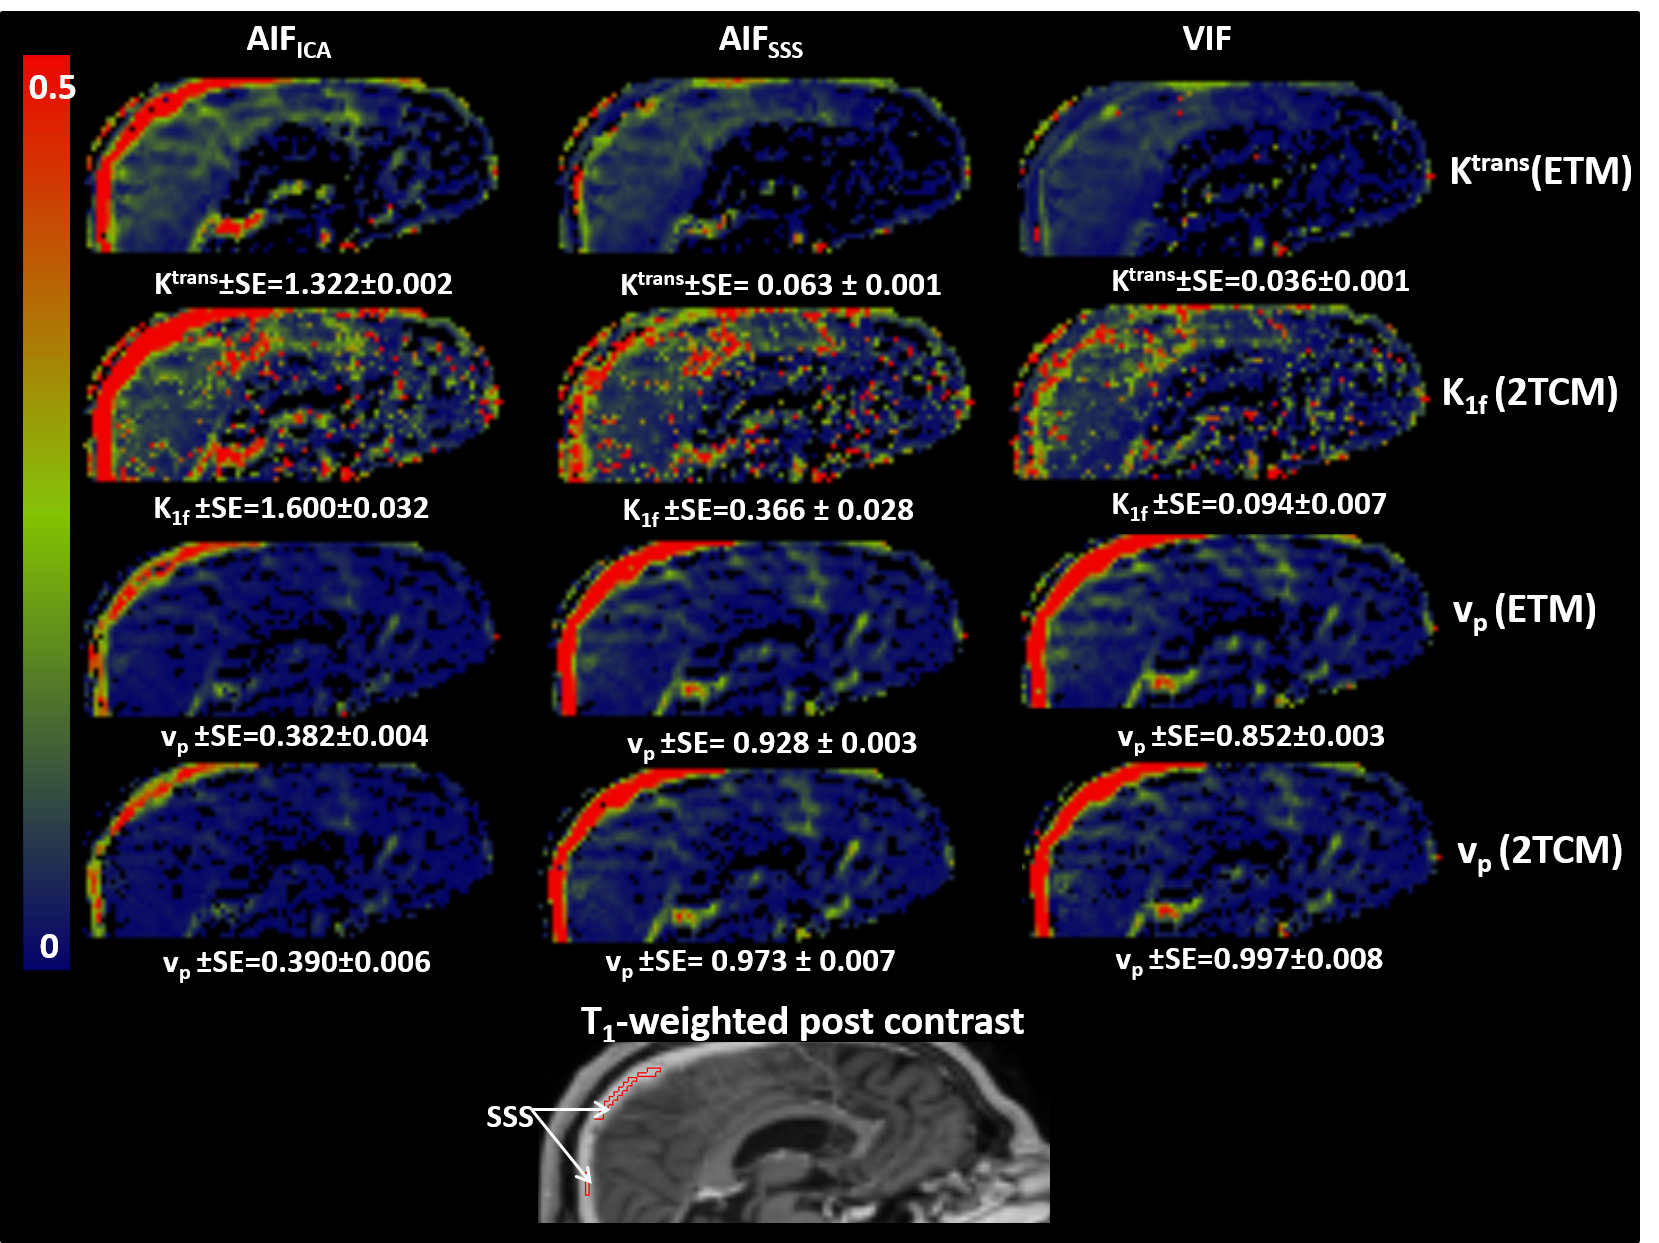
With both compartmental models, the AIFICA provided unrealistically high Ktrans and K1f in the SSS while vp was much lower than unity (0.39 and 0.63 for patients 1 and 2, respectively, figure 2). The use of the AIFSSS or the VIF reduced Ktrans and K1f by half or more with either model, and increased vp to 0.77-0.99 for both patients.
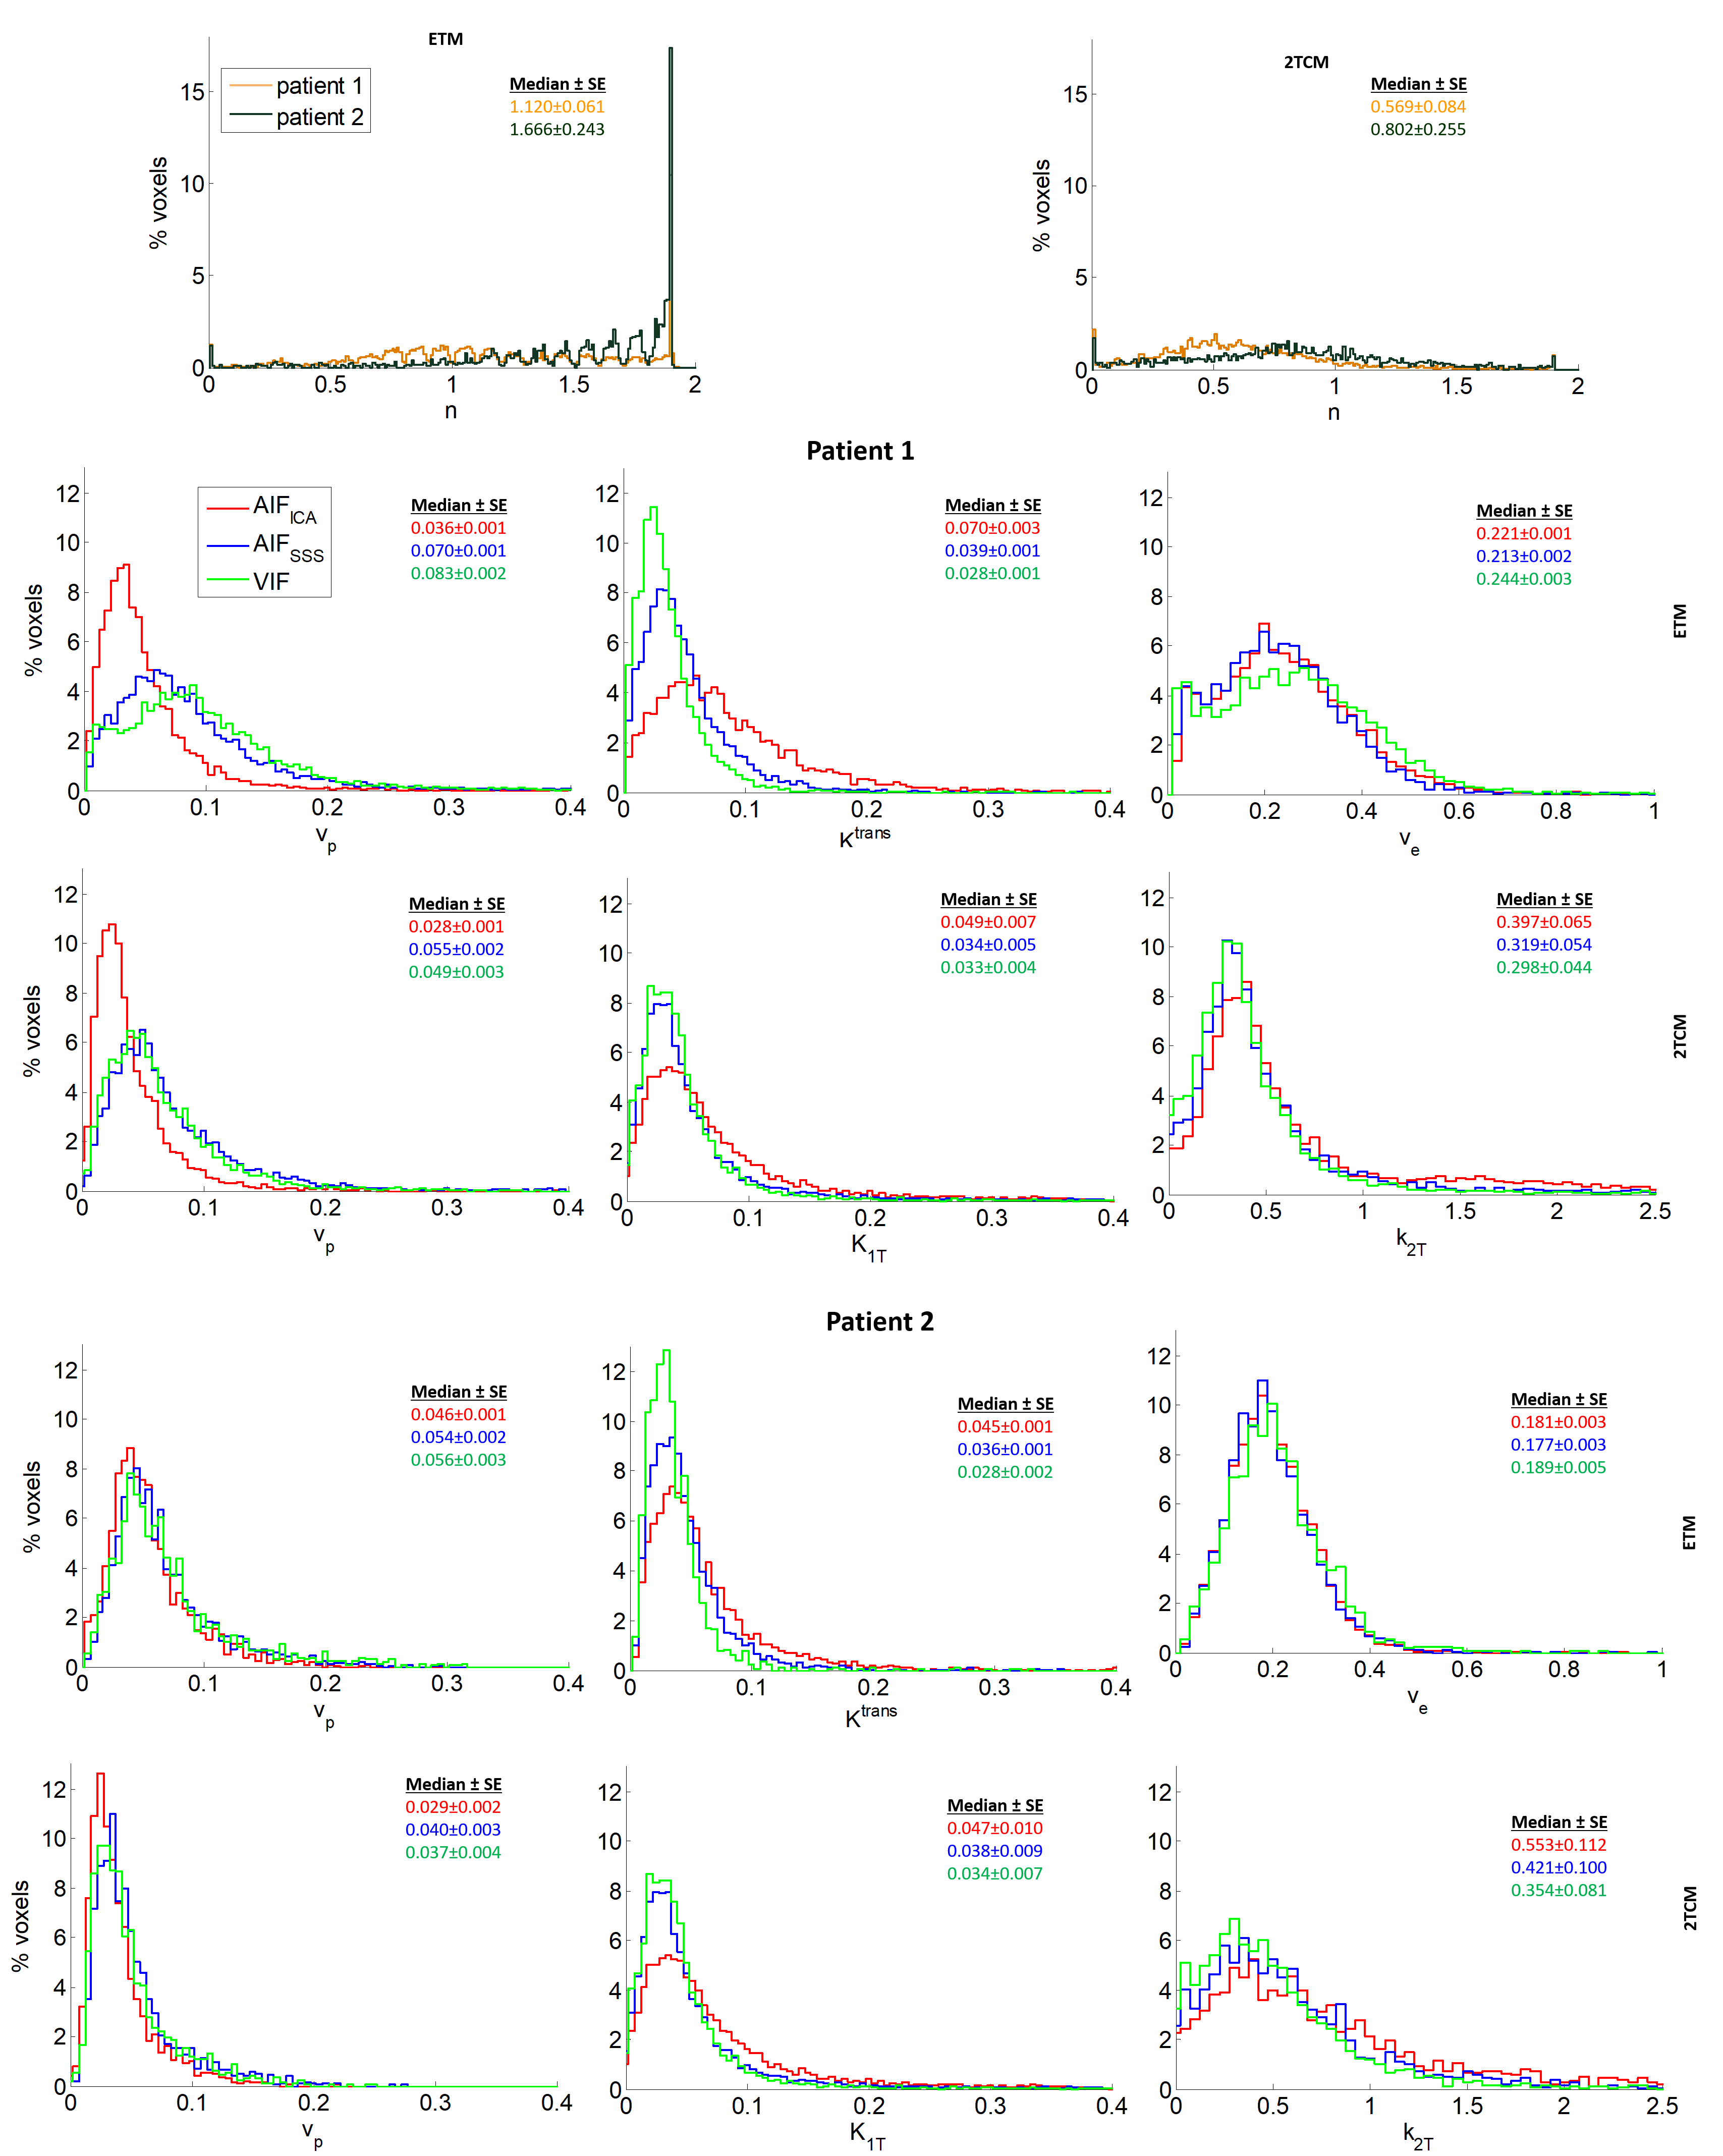
The two models exhibited different distributions of the power parameter n when the VIF was used (figure 3). In the enhancing rim of the tumour, the ETM returned median n values above unity and even close to the maximum of 2 in patient 2 whereas the 2TCM exhibited a wide distribution across the allowed values, as expected, with median n values below unity for both patients.
Estimates of vp from either compartmental model was systematically lower when the AIFICA was used (0.028-0.046) compared to the AIFSSS (0.040-0.070) and the VIF (0.037-0.083), which showed similar distributions (figure 3). For both Ktrans and K1T, the AIFICA yielded higher values (0.045-0.070 mlp/min/mlt) than the other two input functions (0.028-0.039 mlp/min/mlt), in agreement with previous findings1. Ktrans estimates from the ETM using the AIFSSS were also higher than those using the VIF whereas K1T estimates from the 2TCM were similar using these two input functions. The distributions for ve and k2T using the different input functions were more similar than for the other parameters.
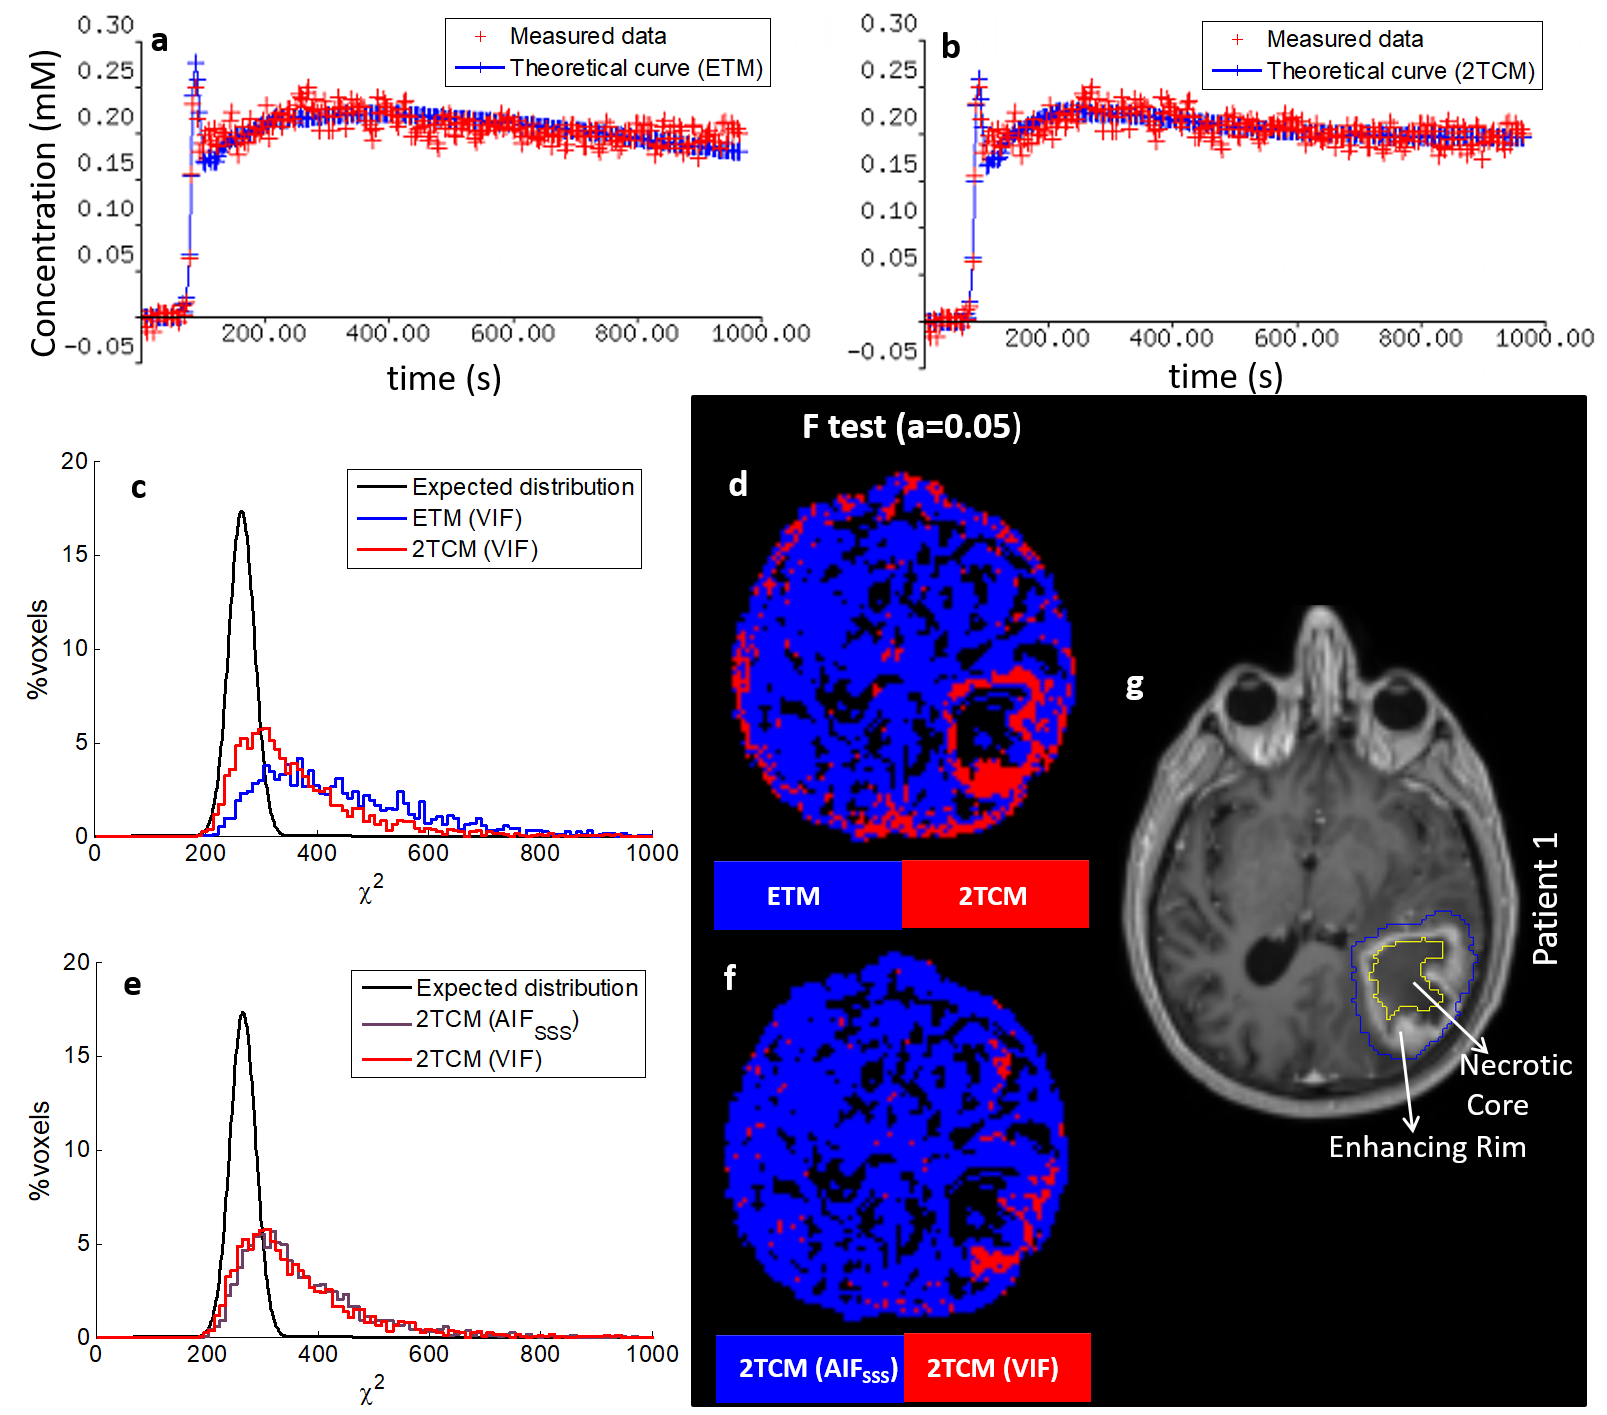
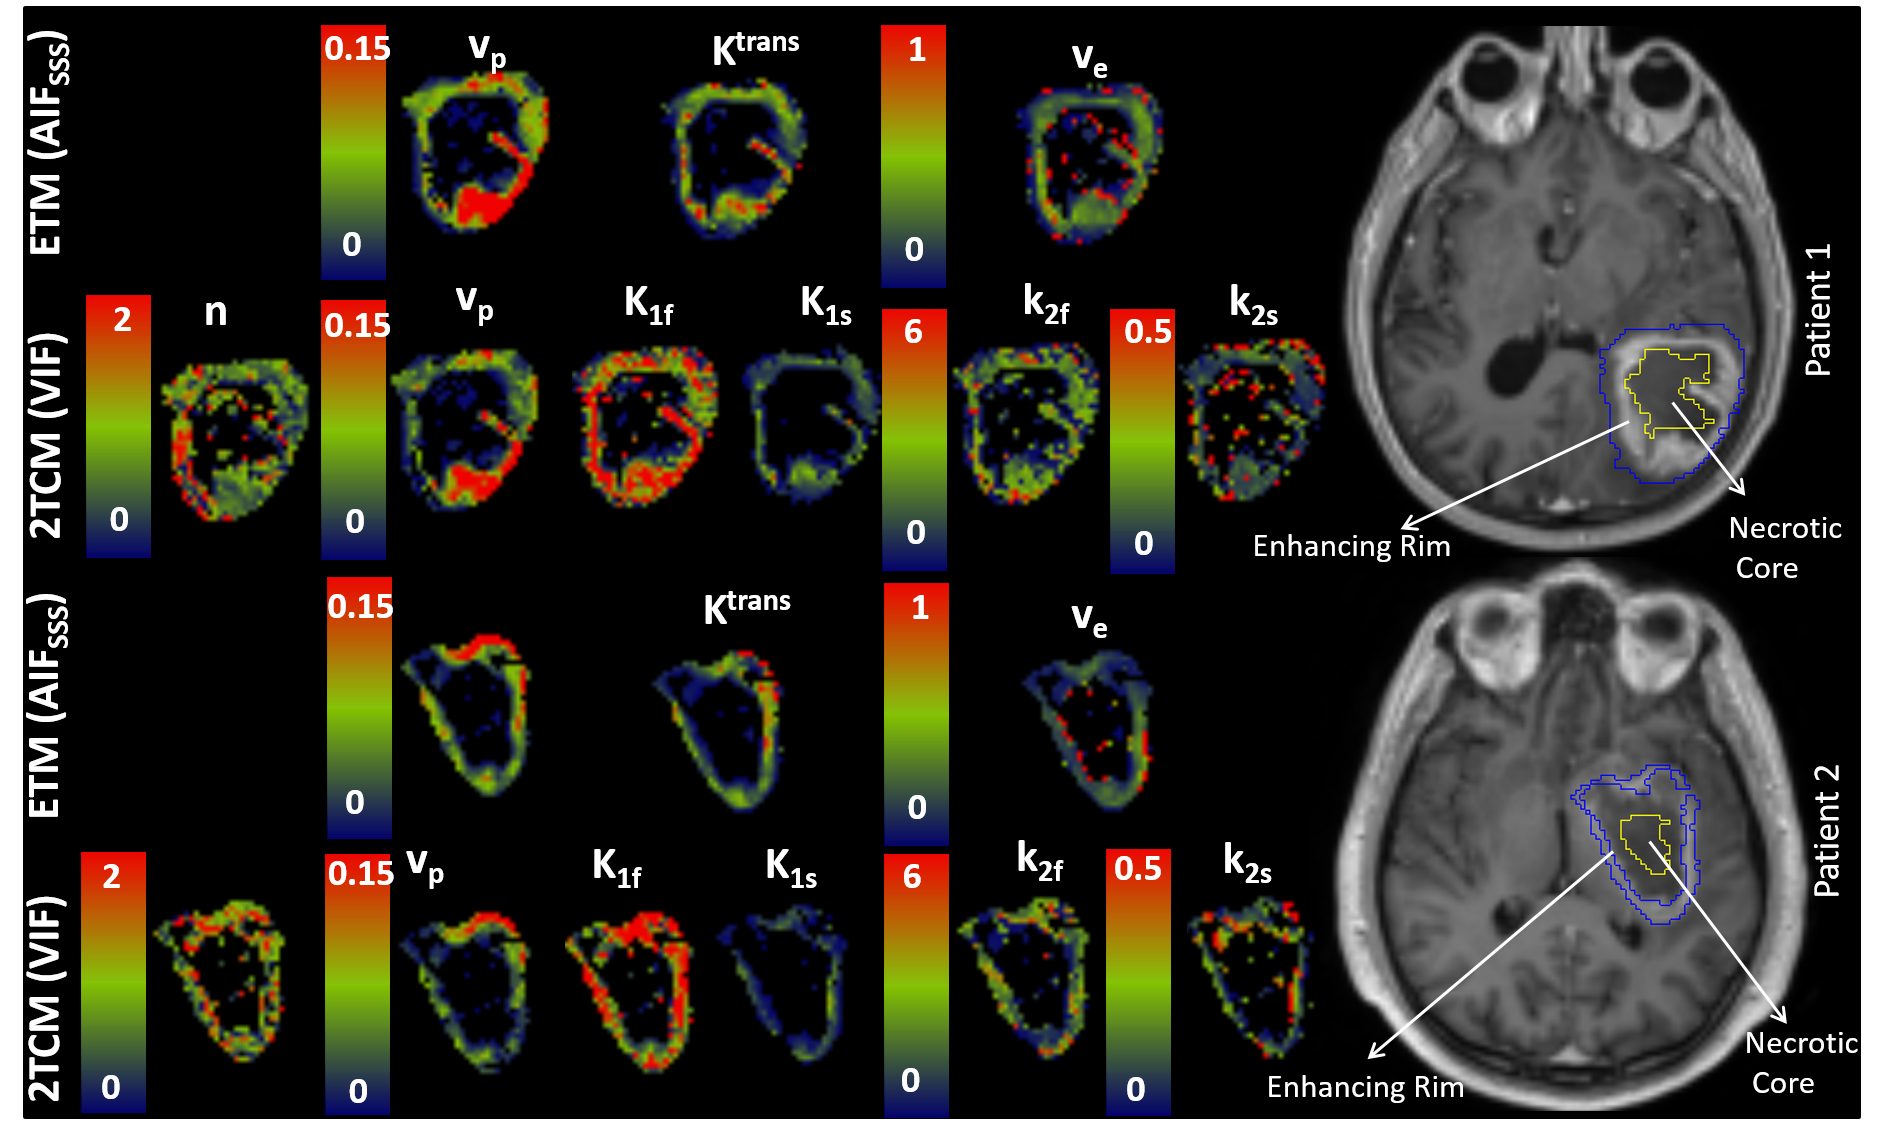
The 2TCM described the data significantly better than the ETM in the enhancing rim of the tumour (F-test, figure 4). Moreover, fits to areas of the tumour were significantly improved by using the VIF instead of the AIFSSS with the 2TCM. Parametric maps from either the ETM with the AIFSSS or the 2TCM with the VIF exhibited heterogeneity in the tumour for all parameters (figure 5).
Conclusion
A
voxel-specific input function can be generated when data from both the ICA and
the SSS are acquired. The resulting dispersion function indicated that in the
tumour the median input function is more dispersed than the ICA but less than
the SSS. The 2TCM with the VIF described
the data significantly better in the enhancing rim compared to the ETM or 2TCM
with the SSS input function.Acknowledgements
The research leading to these results was supported by the Cancer Research UK and EPSRC Cancer Imaging Centre in Cambridge and Manchester (grant C8742/A18097).References
1. Keil C.V, Mädler B, Gieseke J, et al. Effects of arterial input function selection on kinetic parameters in brain dynamic contrast-enhanced MRI. Magn. Reson. Med. 2017; 40:83-90
2. Krokos G, Thacker N, Djoukhadar I, et al. Non-uniform noise correction in dynamic contrast-enhanced MR images reveals superiority of the two compartmental exchange model over the extended Tofts and the adiabatic approximation to the tissue homogeneity models in glioma patients. Proc. Intl. Soc. Mag. Reson. Med. 24; 2016; abstract: 2465
3. Lüdemann L, Grieger W, Wurm R, et al. Comparison of dynamic contrast-enhanced MRI with WHO tumor grading for gliomas. Eur. Radiol. 2001; 11(7):1231-41
4. Li KL, Buonaccorsi G, Thompson G, et al. An improved coverage and spatial resolution-using dual injection dynamic contrast-enhanced (ICE-DICE) MRI: a novel dynamic contrast-enhanced technique for cerebral tumors. Magn. Reson. Imag. 2012; 68:452-62
Figures