2765
Analysis of magnetization transfer (MT) effect on Bloch-simulation based T2 mapping accuracy, demonstrated on in vitro urea phantom1Department of Biomedical Engineering, Tel Aviv University, Tel Aviv, Israel, 2Center for Advanced Imaging Innovation and Research, New York University, New York, NY, United States, 3Sagol School of Neuroscience, Tel Aviv University, Tel Aviv, Israel
Synopsis
Accurate quantification of T2 values hold high value for a variety of clinical and research applications, yet is highly challenged by the inherent bias of rapid multi-SE (MSE) protocols due to stimulated and indirect echoes. Recently, we introduced the echo modulation curve (EMC) algorithm, which successfully overcomes this problem to produce accurate quantification of T2 values that are stable across scanners and scan settings. In this work, we investigate the effect of magnetization transfer on MSE signal, and specifically on EMC-derived T2 values for different T2 baselines, number of slices, and slice gaps, using an in vitro urea model.
Introduction
Accurate mapping of T2 values is highly challenging in clinical settings due to the inherent bias of rapid multi spin-echo (MSE) protocols by stimulated and indirect echoes, non-rectangular slice profiles and transmit-field (B1+) inhomogeneities. Moreover, this bias depends on the protocol implementation and scan parameters, causing T2 values in the same subject to vary between scanners and protocols1-3. We have recently reported an alternative approach for quantitative T2 mapping, the echo modulation curve (EMC) algorithm. This technique uses Bloch simulations to trace all stimulated and indirect echo pathways during an MSE acquisition by incorporating the exact pulse sequence implementation into the reconstruction model4,5. The EMC algorithm is thus able to produce the true T2 values of the tissue with excellent correlation to values acquired using gold-standard single spin-echo (SSE), and offers stability across different protocol implementations, scanners, and scan-settings6. A recent report performed detailed analysis of T2 mapping approaches, demonstrating the advantage of Bloch simulation-based approach like EMC, over extended phase-graph (EPG) techniques7.
An important factor that can bias the measurement of T2 values in vivo is magnetization transfer (MT) from the macromolecular pool, instigated by the large number of refocusing radiofrequency (RF) pulses employed in MSE protocols8. In this work, we investigated whether EMC based T2 measurements are affected by MT using an in vitro urea phantom, for different T2 baselines, number of slices, and slice gaps. This model provided controlled settings with known spectral content of two amide groups located 1 ppm from water, high water solubility, and effective MT saturation efficiency9-11.
Methods
Phantom preparation: five 50 ml tubes were prepared with distilled water doped with 0.25 mM MnCl2 to reduce the water T2 / T1 values to physiological range, and a range of urea concentrations of Curea = 0, 0.5, 2, 3.5, 5 Molar.
Data acquisition: phantom was scanned on whole-body 3 T scanner (Siemens prisma) using a standard SSE and MSE protocols. Scan parameters: TR/TE=3000/10 ms; NEchoes=1 (SSE); 10 or 32 (MSE); resolution=0.8x0.8 mm2; slice=4 mm; BW=200 Hz/Px; Nslices=1,5,9,15; slice-gap=0,50,100,200 %; acceleration=2x GRAPPA; Tacq=1h 37 min (SSE), 5:05 min (MSE).
Reconstruction: T2 maps were generated on a pixel-by-pixel basis using the EMC algorithm, incorporating spatial smoothness of the B1+ transmit field profile4,5,6. Mean ± standard deviation of T2 values were calculated for a region of interest within each tube, and compared against SSE reference and across the different MSE scan settings assayed.
Results
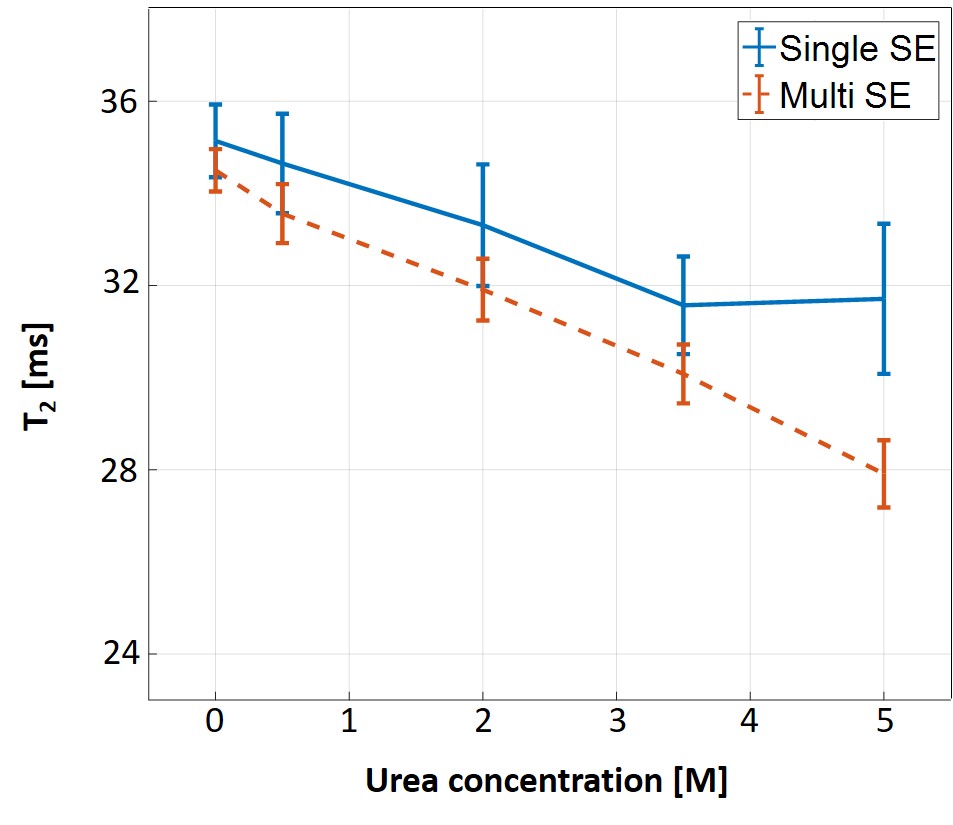
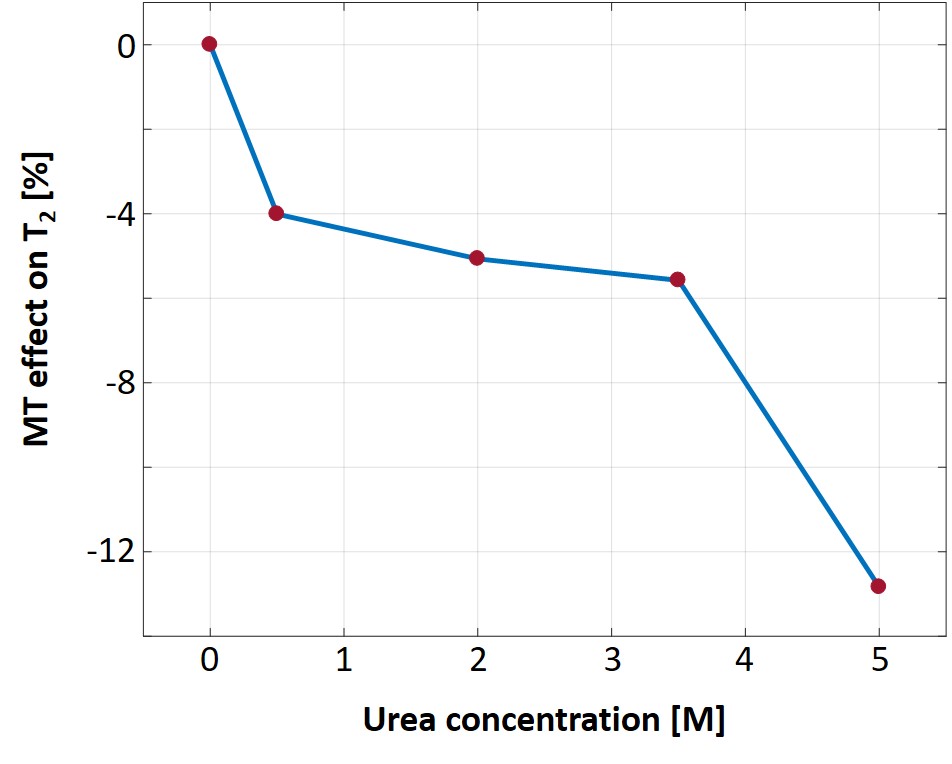
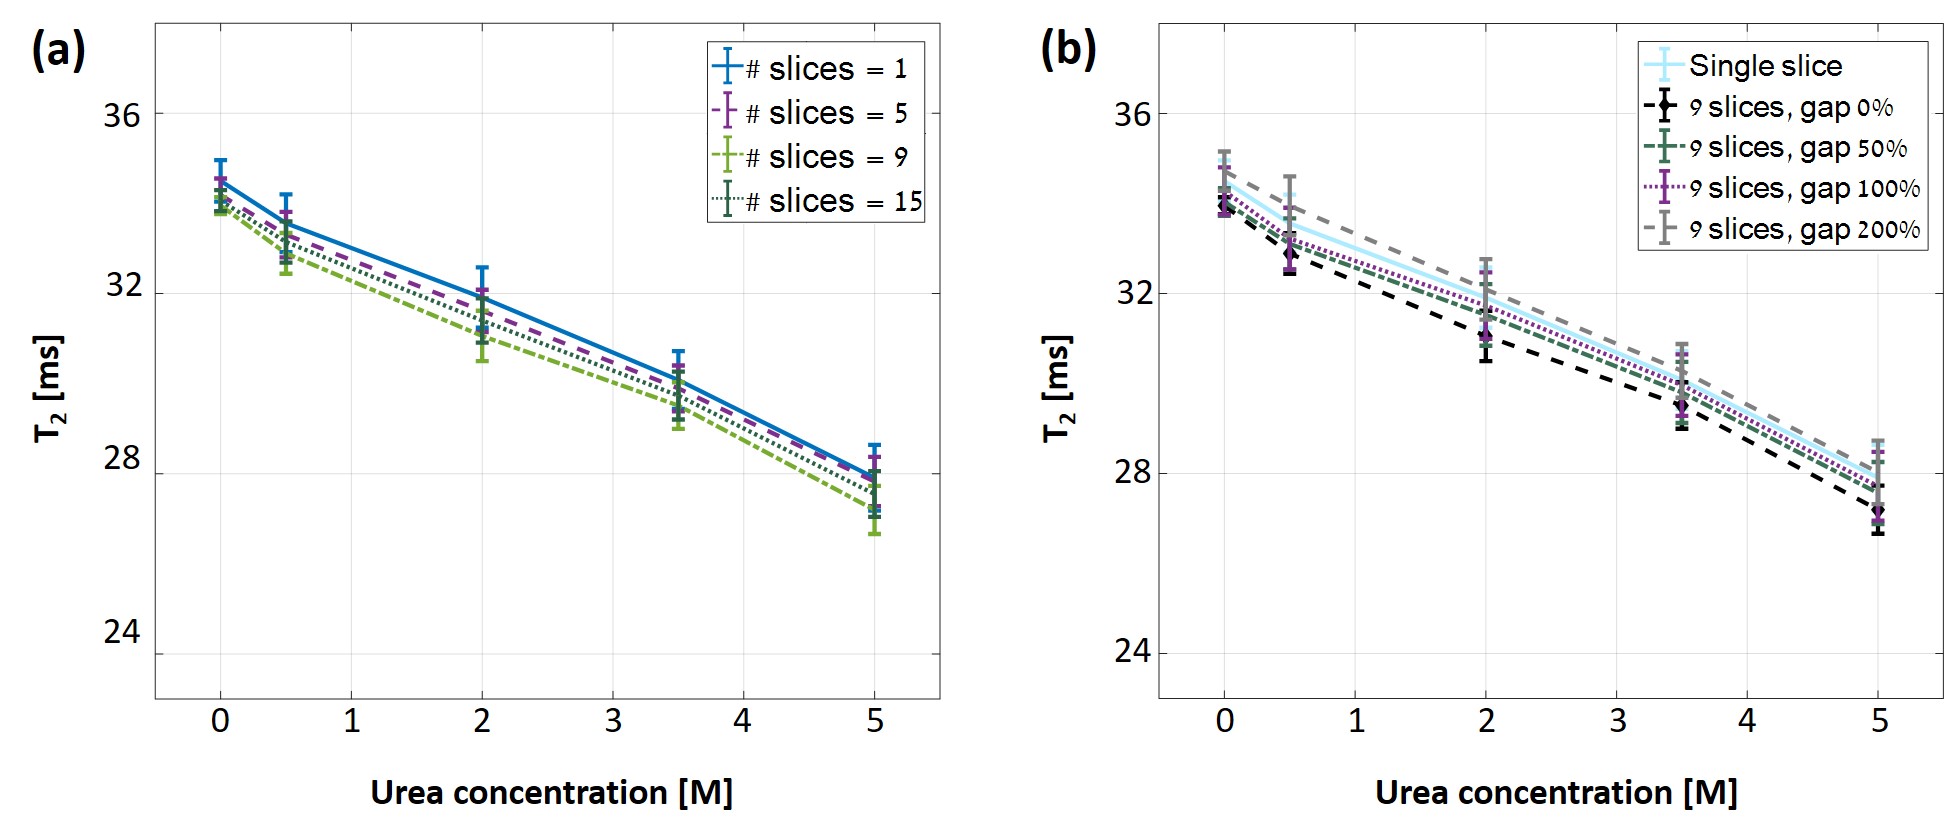
Fig. 1 shows the T2 values for different concentrations of urea using SSE and MSE. An expected decrease in baseline T2 is observed due to increased dipole-dipole interactions with the two hydrophilic amide groups in urea12. The effect of MT, and its dependence on macromolecular concentration, is manifested, in this case, in the increased discrepancy between SSE and MSE for different tubes. The % difference was calculated for each tube and shown in Fig. 2. Another intriguing finding was that MT saturation occurred separately for each TR. This was deduced by processing MSE data with 10 echoes vs. MSE data using 10 out of 32 echoes, both producing identical MT effects as in Fig. 1 (result not shown). This finding suggests that the additional 22 refocusing pulses that were applied within one TR, did not increase the saturation in subsequent TRs. Fig. 3 presents measured T2 values for different Nslices and slice-gap. The lack of any visible trend, or dispersion with increased urea content (as seen in Fig. 1), implies that both the MT effect and calculated T2 values do not depend on these scan parameters. This was further validated by calculating the MT-ratio in the raw signal-intensity between single and multi-slice, and for different slice-gaps, showing no MT effect across all urea concentrations.Discussion and Conclusions
MT mechanism can significantly affect MSE signal due to its use of a large number of RF pulses. The indirect effect of MT on the measured T2 values (and on derived parameters such as myelin water fraction) is not straightforward and will depend on macromolecular content and scan parameters. Here, we used a urea model, providing a simple and informative way to study the effects of MT on measured T2 values, and offering important insight to the effect of MT at different scan settings. Notably, we saw a 0…4% decrease in T2 values for physiological concentrations of 0 … 0.5 M urea, suggesting that MT effect should not be ignored in vivo. Future work will investigate the bias in T2 values for various ex vivo samples, containing physiological macromolecular content.Acknowledgements
ISF Grant 2009/17References
[1] Deoni, Sean CL, Brian K. Rutt, and Terry M. Peters. "Rapid combined T1 and T2 mapping using gradient recalled acquisition in the steady state." Magnetic Resonance in Medicine 49.3 (2003): 515-526.
[2] Lebel R, Wilman A. Transverse relaxometry with stimulated echo compensation. Magn Reson Med 2010; v. 64(4), p. 1005-14.
[3] Poon, Colin S., and R. Mark Henkelman. "Practical T2 quantitation for clinical applications." Journal of Magnetic Resonance Imaging2.5 (1992): 541-553.
[4] Ben-Eliezer N, Sodickson, DK, and Block, KT. Rapid and accurate T2 mapping from multi-spin-echo data using Bloch-simulation-based reconstruction. Magn Reson Med 2015; 73(2): 809-17.
[5] Ben-Eliezer N, Sodickson DK, Shepherd T, Wiggins GC, Block KT. Accelerated and motion robust in vivo T2 mapping from radially undersampled data using Bloch-simulation-based iterative reconstruction. Magn Reson Med 2016; 75(3): 1346-54.
[6] Shepherd TM, Kirov I, Charlson E, Bruno M, Babb J, Sodickson DK, Ben-Eliezer N. "New rapid, accurate T2 quantification detects pathology in normal-appearing brain regions of relapsing-remitting MS patients." NeuroImage: Clinical 14 (2017): 363-370.
[7] McPhee, Kelly C., and Alan H. Wilman. "Transverse relaxation and flip angle mapping: evaluation of simultaneous and independent methods using multiple spin echoes." Magnetic resonance in medicine 77.5 (2017): 2057-2065.
[8] Constable, R. T., et al. "Factors influencing contrast in fast spin-echo MR imaging." Magnetic resonance imaging 10.4 (1992): 497-511.
[9] Liu, Lingyan, et al. "Quantitative analysis of urea in human urine and serum by 1H nuclear magnetic resonance." Analyst 137.3 (2012): 595-600.
[10] van Zijl, Peter, and Nirbhay N. Yadav. "Chemical exchange saturation transfer (CEST): what is in a name and what isn't?." Magnetic resonance in medicine 65.4 (2011): 927-948.
[11] Schreier, Christina, et al. "Reproducibility of NMR analysis of urine samples: Impact of sample preparation, storage conditions, and animal health status." BioMed research international 2013 (2013).
[12] Edzes, Hommo T., and Edward T. Samulski. "Cross relaxation and spin diffusion in the proton NMR of hydrated collagen." Nature 265.5594 (1977): 521-523.
Figures