2763
Improved muscle T2 estimation by maximum-likelihood parameter estimation using an extended-phase-graph signal model with locally estimated Rician noise levels1Institute of Neurology, London, United Kingdom, 2Glaxo Smith Kline, London, United Kingdom
Synopsis
Maximum likelihood model parameter estimation accounting for the Rician noise distribution in MRI acquisitions, combined with the extended graph formalism and incorporating slice profile considerations, offers higher precision and less bias with regards to the predicted parameters in T2 relaxometry. In this work this was tested by simulations and validated in phantom and in vivo data from healthy volunteers.
Introduction
CPMG T2 relaxometry, sensitive to muscle-water and fat-faction (ff) changes in neuromuscular diseases, has been commonly implemented by fitting exponential functions to the multi-echo CPMG signal using least-squares (LSQ) minimization. Recently it has been proposed that the extended phase graph (EPG) formalism1 may offer a more accurate model to which to fit muscle CPMG T2 data2 in order to account for stimulated and alternate echo effects. The assumptions of normally distributed and homoscedastic noise implicit in LSQ minimization may not apply in practical clinical muscle relaxometry acquisitions where SNRs may not be sufficient to ignore the effects of Rician noise in magnitude reconstructed images. It has been suggested that maximum likelihood estimation (MLE) explicitly incorporating the Rician noise probability density function (pdf) improves accuracy when fitting exponential models to T2 relaxometry data3, but this has not yet been demonstrated for a slice-profile corrected EPG model applicable to muscle T2 relaxometry. Since in typical acquisitions the noise is spatially variant due e.g. to receive-coil sensitivity inhomogeneity, a priori estimation of the noise SD is challenging; we therefore investigated a strategy for MLE EPG T2 estimation in which the noise SD for each pixel is estimated within the fitting procedure.Aims
To determine, while fitting to an extended phase graph (EPG) model accurately modelling the CPMG signals under typical acquisition conditions for muscle investigations, the conditions under which MLE estimation provides an improvement over least-squares fitting.Methods
All simulations were performed in Matlab. A forward EPG model was implemented incorporating Bloch equation calculations of the effective excitation and refocusing angles across the slice profile, using known RF pulse shapes in use on our 3 tesla scanner (Siemens Prisma). This model was used to generate 1000 replicates at each of 3 levels of randomly generated additive Rician noise, of an echo-train with parameters matching in vivo protocols in use in our centre: T2=30.0ms, T1=1400ms, excitation and refocussing flip angles 90 and 180 respectively, B1 correction factor =1.0; inter-echo spacing = 10ms, no of echoes = 17.
Three fitting approaches were investigated: 1) MLE of 3 EPG parameters: Overall amplitude, T2 and B1 (T1 was fixed at 1400ms – preliminary investigations suggested T1 had little effect on the remaining parameter estimates). The procedure maximised a log-likelihood function calculated according to a Rician pdf in which the generating standard deviation was allowed to vary as a fit parameter 2) Standard LSQ of the same EPG parameters as in 1), 2) Standard LSQ of the same sEPG parameters as in 1, with a constant baseline added to the EPG model to partially account for the effects of rectified noise. Validation was provided by fitting CPMG data obtained from a calibrated phantom, and from thigh muscles of a healthy volunteer.
Results
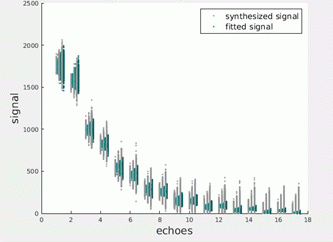
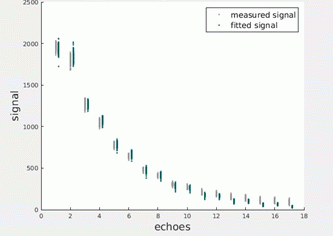
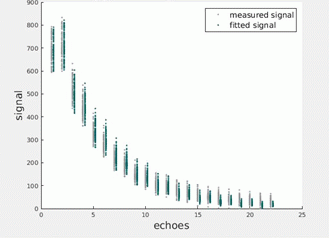
Figures 1 illustrate the simulated EPG signals at successively decreasing SNRs together with noise-corrected values estimated using the parameters returned by the MLE procedure. Figures 2 and 3 present equivalent data for the phantom and in vivo measurements. Figure 4 tabulates the fit parameters returned by each of the estimation methods for the available data sets. It can be seen that for the three simulated data sets the EPG-MLE method returned T2 estimates with less bias and lower standard deviations than either of the LSQ approaches, and a more accurate estimate of the B1 factor. The phantom and in vivo muscle results were consistent with simulations, and the expected T2 values in each case.Discussion
For the single component T2 models investigated, LSQ estimation of the EPG parameters yielded T2 values with a systematically higher bias than the MLE approach, which increased with decreasing SNR. The precision of the MLE parameter estimates was superior to the LSQ results, and importantly the MLE method reliably estimated the Rician noise SD. This is important as it enables accurate compensation for potential Rician noise bias in the low SNR regime without needing an a priori estimate of the noise levels. Future work will extend this analysis to incorporate multi-component models required to achieve fat-water signal separation which is essential if T2 is to be used a biomarker in diseased muscle.Conclusions
MLE T2 mapping using an EPG model incorporating slice profile effects may provide parameter estimates with reduced bias and higher precision than equivalent LSQ procedures. This may increase the sensitivity and consistency of muscle T2 relaxometry when used to monitor pathological changes in neuromuscular diseases.Acknowledgements
Affiliations: Neuroradiological Academic Unit, UCL Institute of Neurology, London, UK;
MRC Centre for Neuromuscular Diseases, UCL Institute of Neurology, London;
GlaxoSmithKline, London, UK.
References
1. Lebel RM, Wilman AH. Transverse relaxometry with stimulated echo compensation. Magn Reson Med. 2010 Oct 1;64(4):1005–14.
2. Marty B, Baudin P-Y, Reyngoudt H, Azzabou N, Araujo ECA, Carlier PG, et al. Simultaneous muscle water T2 and fat fraction mapping using transverse relaxometry with stimulated echo compensation. NMR Biomed. 2016 Apr;29(4):431–43.
3. Sijbers J, Arnold J, Verhoye M, Raman ER, Van Dyck D. Optimal estimation of T2 maps from magnitude MR images. In: Medical Imaging’98 [Internet]. International Society for Optics and Photonics; 1998 [cited 2017 May 4]. p. 384–390.
Figures


