2760
Multi-Parameter Mapping with 500 µm Resolution Using a Flexible 23-Channel RF Coil1Department of Neurophysics, Max Planck Institute for Human Cognitive and Brain Sciences, Leipzig, Germany
Synopsis
To better understand the human brain’s microstructure, there is a need for in-vivo myelin and iron mapping methods which have sufficient resolution to map mesoscopic intra-cortical structures (e.g. lamina). However, resolution is critically SNR-limited. We show that by using a mechanically flexible RF coil array which conforms to the subject’s own individual skull shape, sufficient SNR is gained to map the main MR contrast parameters and the line of Gennari within the superficial primary visual cortex. The work demonstrates the feasibility of laminar analysis of myelination at widely available modest field strengths.
Introduction
Quantitative MRI has spawned methods to non-invasively map myelination and iron in neural tissue, advancing our understanding of the human brain. Characterising intra-cortical structures such as columns and laminae requires mapping with very high spatial resolution1; typically such resolutions are not achievable in reasonable scan times because of the insufficient signal-to-noise ratio (SNR). We address this problem by exploiting the SNR gain from form-fitting a mechanically flexible radio-frequency (RF) coil array to the participant’s head, in order to map simultaneously the multiple MR relaxation and magnetization transfer parameters2 at a routinely available magnetic field strength, yet with remarkably high resolution.Methods
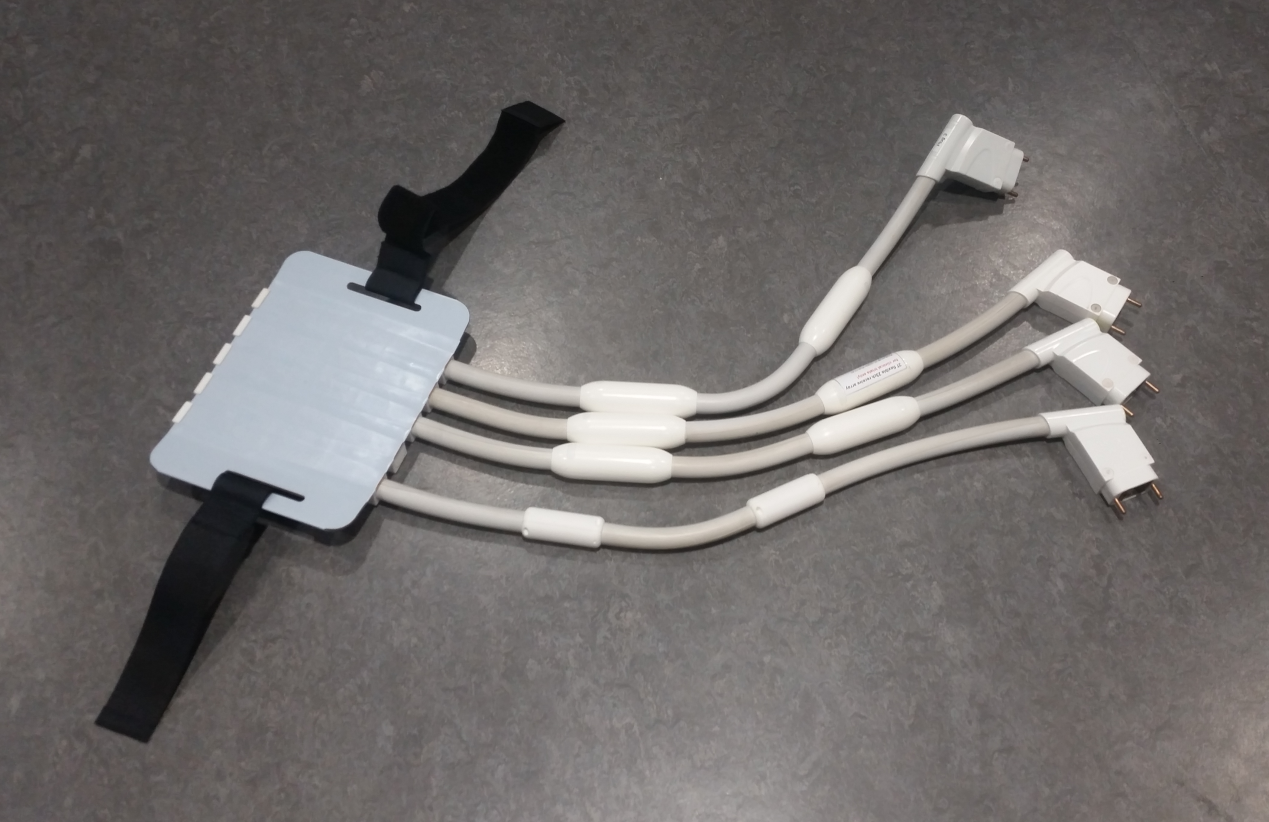
The receive-only RF coil array, described elsewhere3 and illustrated in Figure 1, consists of 23 loop elements deposited on a rigid-flex printed circuit board which bends to conform with the subject’s skull. This allows an SNR gain versus the manufacturer’s 32-channel head coil of approximately 2x in the targeted region, here occipital cortex. The participants were positioned such that the occipital pole was approximately centred amongst the coil elements, while the neck was supported by foam pads.
Three healthy volunteers were scanned over two sessions on a 3T MR system (Connectom, Siemens Healthineers, Erlangen, Germany) using a gradient and RF-spoiled multi-echo 3D gradient echo sequence2 at 500 µm isotropic resolution (TR 25 ms, 8 echoes equally spaced between 2.4 and 18.4 ms) and with matrix size 240/480/176 (phase/read/partition). In each session, PD-, MT- and T1-weighted (flip angles α=6°, 6°, 21°) volumes were acquired twice to assess scan-rescan reproducibility, in addition to calibration data to correct for RF transmit field non-uniformity4. The field of view in the 3D phase-encoding direction could be limited to approximately 50% of the brain without fold-over artifacts due to the low sensitivity of the RF coil to frontal brain areas. With partial Fourier (factor 6/8) in the partition phase-encoding direction, the acquisition of each volume lasted 13 minutes.
Maps were created from the weighted datasets using custom MATLAB tools (MathWorks, MA), including the hMRI toolbox (http://hmri.info/), written within the SPM12 framework (http://www.fil.ion.ucl.ac.uk/spm/). Masks of cortical grey matter were created in MIPAV (https://mipav.cit.nih.gov/). Cortical layers were computed using the equi-volume layering method5 from the CBS Tools (http://www.nitrc.org/projects/cbs-tools/).
Results and discussion
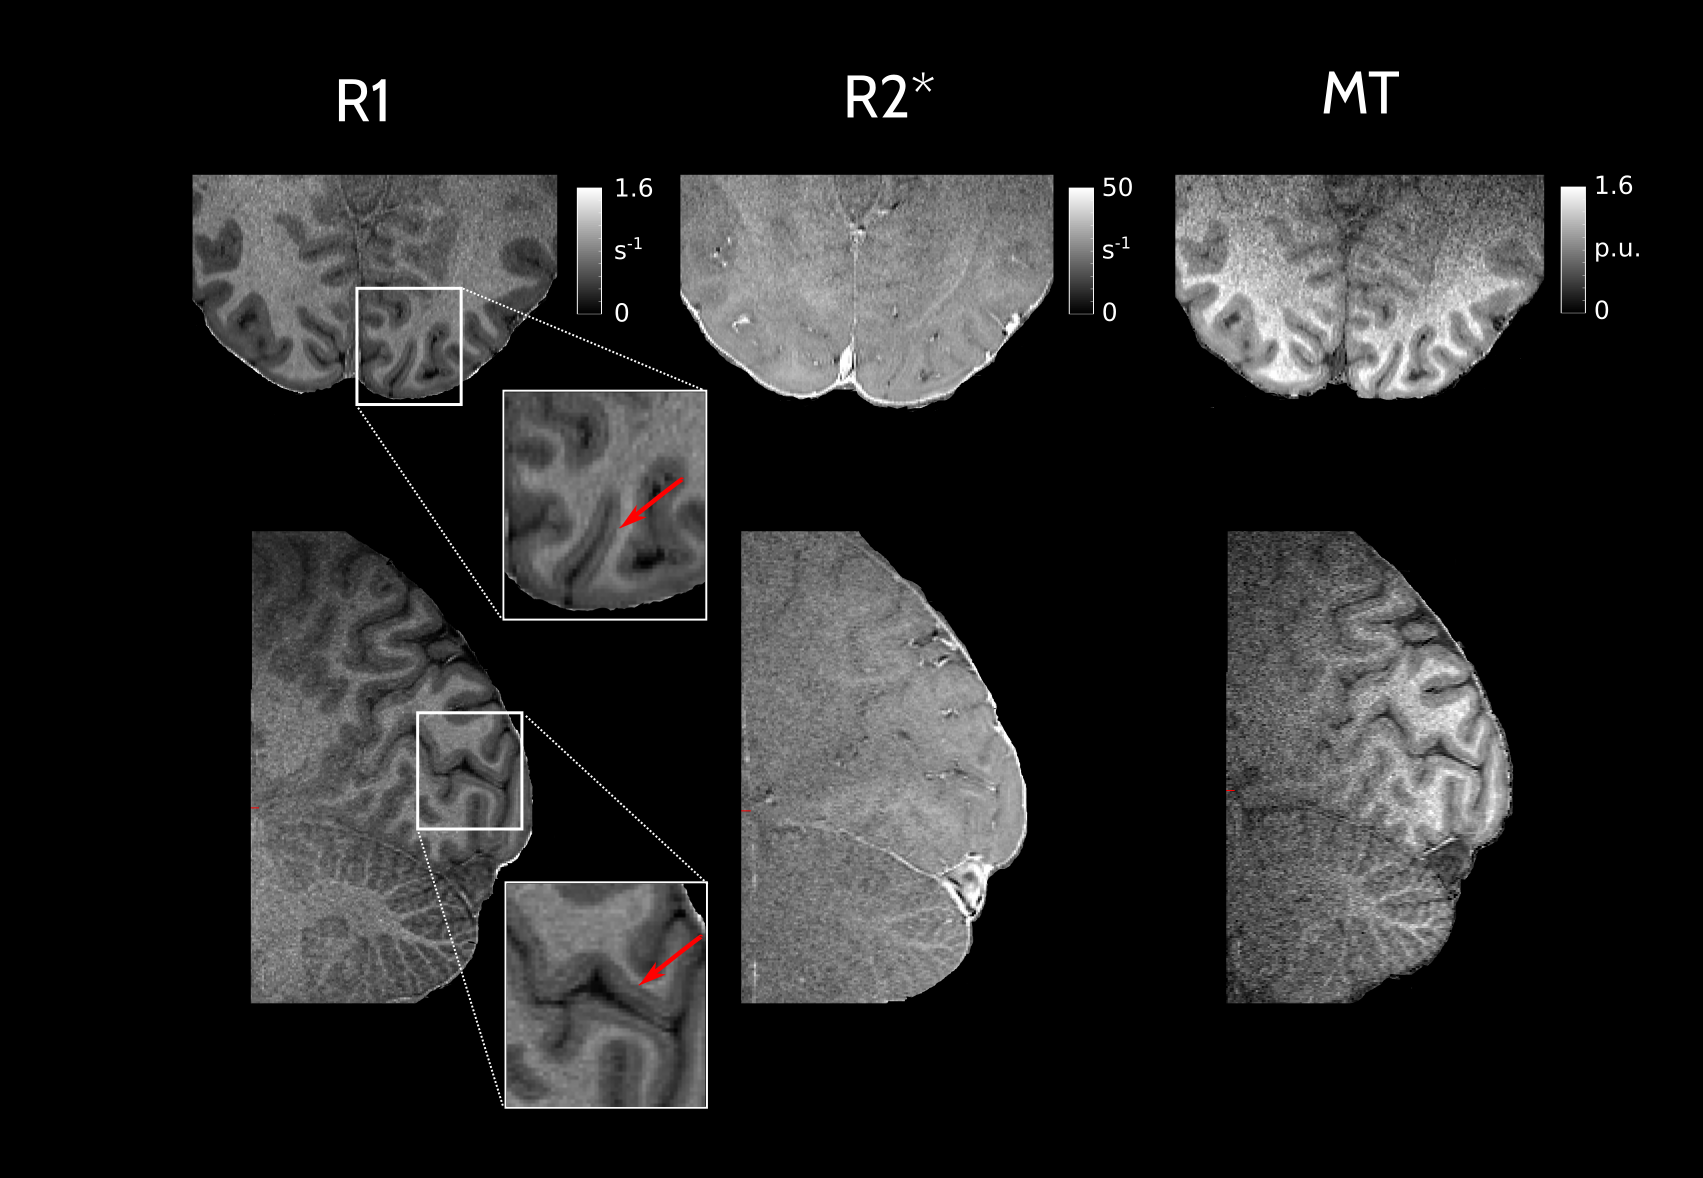
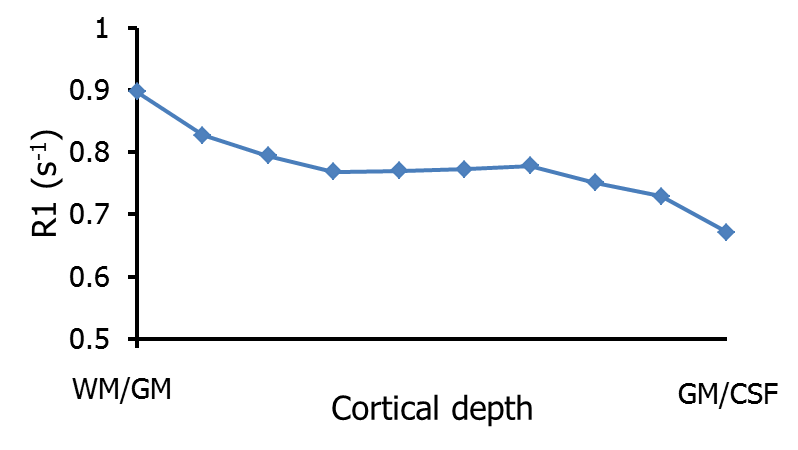
Sample maps of R1, R2* and MT are shown in Figure 2. The R1 maps showed a high contrast-to-noise ratio (CNR) across the targeted region, i.e., the occipital pole including the central primary visual cortex (V1). A clear delineation between grey and white matter was observed, with CNR decreasing with distance from the coil. The high resolution and CNR allowed for depiction of subtle intra-cortical features such as the highly myelinated line of Gennari in V1, which was conspicuous in most slices covering V1. Profiles of R1 with cortical depth in V1 (Figure 3) revealed changes in their values in the most central layers, corresponding to the higher myelination of the line of Gennari.Conclusion
The high resolution quantitative mapping of multiple physical parameters (R1, R2*, MT) offers promising insights into the cortical microstructure, particularly with regard to myelination and iron concentration6. The increase of resolution for characterising microstructure is mainly limited by SNR demands. By using a flexible surface coil array which matches the volunteer’s head, SNR was boosted in the (superficial) cortical region of interest and acquisition times could be reduced by limiting the field of view. We demonstrated the feasibility of a 0.5 mm isotropic mapping protocol at a clinical field strength widely available and without resorting to excessively long scan times.Acknowledgements
The research leading to these results has received funding from the European Research Council under the European Union's Seventh Framework Programme (FP7/2007-2013) / ERC grant agreement n° 616905. This project has received funding from the BMBF (01EW1711A & B) in the framework of ERA-NET NEURON.References
1. Trampel, R., Bazin, P-L., Pine, K. & Weiskopf, N. (in press). In-vivo magnetic resonance imaging (MRI) of laminae in the human cortex. Neuroimage. doi: 10.1016/j.neuroimage.2017.09.037
2. Weiskopf, N., Suckling, J., Williams, G., Correia, M.M., Inkster, B., Tait, R., Ooi, C., Bullmore, E.T. & Lutti, A. (2013). Quantitative multi-parameter mapping of R1, PD*, MT, and R2* at 3T: a multi-center validation. Front Neurosci, 7, 95.
3. Kriegl, R., Navarro de Lara, L., Pichler, M., Sieg, J., Moser, E., Windischberger, C. & Laistler, E. (2015). Flexible 23-Channel RF Coil Array for fMRI Studies of the Occipital Lobe at 3T. Proc. HBM, Honolulu, USA.
4. Lutti, A., Hutton, C., Finsterbusch, J., Helms, G. & Weiskopf, N. (2010). Optimization and validation of methods for mapping of the radiofrequency transmit field at 3T. Magn Reson Med, 64, 229–238.
5. Waehnert, M. D., Dinse,J., Weiss, M., Streicher, M.N., Waehnert, P., Geyer, S., Turner, R. & Bazin, P-L. (2014). Anatomically Motivated Modeling of Cortical Laminae. Neuroimage, 93, 2, 210–20.
6. Lutti, A., Dick, F., Sereno, M.I. & Weiskopf, N. (2014). Using high-resolution quantitative mapping of R1 as an index of cortical myelination. Neuroimage, 93, 2, 176–88.
Figures