2759
MAGNETIC SUSCEPTIBILITY OF HUMAN KNEE AT 7T USING ULTRASHORT ECHO MR DATA1Centre for Advanced Imaging, University of Queensland, Australia, Brisbane, Australia
Synopsis
Ultra-short echo time quantitative susceptibility mapping (QSM) is a promising tool for the study of tissues with short relaxation times. At ultra-high field, the reconstruction of quality phase images is challenging because of the absence of a reference coil. We propose the use of selective channel combination of phase-offset-corrected signal phase data for ultra-short echo time QSM. We compared our findings against an established channel combination method. Qualitative and quantitative analyses of combined phase and QSM images were performed at three echo times. Selective combination of individual channel phase images results in improved ultra-short echo time susceptibility maps.
Introduction
Susceptibility mapping is gaining increasing research interest because of its capability in evaluating variations in the chemical and physical composition of tissues.1,2,3 But its utility in bone imaging has been limited because bound water results in ultra-short relaxation times, and thus, low MRI signal intensity at conventionally used echo times in gradient recalled echo MRI.1,2 An ultra-short echo time study on the human knee at 3T showed that QSM has the capability of assessing bone mineral density.1 Other susceptibility studies using ultra-high field human and animal imaging techniques have demonstrated potential in studying damage to the meniscal and cartilage.2,4
At ultra-high fields, we have shown that voxel-wise selective channel combination of offset corrected multi-channel phase data can lead to improved quality combined phase images.5,6 This improvement is expected to result in improved QSM images. We propose a revised version of the selective channel phase combination method for producing QSM images at ultra-short echo times,revised method for a more robust selective channel combination of referred to as the General Utilisation of channel Selection algorithM for the reconstruction of multichAnnel MR Phase informatioN (GUSMAN).
Methods
A multi-echo PETRA (Pointwise Encoding Time Reduction with Radial Acquisition) scan was performed on a human knee on a whole-body 7T MRI research scanner (Siemens Healthcare, Erlangen, Germany) with a 28-channel knee coil (Siemens Healthcare, Erlangen, Germany) using the following parameters: $$$TE_1 = 0.07ms$$$, $$$TE_2 = 0.1ms$$$ and $$$TE_3 = 0.13ms$$$, $$$TR = 2.12ms$$$, flip angle $$$= 2^o$$$, voxel size $$$= 1mm \times 1mm \times 1mm$$$ and matrix size $$$= 288 \times 288 \times 288$$$ .
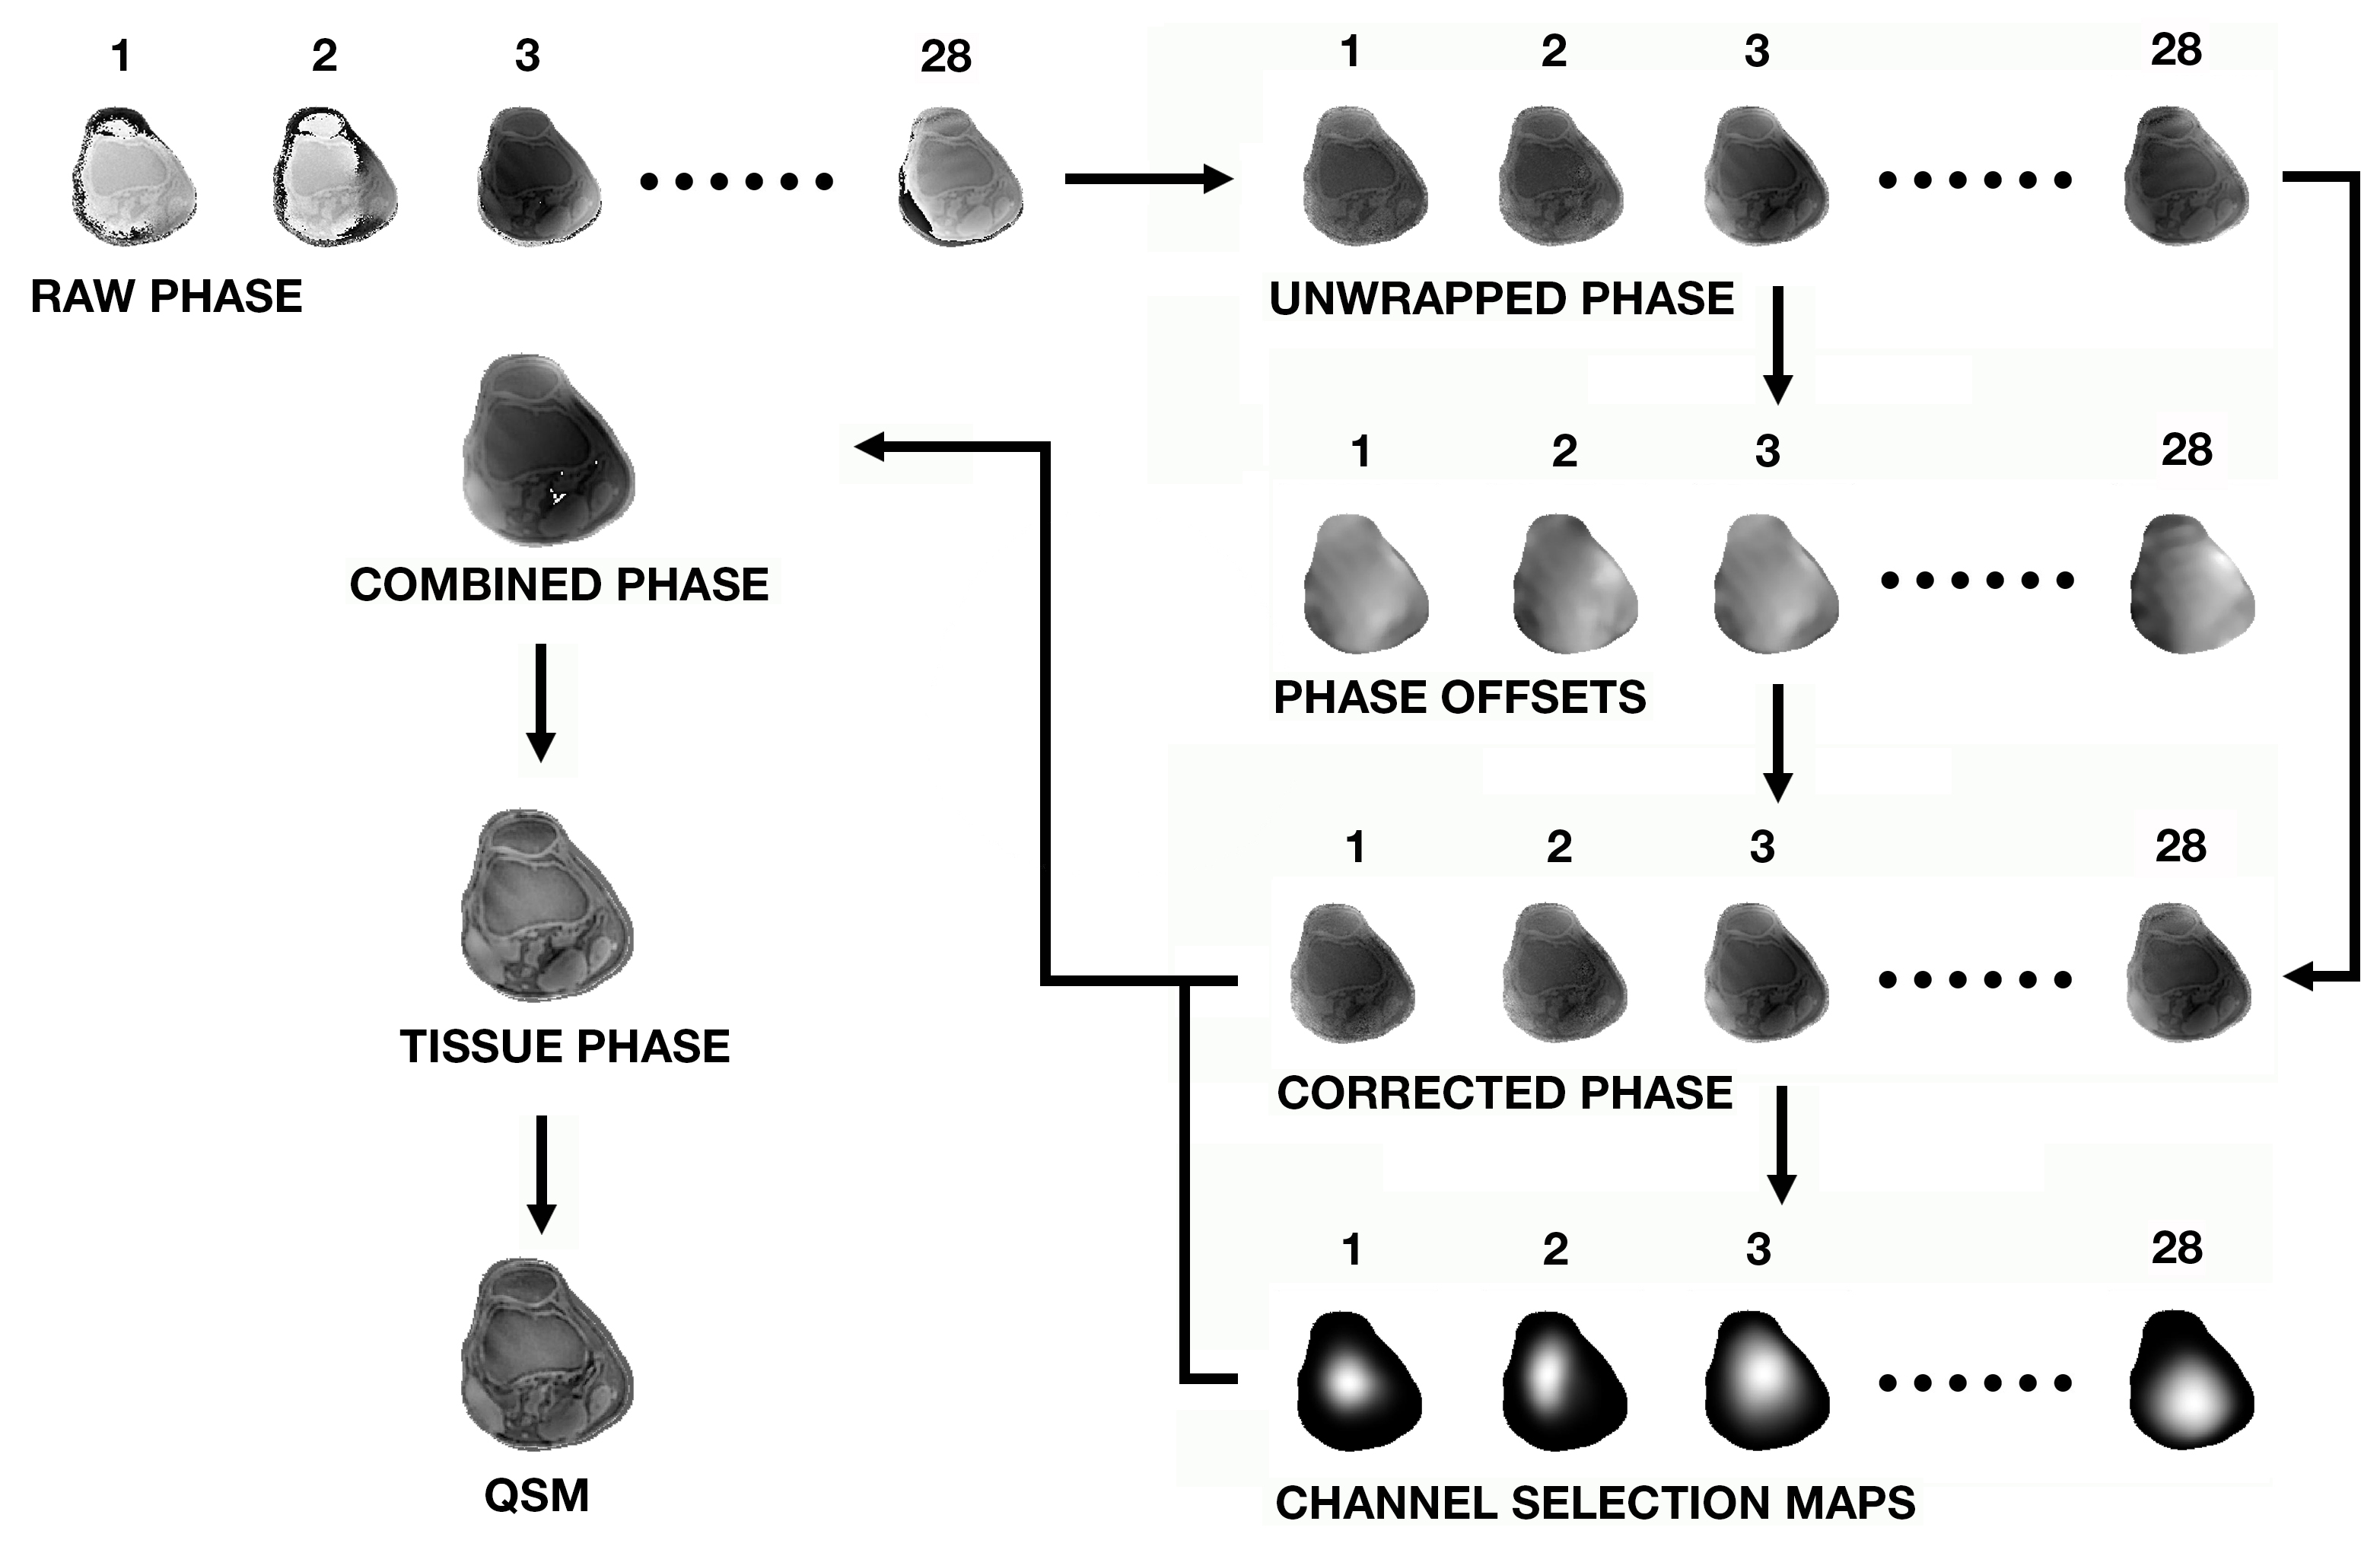
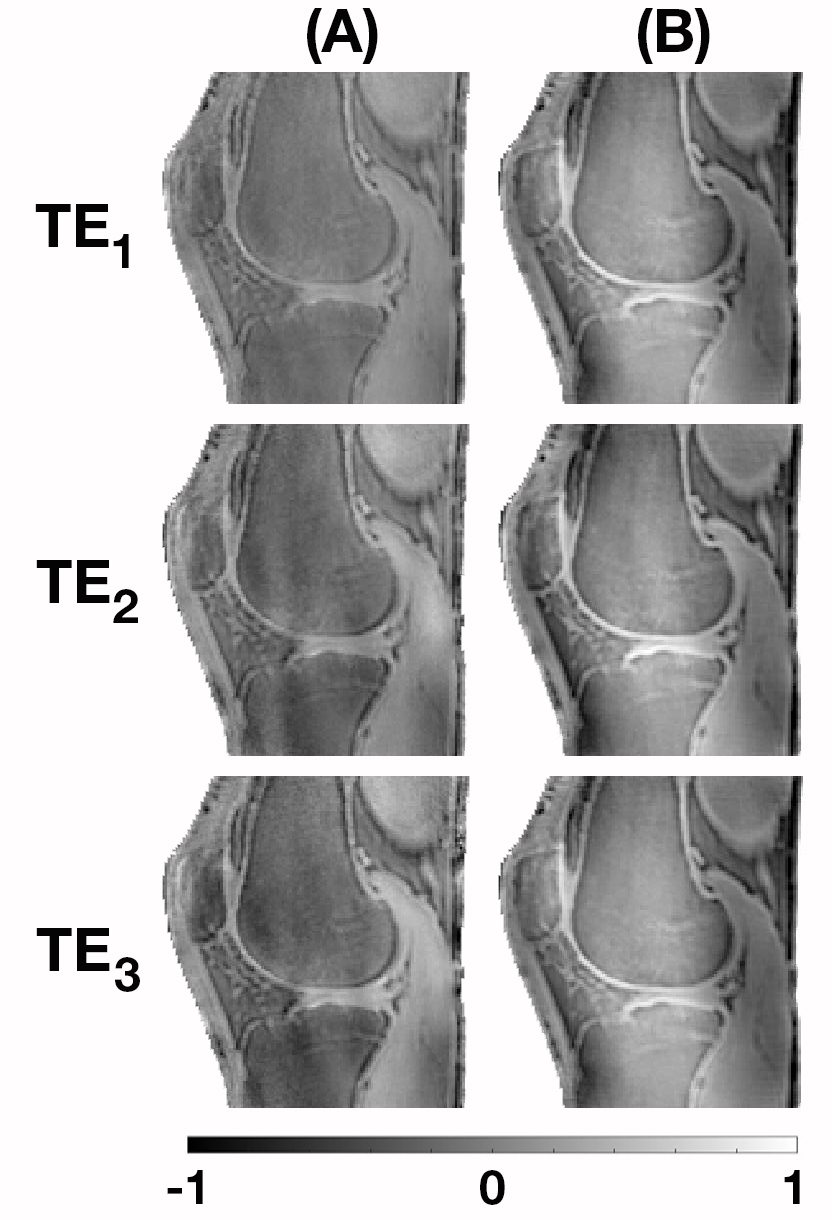
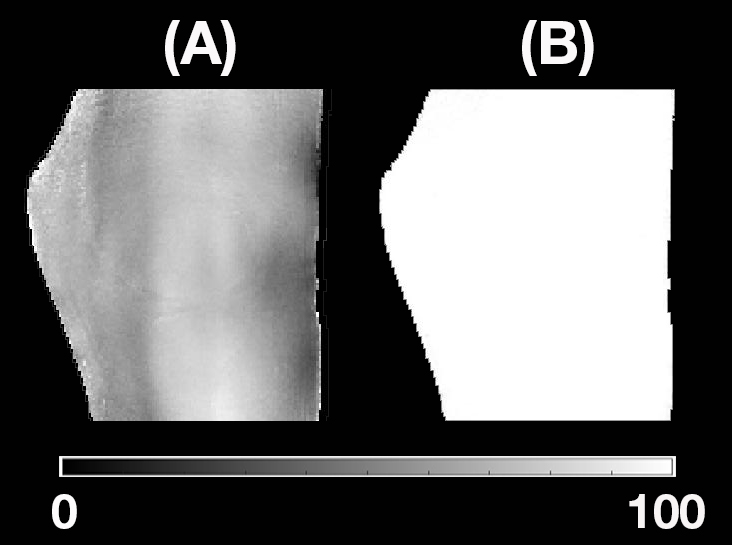
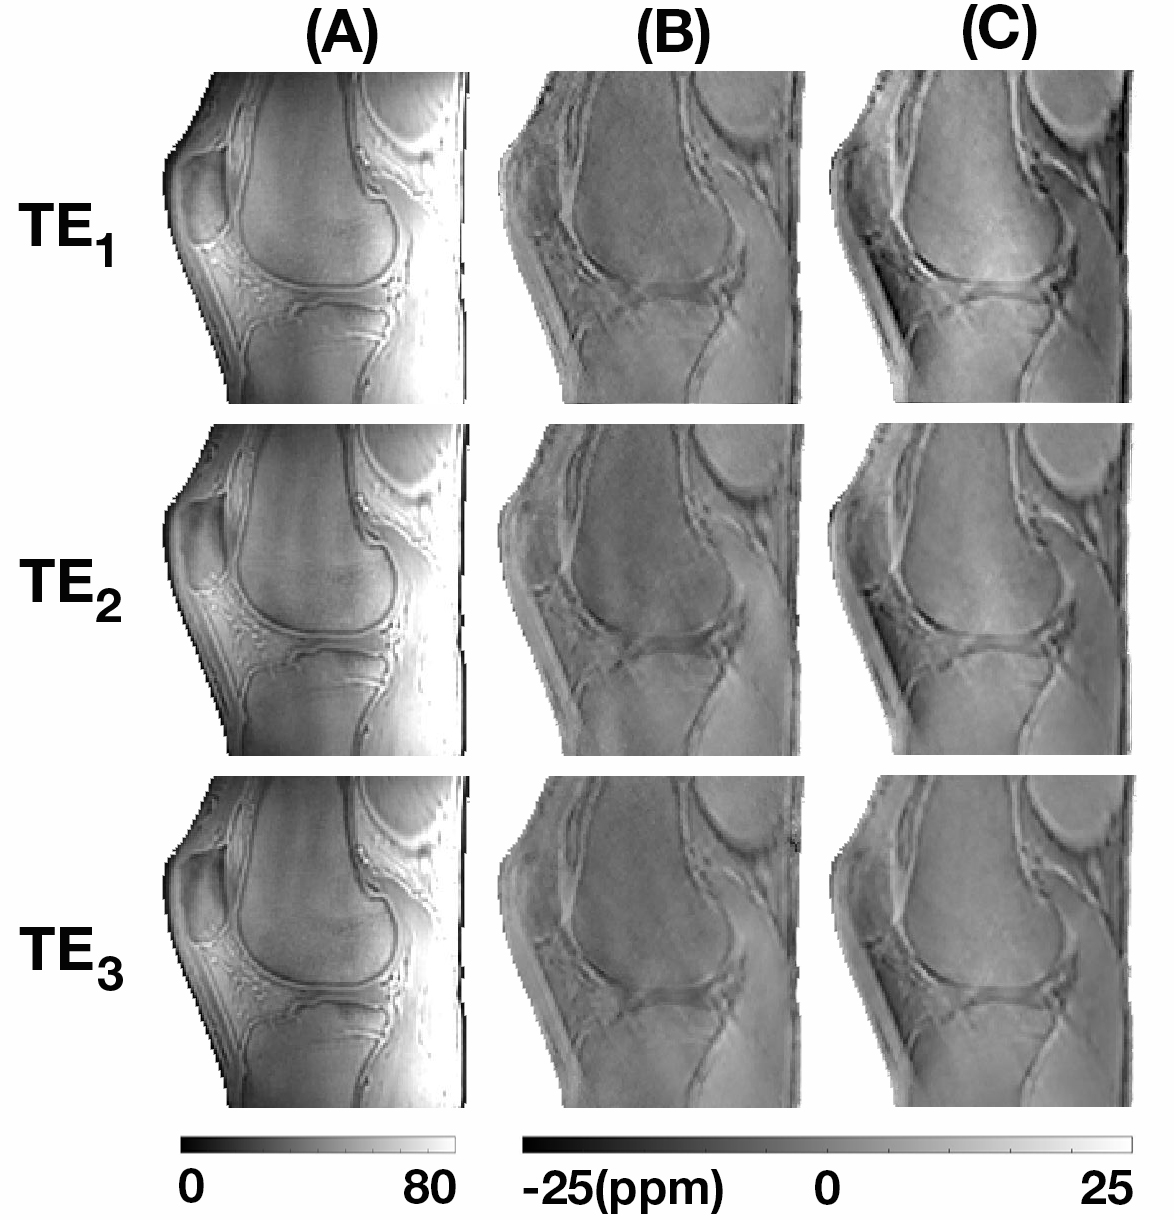
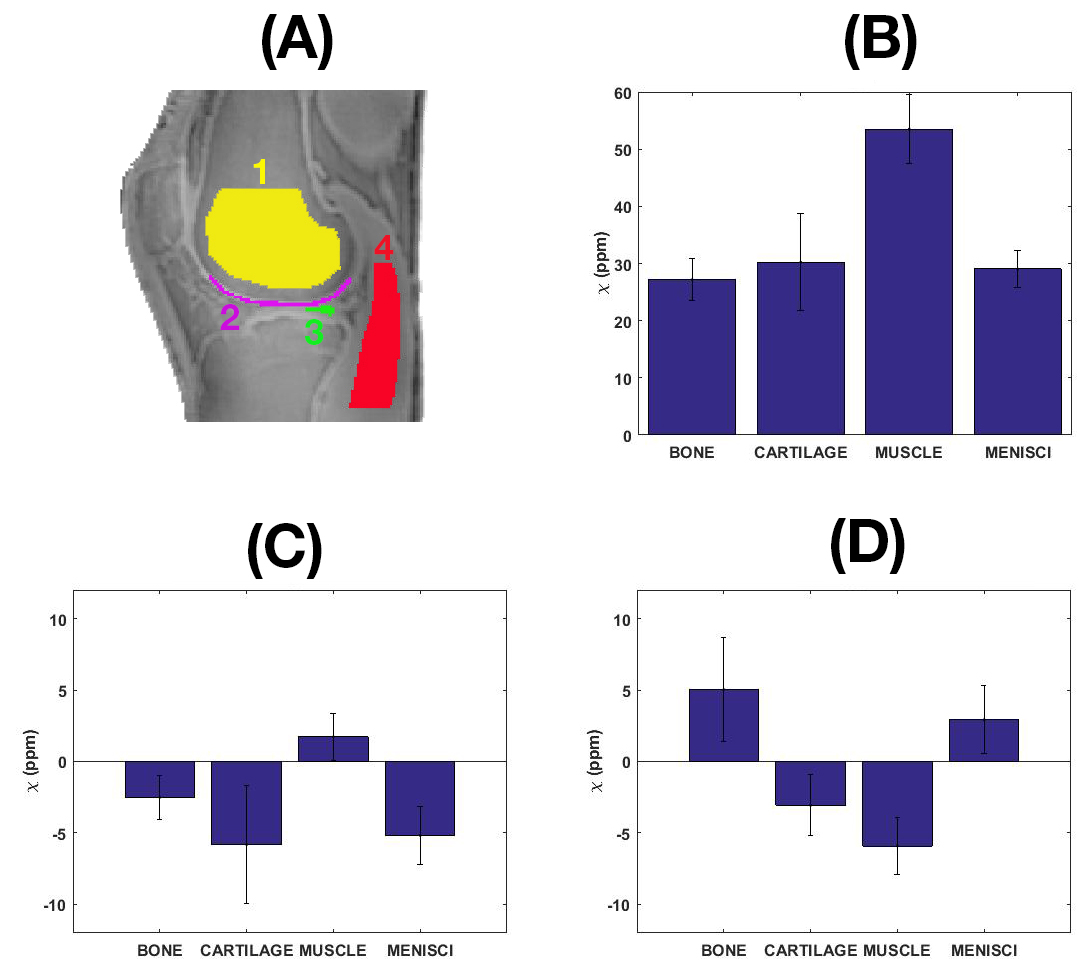
Fig. 1 shows the GUSMAN pipeline which differs from our previous work by having changed the phase offset correction method from the one used in MCPC-3D to the virtual reference coil method.6,7,8 The phase of a specific channel (we used channel 3) was chosen as the reference channel. The difference between each channel phase and the reference channel phase was median filtered, the result of which was relative phase offsets for each channel. These were then subtracted from each channel phase to obtain inter-channel offset corrected multi-channel phase images. The offset corrected individual channel phases were subtracted to obtain phase noise images, their standard deviation was calculated, and the result was Gaussian filtered to obtain the selection matrix for each channel. The voxel phase in the combined phase image was calculated by averaging based on the channel ranking provided by channel selection matrix entries. Tissue phase maps and QSM images were obtained from the combined phase images using the STI Suite.9,10 We used this process to produce results at the three echo times. Results were compared with those from MCPC-3D, a method which addresses both offset correction and phase combination of ultra-high field data in the dephasing regime.8 Scripts were implemented in MATLAB®. Q-maps were computed to quantify phase image quality.11 The magnitude and QSM values of voxels in bone, cartilage, muscle and menisci were studied. Student t-test was performed to determine significant differences in signal magnitude and QSM values between tissue classes.
Results
The combined phase images reconstructed using MCPC-3D and GUSMAN are shown in Fig. 2 and the second echo time Q-maps are shown in Fig. 3. The magnitude and QSM images are depicted in Fig. 4. The ROIs used and the average magnitude and QSM values for bone, cartilage, muscle and meniscI are shown in Fig. 5. The t-test analyses concludes that magnitude and MCPC-3D QSM mean values for cartilage and menisci are the only ones not significantly different (p<0.05).Discussion
GUSMAN in the application of knee imaging is shown to produce qualitative (Fig. 2) and quantitative (Fig. 3) improvements in combined phase images in comparison to MCPC-3D. It also removes residual offsets present with selective combine of phase images.6 This enhancement in phase quality, in turn, resulted in better QSM images. Fig. 5 shows that the polarity and magnitude of QSM values has more potential in differentiating tissue types as compared to MCPC-3D QSM and magnitude values. Average QSM values shown in Fig. 5(D) are consistent with those reported by Wei et al, wherein longer echo time data was used to analyse the same tissue types but not bone.2 Results also show that QSM values depend on the chosen phase reconstruction method and, the creation of noise optimal phase images is essential for computing informative susceptibility maps.Conslusion
We have shown qualitatively and quantitatively that the selective channel combination of phase data can result in improved combined phase images and better susceptibility mapping in the ultra-short echo time regime of imaging.Acknowledgements
The authors acknowledge the facilities of the National Imaging Facility at the Centre for Advanced Imaging, University of Queensland. We also acknowledge funding from the Australian Research Council (DP140103593).References
1. Dimov AV, Liu Z, Spincemaille P, Prince MR, Du J, Wang Y. Bone quantitative susceptibility mapping using a chemical species–specific R2* signal model with ultrashort and conventional echo data. Magnetic Resonance in Medicine. 2017 Mar 1.
2. Wei H, Dibb R, Decker K, Wang N, Zhang Y, Zong X, Lin W, Nissman DB, Liu C. Investigating magnetic susceptibility of human knee joint at 7 tesla. Magnetic resonance in medicine. 2017 Jan 1.
3. Sood S, Urriola J, Reutens D, O’Brien K, Bollmann S, Barth M, Vegh V. Echo time‐dependent quantitative susceptibility mapping contains information on tissue properties. Magnetic Resonance in Medicine. 2016 May 1.
4. Wang L, Nissi MJ, Toth F, Johnson CP, Garwood M, Carlson CS, Ellermann J. Quantitative susceptibility mapping detects abnormalities in cartilage canals in a goat model of preclinical osteochondritis dissecans. Magnetic resonance in medicine. 2017 Mar 1;77(3):1276-83.
5. Vegh V, O'Brien K, Barth M, Reutens DC. Selective channel combination of MRI signal phase. Magnetic resonance in medicine. 2015 Nov 1.
6. Abdulla S, Reutens D, O’Brien K, Vegh V. Selective Channel Combination of 3D Phase Offset Corrected 7T MRI Phase Images. 25th Annual Meeting of ISMRM, Hawaii, US, 2017. Abstract 1527.
7. Parker DL, Payne A, Todd N, Hadley JR. Phase reconstruction from multiple coil data using a virtual reference coil. Magnetic resonance in medicine. 2014 Aug 1;72(2):563-9.
8. Robinson S, Grabner G, Witoszynskyj S, Trattnig S. Combining phase images from multi‐channel RF coils using 3D phase offset maps derived from a dual‐echo scan. Magnetic resonance in medicine. 2011 Jun 1;65(6):1638-48.
9. Smith SM, Jenkinson M, Woolrich MW, Beckmann CF, Behrens TE, Johansen-Berg H, Bannister PR, De Luca M, Drobnjak I, Flitney DE, Niazy RK. Advances in functional and structural MR image analysis and implementation as FSL. Neuroimage. 2004 Dec 31;23:S208-19.
10. Li W, Avram AV, Wu B, Xiao X, Liu C. Integrated Laplacian‐based phase unwrapping and background phase removal for quantitative susceptibility mapping. NMR in Biomedicine. 2014;27(2): 219-27.
11. Robinson SD, Bredies K, Khabipova D, Dymerska B, Marques JP, Schweser F. An illustrated comparison of processing methods for MR phase imaging and QSM: combining array coil signals and phase unwrapping. NMR in Biomedicine. 2016 Jan 1.
Figures