2757
Evaluation of Marchenko-Pastur PCA denoising on Multi-Exponential Relaxometry1Biomedical Engineering, Vanderbilt University, Nashville, TN, United States, 2Aarhus University, Aarhus, Denmark, 3Vanderbilt University, Nashville, TN, United States, 4Champalimaud Centre for the Unknown, Lisbon, Portugal
Synopsis
MRI relaxometry is a powerful tool for characterizing tissue at the sub-voxel level, such as for myelin water imaging. However, a major impediment to its use is the high signal-to-noise ratio requirement. Here, we propose Marchenko-Pastur principal component analysis—previously proposed for diffusion MRI—to denoise relaxometry data. Experimental studies and simulations exemplify the utility of this denoising, and its potential to accelerate data acquisition by 6-8X or more without bias in fitted relaxometry measures or degradation of image resolution. This simple yet important denoising step thus paves the way for broader applicability of relaxometry.
Introduction
MRI relaxometry, including multi-exponential T2 analysis, as well as quantitative T1 or T2* mapping, can characterize the microstructure and composition of tissue with high specificity. However, the ill-posed nature of inverting a signal into a sum of exponential functions—a numerical inverse Laplace transform—results in high signal-to-noise ratio (SNR) requirements. Consequently, multi-exponential relaxometry invariably requires long scan times and/or low spatial resolution, neither of which is desirable. However, relaxometry data typically contains redundancy; meaning that it involves more samples (e.g., different echo times) than distinct signal components1. Recently, Veraart et al. presented the Marchenko-Pastur principal component analysis (MP-PCA) technique for denoising diffusion weighted images2. Here we evaluate the same method for denoising relaxometry data. The MP-PCA method takes advantage of the separation of signal eigenvalues from noise eigenvalues following transformation of the data into the principal component basis; any random (Johnson) noise can then be associated with the MP eigenvalue distribution, which can be easily identified for SNR>2. Upon nulling the MP distribution eigenvalues, the signal is significantly denoised, without blurring, smoothing, or other negative effects2.Methods
MRI experiments. Animal experiments were approved by the institutional committee in adherence to EU and national law. An excised and chemically fixed rat spinal cord was imaged in a 5 mm NMR tube using a 16.4 T Bruker Aeon Ascend scanner. A single-slice multiple spin echo (MSE) sequence was executed with 50x50x500 (µm)3 resolution, refocusing-to-excitation bandwidth ratio = 6.67, 90 echoes acquired with 2.1 ms intervals from 2.7 ms, TR = 1800 ms, and number of averages (NA) = 2 or 16.
Data analysis. Images underwent MP-PCA denoising over a moving 9x9 region using in-house written code. Both original and denoised data were then fitted, voxelwise, to spectra of 100 components with T2 values log-spaced between 2 and 190 ms; spectra were smoothed by minimum-curvature constraint; and extended phase graph analysis accounted for any B1+ inhomogeneity. From each spectrum the myelin water fraction (MWF) was computed as the fraction of signal from components with peak T2 < 17 ms.
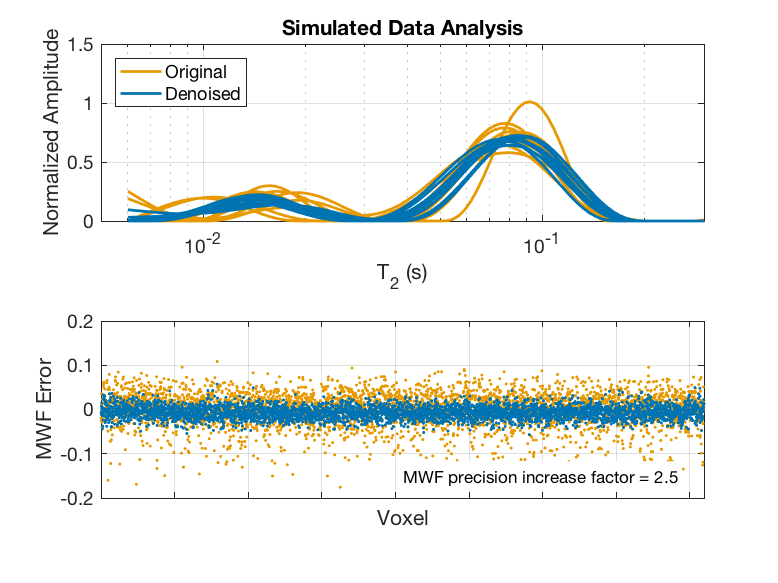
Simulations. To mimic human white matter MRI, a model MSE dataset (40 echoes, 8 ms echo spacing) was generated over a 64x64 image. The signals had two gaussian-shaped (in the log-T2 domain; width = 0.57 Np) components, with randomly assigned signal fractions (fa = 0.2 ± 0.02, fb = 1-fa) and peak T2 values (T2a = 15 ms ± 1 ms; T2b = 80 ms ± 5 ms). Gaussian noise was added such that SNR = 200, and then the images were denoised with MP-PCA. The MSE signal from each voxel in the noisy and denoised datasets was then fitted to a T2 spectrum as described above, using T2 < 25 ms as the MWF cut-off.
Results and Discussion
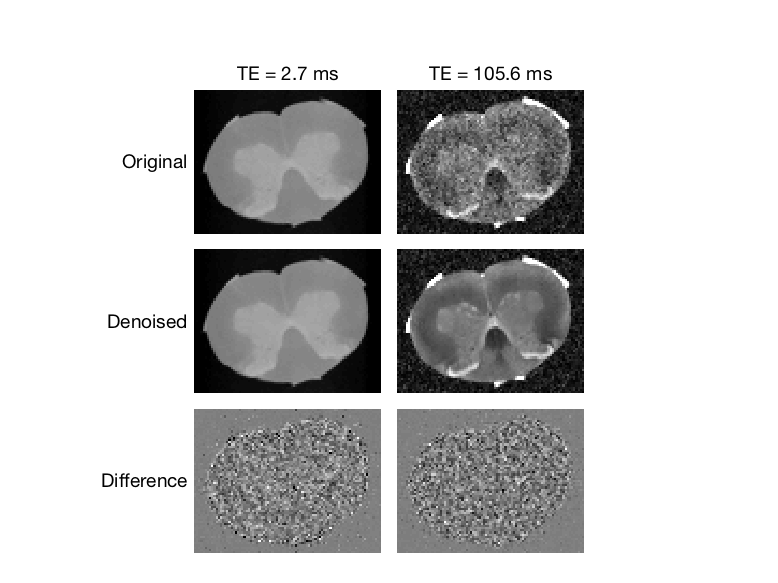
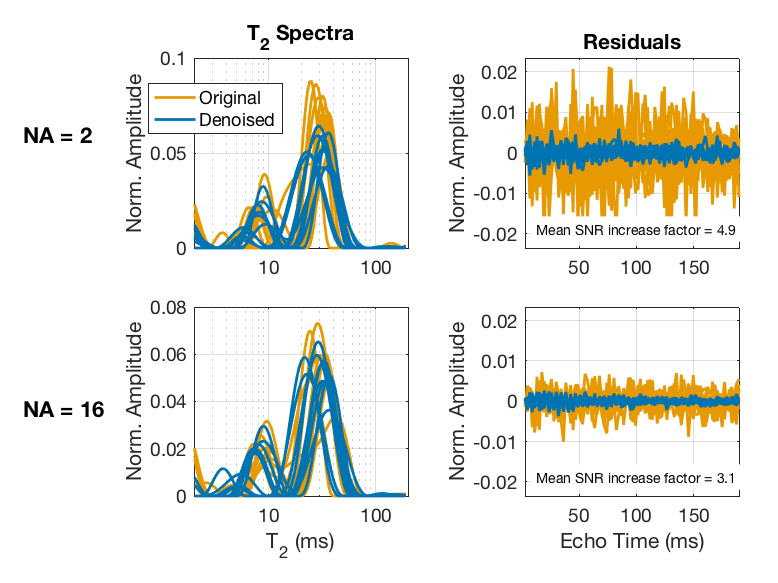
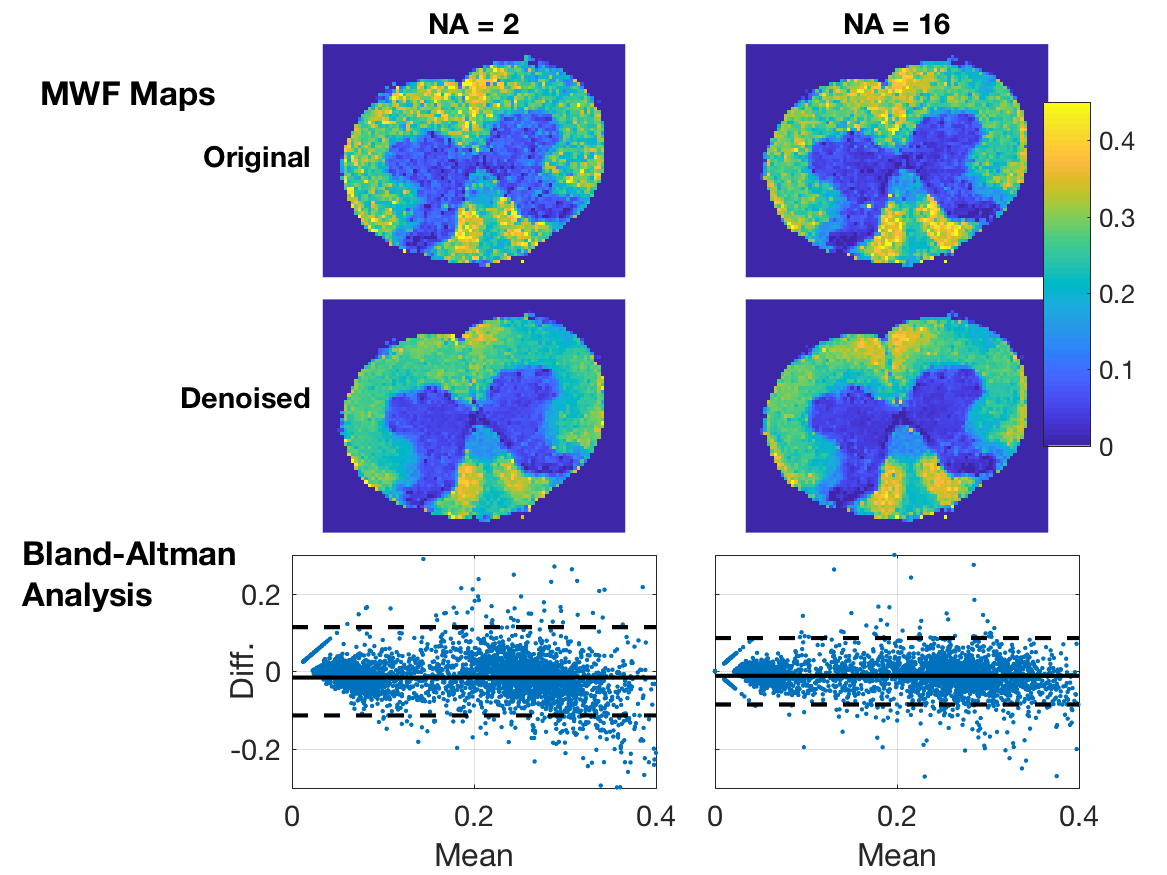
Example MSE images (NA=2) are shown in Fig 1 for two TEs; original, denoised, and the difference images are shown. The impact of denoising on image quality is especially noticeable at the later TE, but in both cases the difference image shows only random noise, suggesting that no signal components were removed. Figure 2 shows fitted T2 spectra and corresponding residuals for 10 example voxels, for both the NA=2 and NA=16 scans. Defining SNR as the signal amplitude at TE=0 (sum of the T2 spectrum) divided by the standard deviation of the residuals, this figure reports ≈5X increase in SNR resulting from the MP-PCA denoising for NA=2 data. The value of denoising is reduced somewhat for NA=16 data because, at this high initial SNR, the non-random contributions to the noise becomes relatively more important. The impact of the MP-PCA denoising on MWF measurement is demonstrated in Figs 3 and 4. The MWF maps from denoised NA=2 data are smoother than the original NA=16 map, without an apparent blurring of anatomy, suggesting a potential acceleration of at least 8X. Likewise, the simulation studies, meant to mimic human brain myelin imaging at 3 T, demonstrate ≈2.5X lower SD in MWF after denoising, suggesting a potential acquisition acceleration of ≈6X. Finally, it is worth noting that MP-PCA is valid for any kind of redundant data, such as T1 or T2* relaxometry, or qMT experiments, and we have been able to observe a similar denoising performance for these methods as well (data not shown).Conclusions
MP-PCA can harness the inherent redundancy in relaxometry data to significantly enhance SNR and thus to accelerate scan time and/or permit increased spatial resolution. This advancement may be crucial for translating MRI relaxometry into more routine clinical applications.Acknowledgements
All authors thank Dr. Daniel Nunes for specimen extraction. This study was supported by the European Research Council (ERC) under the European Union’s Horizon 2020 research and innovation programme (Starting Grant, agreement No. 679058), the Danish National Research Foundation (CFIN), the Danish Ministry of Science, Innovation, and Education (MINDLab), and the National Institutes of Health (EB019980).References
1. Istratov, A.A. & Vyvenko, O.F., 1999. Exponential analysis in physical phenomena. Review of Scientific Instruments, 70(2), pp.1233–1257.
2. Veraart, J. et al., 2016. Denoising of diffusion MRI using random matrix theory. Neuroimage, 142, pp.394–406
Figures