2756
Multiple dynamics gradient-echo EPI acquisitions for quantitative susceptibility mapping1Physics and Astronomy, University of British Columbia, Vancouver, BC, Canada, 2UBC MRI Research Centre, University of British Columbia, Vancouver, BC, Canada, 3Pediatrics, University of British Columbia, Vancouver, BC, Canada, 4BC Children's Research Centre, University of British Columbia, Vancouver, BC, Canada
Synopsis
In this work we demonstrate the feasibility to utilize EPI read-out schemes in combination with multiple dynamics to acquire multi-echo like data sets with the freedom of variable echo times, allowing to acquire fast, high-resolution quantitative susceptibility maps (QSM) images. Assessing the quality of the QSM scans in a region-of-interest based analysis as well as via structural and feature similarities we observed high qualitative and quantitative agreement between QSM images from multi-dynamic EPI acquisitions and multi-echo gradient echo scans.
Introduction
R2*, quantitative susceptibility maps (QSM) as well as susceptibility-weighted images are all derived from multi-echo gradient-echo (MGRE) images and provide high spatial resolution and excellent signal-to-noise at comparably short acquisition times. The acquisitions use traditionally short TR and low flip angles with TEs depending on the desired application. Multi-echo data are preferred to measure R2*, average the signal across echoes for improved SNR1 and to perform field mapping based on the phase evolution with TE. The ability to provide quantitative tissue assessments propelled the use of these tools in research studies and clinical applications to multiple sclerosis (MS)2,3,4. However, to include MGRE sequences into clinical practice, for instance for the detection of central veins in MS lesions5, faster acquisition of high-resolution MGRE data needs to be facilitated. Single-echo echo-planar-imaging (EPI) schemes have been suggested in the past6,7. However, R2* and QSM, are necessary to disentangle the contributions from iron and demyelination, which both play a role in neurodegenerative diseases. Here, we expanded a 3D T2*-weighted imaging scheme with in-plane EPI readout8 to facilitate multi-echo data acquisition. We compared the QSM images from this multi-dynamics EPI based approach with MGRE-QSM.Methods
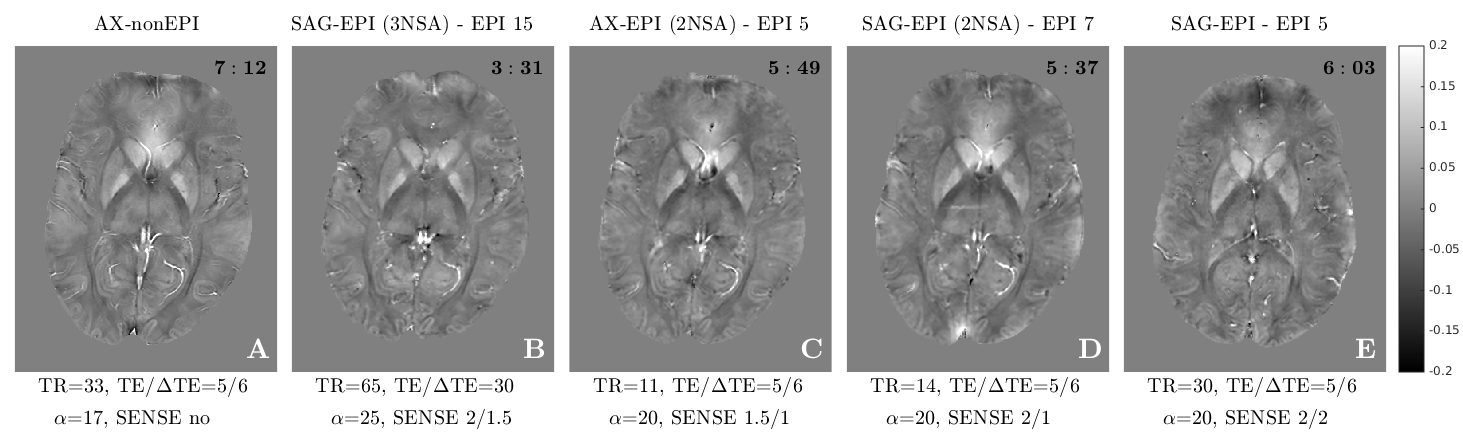
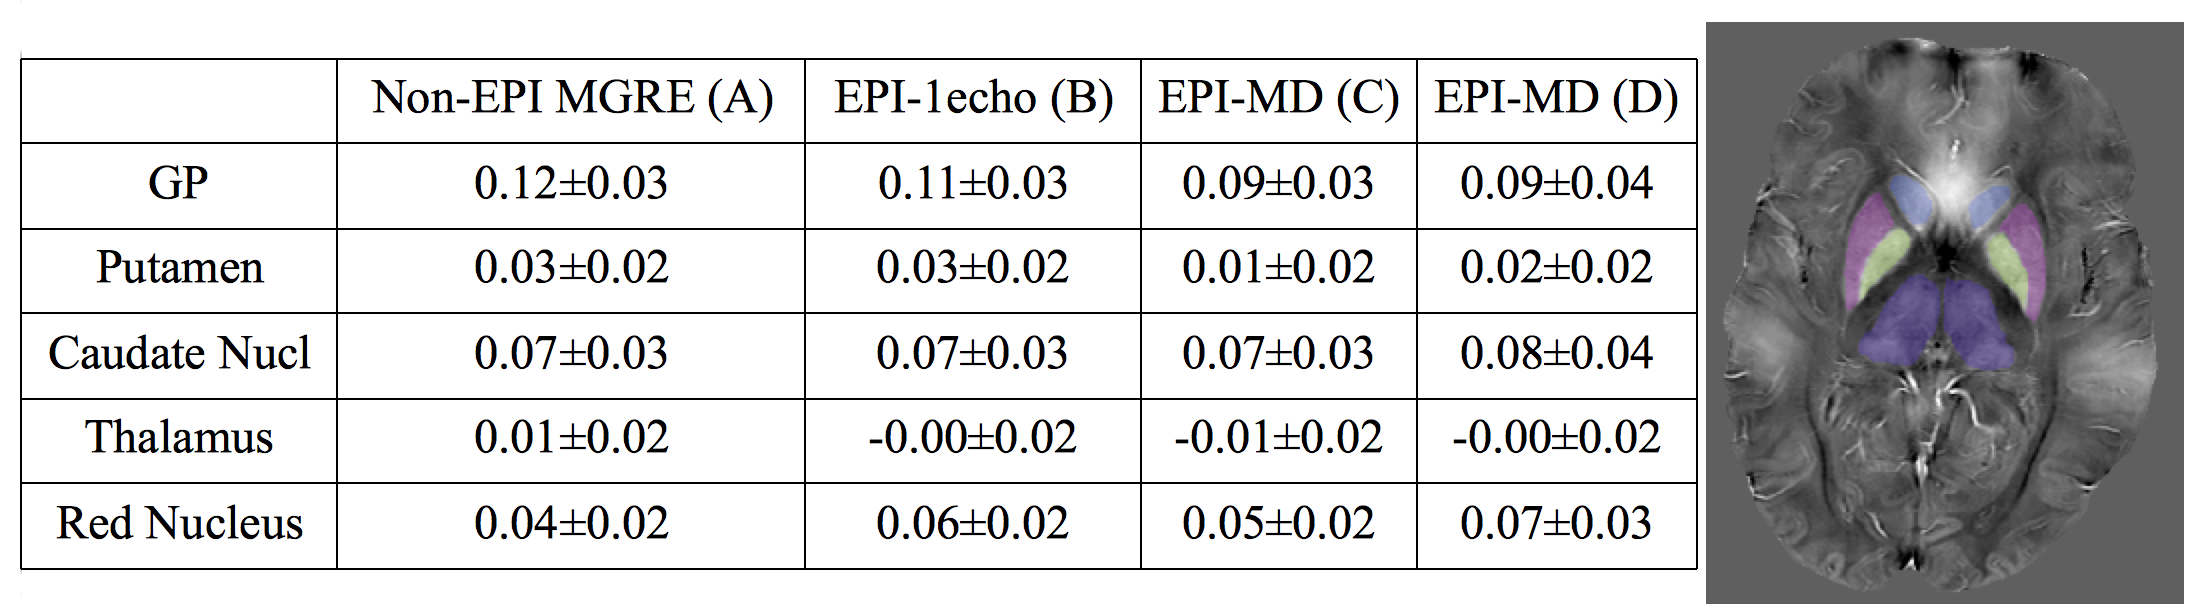
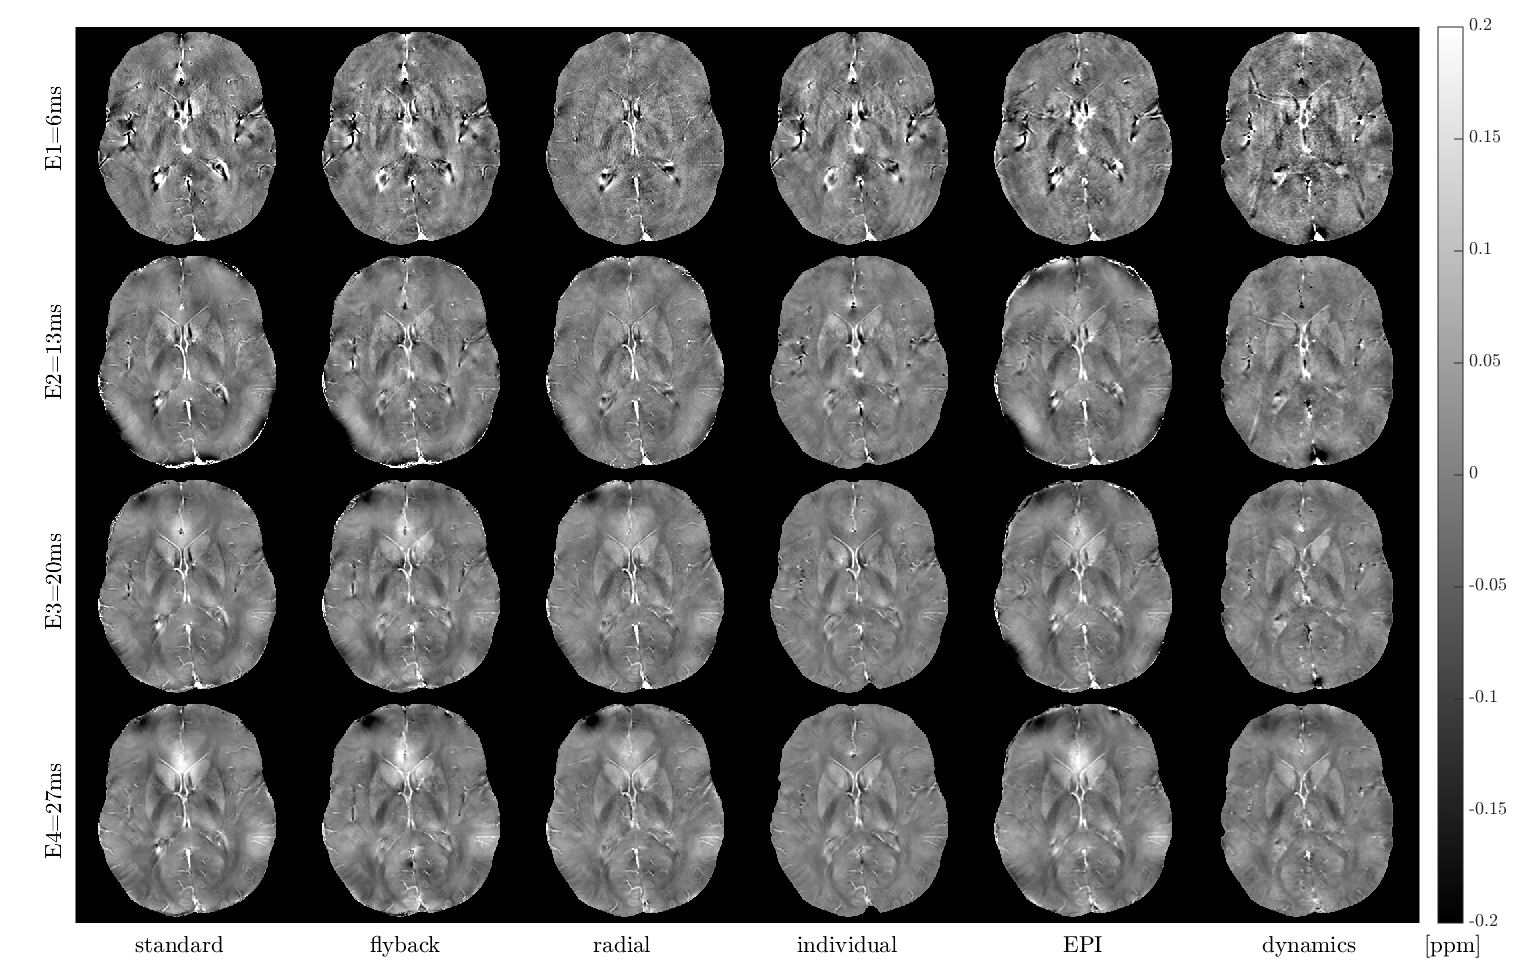
A standard GRE sequence was modified to acquire multiple dynamics (MD), similar to functional MR data acquisition schemes, rather than multiple echoes. We assigned a user defined, delayed TE to each dynamic to emulate a multi-echo readout. To reduce artifacts, we employed a multi-shot sequence similar to [8], while allowing for MD. To evaluate the quality of the EPI-based sequences, we acquired a transverse MGRE with 5 echoes (vxl size=0.5x0.75x2mm3, reconstructed 0.5x0.5x1mm3, flip angle=17, TR=33ms, TE/ΔTE=5/6ms), the previously suggested single-echo, sagittal EPI (vxl size=0.6x0.75x1mm3, reconstructed 0.5x0.5x0.5mm3, flip angle=25, TR=65ms, TE=30ms) and MD-EPI scans with varying imaging parameters (displayed in Fig. 1). Furthermore, in another healthy volunteer we acquired for comparison 4-echo overcontiguous data using an MGRE with bipolar, unipolar and radial read-out, the scanner provided MGRE with EPI readout, individual GRE echoes and MD-EPI data. Data acquisition was kept as closely matched as possible (acq. vxl size=0.75x0.81x1mm3, recon. 0.55x0.55x1mm3, TR/TE/ΔTE=35/6/7ms, FOV=175x175x100mm3). For the chosen echo times, the scanner provided MGRE-EPI required to reduce the voxel size to 0.9x0.8x1mm3. QSM images were calculated from all data using an in-house developed algorithm that employs a two-step solution of first the well-conditioned k-space, followed by a total variation minimization to obtain the information in ill-conditioned k-space regions9. Data was prepared for dipole inversion by Laplacian unwrapping10 followed by V-SHARP10. Quality of all EPI vs multi-echo GRE QSM images was assessed by measuring the Structural Similarity Index11, a perception-based error assessment, and the Feature Similarity Index, which assesses image phase congruency and gradient magnitude12. We further compared QSM values in five manually defined regions-of-interest to determine the validity of the data for quantitative analysis. For all multi-echo/dynamic images, the average over the last three echoes was calculated.Results
Sagittal and transverse MD-data provided high-resolution QSM images and comparable signal-to-noise ratio (SNR) to MGRE, if at least 2 averages (NSA) were acquired per dynamic (Fig. 1). The MD-EPI images (Fig. 1C,D) were acquired with two NSAs at 1mm3 isotropic resolution, reconstructed to 0.5x0.5x1mm3, while the single-average EPI image, acquired at higher resolution (0.8x0.94x0.8mm3, reconstructed 0.51x0.51x0.8mm3), provided insufficient SNR. Also note the distortion in (B) in the frontal brain area resulting from the high EPI factor. Feature similarity and structural similarity scores for all QSM images in Fig. 1 were greater than 0.86 and 0.82, respectively. No quantitative differences between the sequences were noticeable in terms of regional QSM values (Fig. 2). Lastly, the comparison of the susceptibility maps by echo time from the single volunteer data set described above are shown in Fig. 3. As expected, early echoes are noisier and exhibit less white-gray matter contrast. Particularly the two later echoes are highly comparable, except for remaining susceptibility boundary artifacts. Small differences in SNR may originate from different voxel sizes.Discussion
The proposed MD-EPI approach avoids the problem of bipolar read-out schemes common to MGRE acquisitions and provide qualitative and quantitatively similar QSM maps to the standard acquisition approach. The proposed scheme allows fast, high resolution image acquisition at short echo times and spacing, ideal for the assessment of myelin, whose signal decays rapidly. Further acceleration can be achieved by integrating undersampling in the MD-EPI approach.Conclusions
We demonstrated the feasibility of using MD-EPI based acquisitions for QSM that provide high-resolution images within the same time frame as MGRE acquisitions. At high feature similarity and quantitative agreement of regional magnetic susceptibilities MD-EPI acquisitions overcome some limitations set by MGRE-EPI.Acknowledgements
VW received graduate studentship support from the MS Society of Canada.References
[1] Denk and Rauscher, (2010), 'Susceptibility weighted imaging with multiple echoes', J Magn Res Imag 31(1),185-191.
[2] Langkammer, C. et al. (2013), 'Quantitative susceptibility mapping in multiple sclerosis', Radiology 267(2), 551-559.
[3] Khalil, M. et al. (2011), 'Determinants of brain iron in multiple sclerosis', Neurology 77(18), 1691-1697.
[4] Yao, B. et al. (2012), 'Chronic multiple sclerosis lesions: Characterization with high-field strength MR imaging', Radiology 262(1), 206-215.
[5] Sati, P. et al. (2016), 'The central vein sign and its clinical evaluation for the diagnosis of multiple sclerosis: a consensus statement from the North American Imaging in Multiple Sclerosis Cooperative', Nature Reviews Neurology 12, 714-722.
[6] Sun, H. and Wilman, A.H. (2015), 'Quantitative Susceptibility Mapping using Single Shot Echo Planar Imaging', Magn Reson Med 73(5), 1932–1938.
[7] Wei, H. et al. (2016), 'Joint 2D and 3D phase processing for quantitative susceptibility mapping: application to 2D echo-planar imaging', NMR in Biomed, DOI: 10.1002/nbm.3501.
[8] Sati, P. et al. (2014), 'Rapid, high-resolution, whole-brain susceptibility-based MRI of multiple sclerosis', MSJ 20(11), 1464-1470.
[9] Kames, C. et al. (2016), 'Rapid two-step QSM without a priori information', Proc Intl Soc Mag Reson Med 24, p. 256, Singapore.
[10] Li, W. et al. (2011), 'Quantitative susceptibility mapping of human brain reflects spatial variation in tissue composition', NeuroImage 55(4), 1645-1656.
[11] Zhou, Z. et al., (2004), 'Image Quality Assessment: From Error Visibility to Structural Similarity'. IEEE Trans Image Processing, 13(4), 600-612.
[12] Zhang, L. et al. (2011), 'FSIM: A Feature Similarity Index for Image Quality Assessment', IEEE Trans Image Processing 20(8), 2378-2386.
Figures