2755
Predicting Histological Stainings of Brain Tissue from MRI Data using Artificial Neural Networks1NMR Unit, Max Planck Institute for Human Cognitive and Brain Sciences, Leipzig, Germany, 2Paul Flechsig Institute for Brain Research, University of Leipzig, Leipzig, Germany, 3Max Planck Institute for Human Cognitive and Brain Sciences, Leipzig, Germany
Synopsis
The generation of contrast in MRI relies on a variety of physical processes (e.g. relaxation, magnetization transfer, etc.) that produces a relatively rich amount of information for biological samples. However, given the complex microstructure of tissues, some histological information of relevance in biology and medicine are obtained more easily using optical acquisition techniques on specifically stained specimens. Here, we propose a machine-learning-based method of replicating the contrast information from optical microscopy by exploiting the richness of MRI acquisitions (which will limit the final resolution). The approach exploits the properties of multi-layer feed-forward neural networks as universal function approximators.
Purpose
Magnetic Resonance Imaging (MRI) has been effectively applied to investigate the tissue structure of biological samples, offering unique advantages in terms of applicability and flexibility. However, for histology, the preferred investigation technique is optical microscopic imaging on stained specimens, which achieves high specificity and resolutions up to approx. $$$100\mathrm{nm}$$$, despite the controversial quantification performances1 and the relatively slow acquisition. The progressive adoption of higher field has led to the possibility of MRI acquisitions with resolutions of $$$50\mathrm{\mu{}m}$$$ and below, within a fraction of the time required for equivalent optical microscopy. While macromolecular and iron contents have been identified as significant sources of contrast in MRI2,3,4, the specificity of optical microscopy has yet to be achieved, partly as a result of the limited understanding of the influence of tissue microstructure and chemical composition on quantitative MRI of biological samples. Here, we introduce an approach based on artificial neural networks (ANN) as universal function approximators5 to predict the contrast observed in histological staining from quantitative MRI acquisitions.Methods
We acquired quantitative magnetization transfer (qMT) and $$$R_1$$$ images at $$$200\;\mathrm{\mu{}m}$$$ isotropic resolution of a post-mortem marmoset full brain using a Bruker 3T MRI scanner (MedSpec 30/100) with a custom-built Rx/Tx Helmholtz coil6. The qMT maps were obtained by voxel-wise fits of the MR signal7,8 from MT-prepared 3D FLASH acquisitions, using a binary-spin-bath model and matrix-algebra-based Bloch-McConnell simulations9 on randomly selected voxels, which were then used to train an ANN for calculating the remaining voxels10. The $$$R_1$$$ map was obtained by fitting the FLASH signal expression to a series of acquisitions with varying flip angles and repetition times11.
Afterwards, the brain was sliced and selectively stained using: Gallyas (silver staining), Myelin Basic Protein (MBP), SMI-311 antibody, HuC/D antigen and Perls' Prussian blue (for iron). For each staining, a quantitative optical density map12 was acquired at $$$322.5\mathrm{nm}$$$ using Zeiss Axio Imager.M1 microscope with an EC Plan-Neofluar 20x/0.50 M27 objective and an AxioCam HR3 camera.
The optical and MRI data were brought to the same $$$200\;\mathrm{\mu{}m}$$$ resolution, co-registered in MATLAB using a sophisticated procedure, and normalized to unity (see Fig.[1]). Because the optical maps were within less than two MRI slices, we assumed the co-localization of the different modality information at the single voxel level.
Then, we trained a multi-layer-perceptron (6-input-120/120/60-hidden-5-output neuron design with $$$\tanh$$$ activations, using Adadelta optimization, mean-square error metric, and $$$0.4$$$ validation split) implemented with Keras/TensorFlow on the right side of the slice. This was used to predict the left side of the slice.
To test the ANN-predictions, we calculated the mean and the standard deviation of the difference image and the Pearson's correlation coefficient $$$r$$$.
Results
The MRI maps used as input for the ANN-based predictor are reported in Fig.[2], while the training and test mask are shown in Fig.[3]. The ANN-predicted and measured optical maps used as output/target are reported in Fig.[4], along with their difference. A summary of the difference image statistics and the Pearson's correlation coefficient $$$r$$$ is reported in the table in Fig.[5]. The ANN-predicted optical density maps show very good correlation, with $$$r$$$ values ranging from almost $$$0.7$$$ to almost $$$0.9$$$. The average of the difference images is below $$$4\%$$$, while the standard deviation ranges from $$$10\%$$$ to $$$20\%$$$ approximately.Discussion
The ANN-based predictor relies only on the intensity information, and therefore it is possible to apply this method with minimal bias to MRI maps of the full brain, provided that appropriate training data from the same brain is provided. Since the quantitative maps are calculated from carefully selected acquisitions, it might be possible to achieve similar (or even better) predictions by using regular weighted acquisitions.
The method used for predicting optical density results relies on the quality of co-registration. A closer inspection of the images reveals that our input and output data were not perfectly registered. This may contribute to: the blurriness of the predicted data, and the correlation loss observed in $$$r$$$.
Given the reproducibility of quantitative MRI and of optical density measures, it is possible in principle to generalize this result to obtain predicted histological staining images without performing any staining (although the status of ex vivo specimens needs a more precise definition, as it affects MRI and optical density measures differently13,14).
Major advances in MRI techniques are still required to compete with the resolution achieved by optical techniques.
Conclusion
This work demonstrates that, using machine learning techniques, a set of MRI acquisitions can reproduce the typical contrast observed in histological staining, paving the way for the replacement of some optical measurements with MRI.Acknowledgements
We would like to thank the following people: Nicholas A. Bock for kindly providing the sample; Roland Müller and Marcel Weiss for support with MRI acquisitions; Stefan Geyer and Nikolaus Weiskopf for insightful discussions.
Funded by: EU through the 'HiMR' Marie Curie ITN (FP7-PEOPLE-2012-ITN-316716), the Max Planck Society through IMPRS NeuroCom, and the Helmholtz Alliance 'ICEMED - Imaging and Curing Environmental Metabolic Diseases'.
References
- Uchihara, T., 2007. Silver diagnosis in neuropathology: principles, practice and revised interpretation. Acta Neuropathol 113, 483–499. doi:10.1007/s00401-007-0200-2
- Stüber, C., Morawski, M., Schäfer, A., Labadie, C., Wähnert, M., Leuze, C., Streicher, M., Barapatre, N., Reimann, K., Geyer, S., Spemann, D., Turner, R., 2014. Myelin and iron concentration in the human brain: A quantitative study of MRI contrast. NeuroImage 93, Part 1, 95–106. doi:10.1016/j.neuroimage.2014.02.026
- Rooney, W.D., Johnson, G., Li, X., Cohen, E.R., Kim, S.-G., Ugurbil, K., Springer, C.S., 2007. Magnetic field and tissue dependencies of human brain longitudinal 1H2O relaxation in vivo. Magn. Reson. Med. 57, 308–318. doi:10.1002/mrm.21122
- Schweser, F., Deistung, A., Lehr, B.W., Reichenbach, J.R., 2011. Quantitative imaging of intrinsic magnetic tissue properties using MRI signal phase: An approach to in vivo brain iron metabolism? NeuroImage 54, 2789–2807. doi:10.1016/j.neuroimage.2010.10.070
- Hornik, K., Stinchcombe, M., White, H., 1989. Multilayer feedforward networks are universal approximators. Neural Networks 2, 359–366. doi:10.1016/0893-6080(89)90020-8
- Müller, R., Pampel, A., Mildner, T., Marschner, H., Möller, H.E., 2013. A transceive RF coil for imaging tissue specimen at 3T based on PCB design, in: Proceedings of the ISMRM 21st Annual Meeting & Exhibition. Presented at the 21st Annual Meeting & Exhibition of the International Society for Magnetic Resonance in Medicine, ISMRM, Salt Lake City, Utah, USA.
- Henkelman, R.M., Huang, X., Xiang, Q.-S., Stanisz, G.J., Swanson, S.D., Bronskill, M.J., 1993. Quantitative interpretation of magnetization transfer. Magn. Reson. Med. 29, 759–766. doi:10.1002/mrm.1910290607
- Sled, J.G., Pike, G.B., 2000. Quantitative Interpretation of Magnetization Transfer in Spoiled Gradient Echo MRI Sequences. Journal of Magnetic Resonance 145, 24–36. doi:10.1006/jmre.2000.2059
- Müller, D.K., Pampel, A., Möller, H.E., 2013. Matrix-algebra-based calculations of the time evolution of the binary spin-bath model for magnetization transfer. Journal of Magnetic Resonance 230, 88–97. doi:10.1016/j.jmr.2013.01.013
- Marschner, H., Müller, D.K., Pampel, A., Neumann, J., Möller, H.E., 2013. Estimation of Parameters from Sparsely Sampled in-vivo Magnetization Transfer Data Using Artificial Neural Networks, in: Proceedings of the ISMRM 21st Annual Meeting & Exhibition. Presented at the 21st Annual Meeting & Exhibition of the International Society for Magnetic Resonance in Medicine, ISMRM, Salt Lake City, Utah, USA.
- Frahm, J., Haase, A., Matthaei, D., 1986. Rapid three-dimensional MR imaging using the FLASH technique. J Comput Assist Tomogr 10, 363–368.
- Floyd, A.D., 2013. Quantitative data from microscopic specimens, in: Suvarna, S.K., Layton, C., Bancroft, J.D. (Eds.), Bancroft’s Theory and Practice of Histological Techniques. Churchill Livingstone / Elsevier, pp. 539–560.
- Shepherd, T.M., Thelwall, P.E., Stanisz, G.J., Blackband, S.J., 2009. Aldehyde fixative solutions alter the water relaxation and diffusion properties of nervous tissue. Magn. Reson. Med. 62, 26–34. doi:10.1002/mrm.21977
- Shepherd, T.M., Flint, J.J., Thelwall, P.E., Stanisz, G.J., Mareci, T.H., Yachnis, A.T., Blackband, S.J., 2009. Postmortem interval alters the water relaxation and diffusion properties of rat nervous tissue — Implications for MRI studies of human autopsy samples. NeuroImage 44, 820–826. doi:10.1016/j.neuroimage.2008.09.054
Figures
Fig.1: Location of the analyzed slice within the marmoset brain.
The red line (surrounded by the paler red area) show the location of the MRI and optical density slices on a 3D reconstruction based on block face optical images.
Fig.2: The input qMT and $$$R_1$$$ MRI images.
$$$R_1$$$ and $$$R_2$$$ denote the longitudinal and transverse relaxation rates, respectively; $$$M_0$$$ indicate the size of the spin pool; $$$k$$$ is the exchange rate constant between pools; the $$$a$$$ and $$$b$$$ subscripts refer to the liquid and the semi-solid pools, respectively. The MRI acquisitions were: 45 FLASH images ($$$T_R=32\;\mathrm{ms}$$$, $$$T_E=8.2\;\mathrm{ms}$$$, $$$\alpha=10\mathrm{°}$$$ with a saturation pulse from 11 logarithmically distributed frequency offsets in the $$$250\mathrm{-}50000\mathrm{Hz}$$$ range and from 7 linearly distributed power levels in the $$$0.6\mathrm{-}7068.6\mathrm{rad/s}$$$ range; 5 FLASH images ($$$T_E=8\;\mathrm{ms}$$$) with $$$(\alpha, T_R)$$$ combinations: $$$(10°,30\mathrm{ms})$$$, $$$(20°,30\mathrm{ms})$$$, $$$(30°,30\mathrm{ms})$$$, $$$(30°,90\mathrm{ms})$$$, $$$(30°,200\mathrm{ms})$$$.
Fig.3: Masks used to separate training and test sets.
The masked out values corresponds to voxel from the embedding medium during the MRI acquisitions. Note the presence of a hole on the left side of the image: voxels within that region were removed to account for spurious signal originating from a metallic impurity within the sample.
Fig.4: Visual comparison of target and predicted optical density maps.
The principal contrast behavior of all tested histological staining images is reproduced. However, some areas show some disagreement, especially for the antibody staining. Also, the predicted images appear more blurred compared to the measured optical densities, and this is possibly related to co-registration inconsistencies and to the lack of sufficient contrast for the finer structure in the input MRI maps.
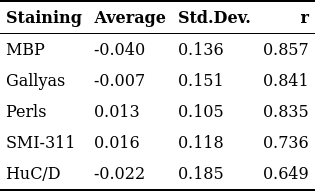
Fig.5: Statistical comparison between target and predicted optical density maps.
The averages and the standard deviations are in arb.units. Note that the stainings MBP (a marker for myelin), Gallyas (a marker for macromolecules) and Perls (a marker for iron) achieve better $$$r$$$ scores compared to other stainings. This is expected as macromolecules (mostly myelin) and iron are known to be significant contributors to the generation of MRI relaxation contrast.