2754
Rapid whole brain qMT imaging with inter-slice MT effects and database-driven fitting approach1Department of Bio and Brain Engineering, Korea Advanced Institute of Science and Technology, Daejeon, Republic of Korea, 2Department of Radiology, Seoul National University Hospital, Seoul, Republic of Korea
Synopsis
Quantitative magnetization transfer (qMT) imaging provides unique tissue contrast, but suffers from prolonged scan time and processing time. The current study suggests inter-slice MT acquisition and database-driven qMT parameter fitting in order to mitigate the problems. Inter-slice scanning takes advantage of incidental MT effects, and thus does not require separate MT preparation. It enabled us to complete the whole brain data acquisition within a clinically reasonable scan time of ~10 min. The employment of pre-defined database also greatly reduced the qMT processing time, while revealing consistent qMT maps compared to those from the conventional method. The proposed database-driven inter-slice qMT method can be a promising alternative of qMT imaging.
Introduction
The technique of magnetization transfer (MT) has paved the way of imaging clinically useful characteristics of tissues. The quantitative MT (qMT) imaging provides biological information more consistent and has broadened the application of MT imaging1,2. However, the prolonged scan time and processing time hindered qMT to be routinely used in clinical studies. In this study, we suggest a new qMT method that dramatically decreases scan time and post processing time. The inter-slice MT scheme, an advancement of incidental MT contrast3,4, does not require a separate MT preparation part, resulting in a shorter scan time. For qMT imaging, the MT offset frequency can be modulated by varying gaps between imaging slices5,6. In this study, we demonstrate that the inter-slice MT imaging can be advanced to qMT imaging and the qMT parameter fitting can be dramatically accelerated by a pre-defined database approach.Methods
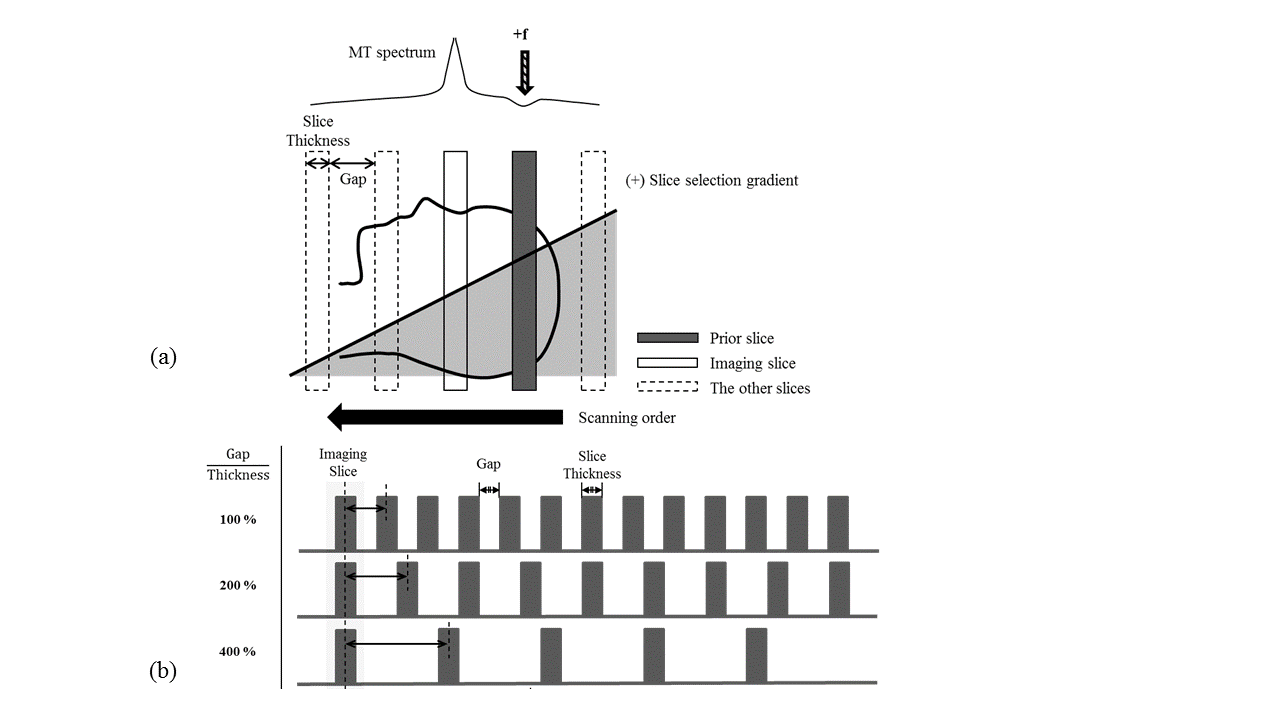
Five healthy volunteers were studied using 3T Siemens Tim Trio scanner (Erlangen, Germany). For qMT imaging, offset frequency was controlled by changing inter-slice gaps (Fig. 1). To modulate the MT saturation frequency, the gap values were set at 100%, 200%, 400%, 800%, 1400%, and 2400% of the slice thickness, which corresponded to 15.7ppm, 23.5ppm, 39.1ppm, 70.5ppm, 117.4ppm, and 195.7ppm, respectively. To modulate MT saturation power, flip angle was set at two different values of 30˚ and 70˚. Five‑second delay was applied after each acquisition of dataset for complete relaxation. To ensure the steady-state in terms of cumulative MT effects across slices, 3 dummy slices were added before reaching the volume of interest. Two-dimensional balanced steady-state free precession (bSSFP) sequence was used to maximize the inter-slice MT effect7,8. Mapping T1 and T2 was conducted using Turbo FLASH with varying inversion recovery time and multi-echo spin-echo, respectively. Imaging parameters were TE/TR=2.275/4.55ms, matrix size=128x128, slice thickness=5mm, and the number of slices=25. The database was built by considering the range of parameters related to the two-pool MT model (offset frequencies, flip angles, T1, and T2 of free proton pool, exchange rate, and pool fraction ratio) and the theoretical signal intensities corresponding to the solution of the model equation. T1 and T2 of bound pool were set at 1s and 12.05μs, respectively. The acquired MT dataset was fitted to the pre-defined database using non-linear least square method without going through the time‑consuming Bloch equation calculation. The suggested strategies were validated by comparing the inter-slice qMT and the conventional qMT on the center slice in terms of qMT fitting with/without database and resulting qMT parameters. The conventional qMT scanning was conducted by applying pulsed off-resonance MT saturation pulses for three seconds before the bSSFP readout. Five-second delay was added after every acquisition. All the data processing was performed on a PC with 4.0GHz i7-4790 CPU.Results
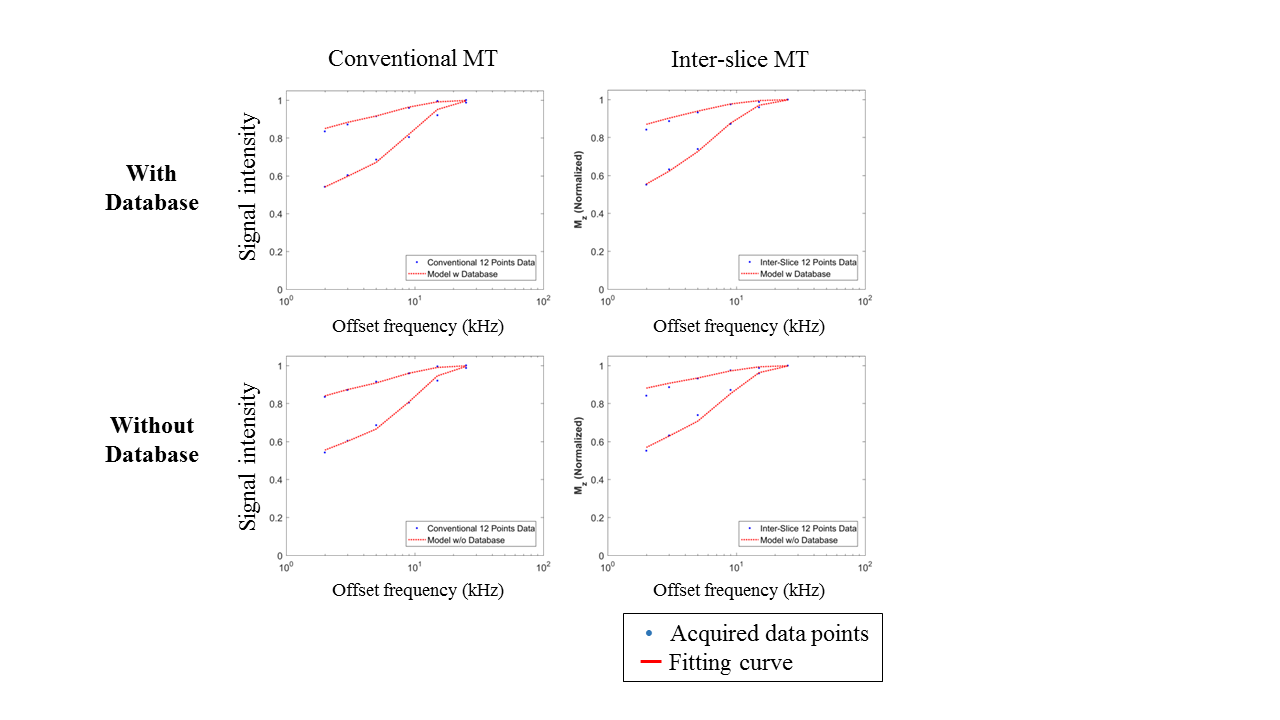
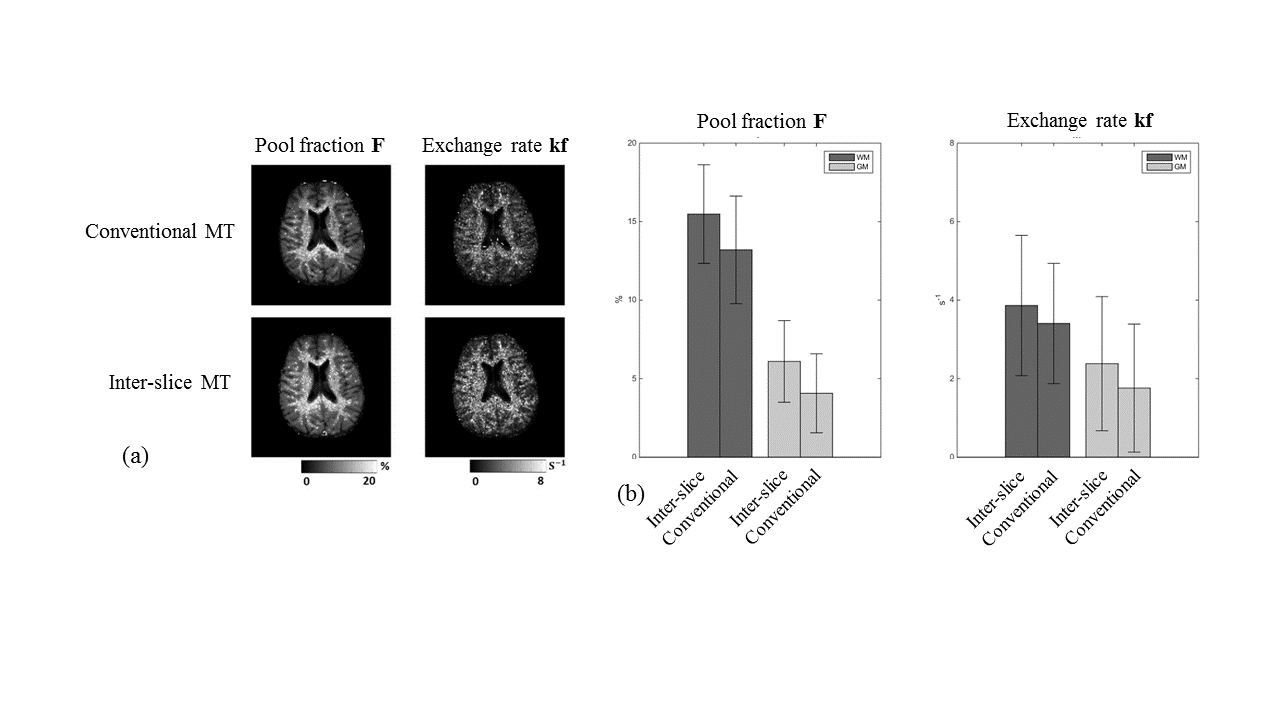
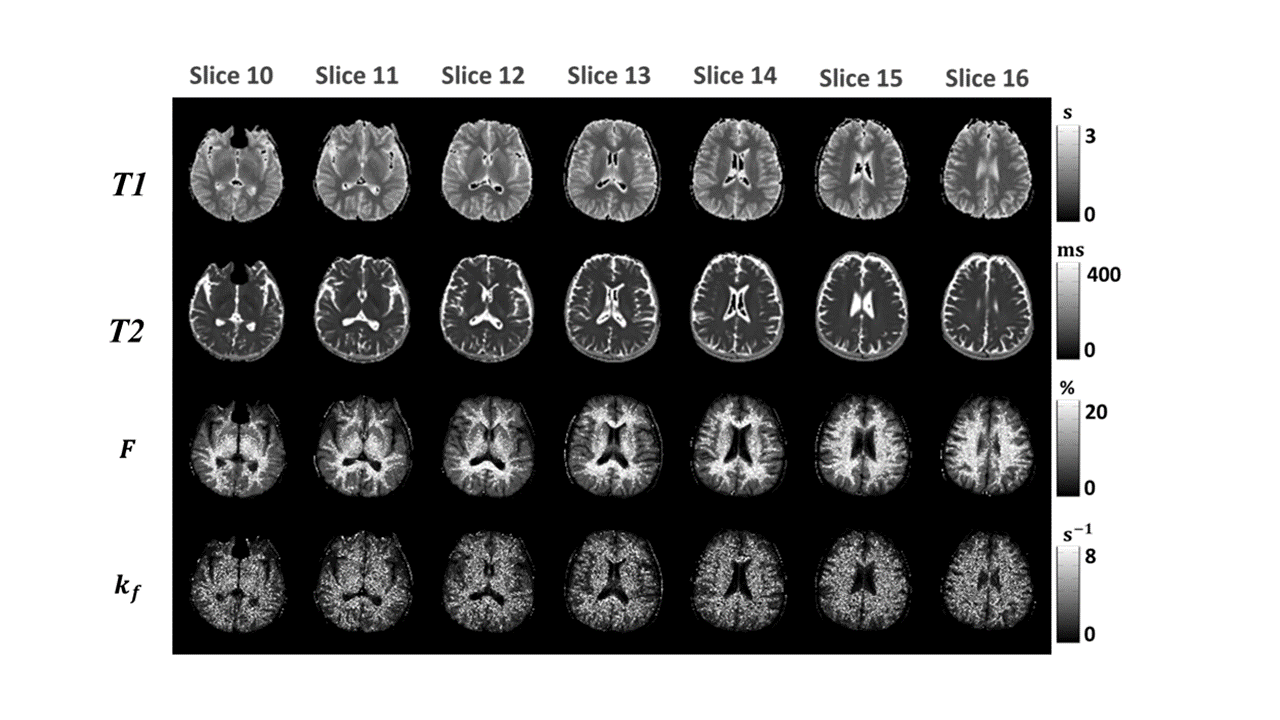
The offset frequency was successfully adjusted by gap control in the inter-slice qMT, showing MT frequency spectrum similar to that of the conventional method (Fig. 2). The database-driven qMT fitting showed almost the same results as those of the conventional method fitting without database (Fig. 2). The processing time per pixel was about 4s with the database approach but longer than one minute without the database. The inter-slice qMT maps were similar to those from the conventional qMT (Fig. 3). Also, the qMT maps from the inter-slice qMT were visually consistent across the slices (Fig. 4), indicating successful control of the MT offset frequency.Discussion
Quantitative MT imaging is clinically useful9,10, but has not been routinely used in clinical studies due to the long scan time and long processing time. These drawbacks could be considerably remedied by two strategies proposed in this study. The scan time efficiency becomes higher when scanning higher number of 2D slices. The scan time for the inter-slice approach can be reduced further by decreasing the delay between the acquisitions (5 sec in this study). The time-consuming process of the parameter fitting has been another biggest hurdle, which could be partly overcome by using the pre-defined database that already contains the solutions based on the parameter sets. Despite the difference in computing power of the CPU, the database-driven qMT fitting in this study still outperformed other previous works11,12, in terms of processing speed.Conclusion
Inter-slice MT acquisition scheme could reduce scan time significantly and database-driven qMT fitting approach could save a lot of processing time by skipping the time-consuming Bloch equation calculation. The combination of these two methods may greatly accelerate and broaden the application of qMT imaging.Acknowledgements
No acknowledgement found.References
1. Henkelman R. M. et al. Quantitative Interpretation of Magnetization Transfer. MRM, 1993; 29:759-766.
2. Morrison C. et al. Modeling Magnetization Transfer for Biological-like Systems Using a Semi-solid Pool with a Super-Lorentzian Lineshape and Dipolar Reservoir. JMR, 1995; 108: 103-113.
3. Dixon W.T. et al. Incidental magnetization transfer contrast in standard multislice imaging. MRI, 1990; 8:417-422.
4. Chang Y. et al. Incidental Magnetization Transfer Effects in Multislice Brain MRI at 3.0T. JMRI, 2007; 25:862-865.
5. Barker J.W. et al. Investigation of Inter-Slice Magnetization Transfer Effects as a New Method for MTR Imaging of the Human Brain. PLoS ONE, 2015; doi: 10.1371/journal.pone.0117101
6. Lee. S-L et al. Modulation of Inter-Slice Frequency Offsets for Magnetization Transfer Ratio Imaging. 23rd Annual Meeting, ISMRM 2015; Program number: 1743
7. Park, S-H et al. Alternate Ascending/Descending Directional Navigation Approach for Imaging Magnetization Transfer Asymmetry. MRM, 2011; 65:1702-1710.
8. Bieri O et al. On the origin of apparent low tissue signals in balanced SSFP. MRM, 2006;56(5):1067-1074
9. Smith S.A. et al. Quantitative Magnetization Transfer Characteristics of the Human Cervical Spinal Cord In Vivo: Application to Adrenomyeloneuropathy. MRM, 2009; 61:22-27.
10. Giulietti G. et al. Quantitative magnetization transfer provides information complementary to grey matter atrophy in Alzheimer's disease brains. NeuroImage, 2012; 59: 1114-1122.
11. Tozer D. et al. Quantitative Magnetization Transfer Mapping of Bound Protons in Multiple Sclerosis. MRM, 2003; 50:83-91.
12. Cabana J-F. et al. Quantitative Magnetization Transfer Imaging Made Easy with qMTLab: Software for Data Simulation, Analysis, and Visualization. Concepts in Magn. Reson. 2015; 44A(5) 263-277.
Figures