2753
SNR-Efficient 3D GRE T1ρ Mapping of the Brain using Tailored Variable Flip Angle Scheduling1Center for Magnetic Resonance Research, University of Minnesota, Minneapolis, MN, United States, 2Radiology, University of Iowa, Iowa City, IA, United States
Synopsis
We introduce a new 3D GRE acquisition strategy to greatly improve the SNR efficiency of quantitative 3D T1ρ mapping. Unlike the state-of-the-art 3D MAPSS method, the proposed approach assigns a unique variable flip angle schedule for each spin-lock preparation pulse duration. This enables the use of larger flip angles and greater flexibility in selection of imaging parameters to improve SNR efficiency. In this work, we evaluate this technique for T1ρ mapping of the brain, but this method can also be applied to other regions of the body and used with a variety of magnetization preparation pulses.
Introduction
Quantitative mapping of brain T1ρ relaxation times is an emerging technique for neurological and psychiatric diseases.1-6 However, the utility of brain T1ρ mapping, for which high 3D spatial resolution and/or nulling of signal from cerebral spinal fluid (CSF) is often desired, is hampered by low SNR efficiency of current acquisition schemes. The advent of segmented 3D GRE and FSE sequences with long modulated echo trains has been a major step toward making 3D T1ρ mapping more practical.7-10 A leading segmented GRE technique for T1ρ mapping, MAPSS,7,8 employs a variable flip angle (VFA) scheme and RF cycling to accurately and rapidly generate 3D T1ρ maps. In this work, we propose and investigate a new segmented GRE acquisition strategy called “tailored VFA scheduling” to further improve the SNR efficiency of T1ρ mapping of the brain. The performance of this method is compared to MAPSS in vivo.Methods
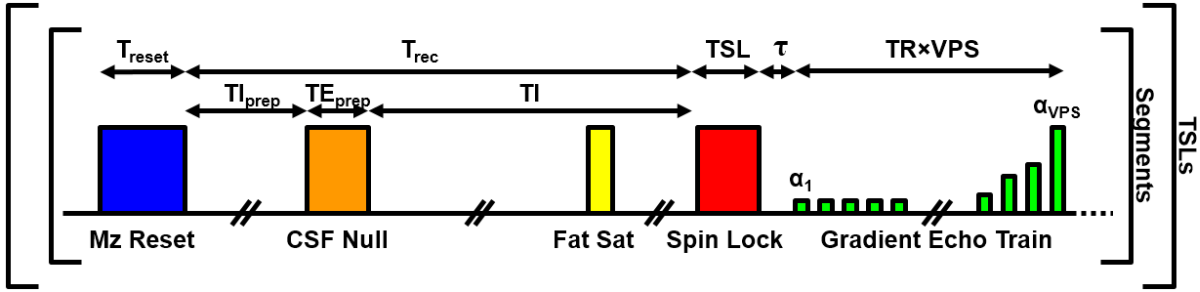
Two key factors for determining the SNR efficiency of 3D T1ρ mapping using segmented 3D GRE acquisition schemes (Figure 1) are: (i) the excitation flip angle (α1) when encoding the center of k-space, which determines the baseline signal; and (ii) the length of the gradient-echo train (i.e., views per segment (VPS)), which determines the number of segments that need to be acquired. While achieving both a high α1 and VPS would be optimal, it is impractical due to signal modulation across the gradient-echo train. For T1ρ mapping, this signal modulation depends on the spin-lock time (TSL) and can result in loss of spatial fidelity and quantitative accuracy if not corrected.
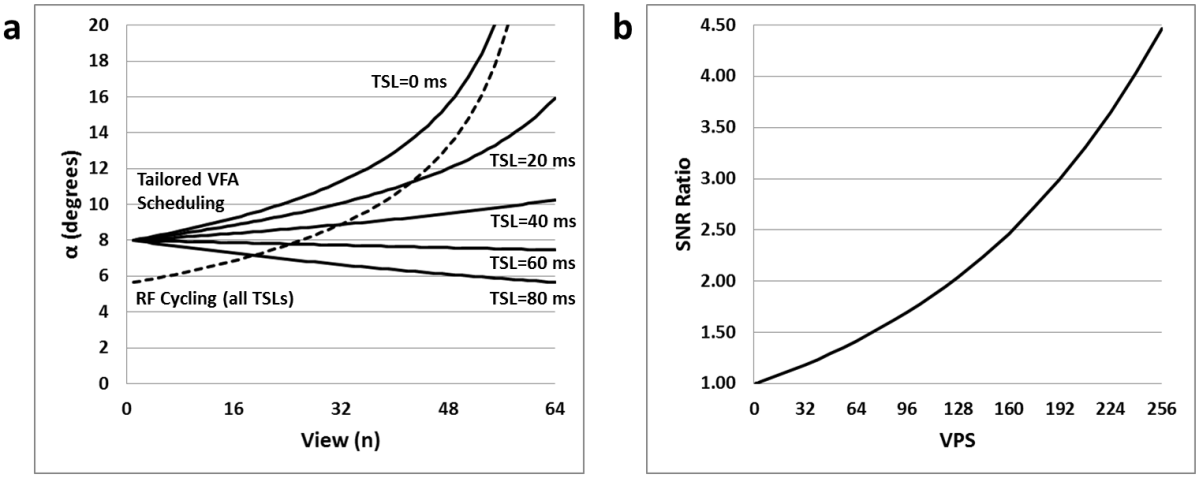
MAPSS addresses this problem by using RF cycling, for which each TSL is acquired twice, one with magnetization prepared along +z and the other along -z. Subtraction of these pairs of TSL signals results in two major benefits: (i) elimination of confounding T1 effects; and (ii) a signal modulation function that is independent of TSL. A single VFA schedule can then be used to eliminate the signal modulation (Figure 2a, dashed line), thereby enabling acquisition of T1ρ maps with a high degree of spatial fidelity and quantitative accuracy. The primary drawback to this approach is that it is not very SNR efficient since α1 decreases rapidly as VPS increases.
In contrast, tailored VFA scheduling allows for some loss of T1ρ map spatial fidelity and quantitative accuracy in exchange for a potentially favorable gain in SNR efficiency. The method works by tailoring VFA schedules for each unique TSL, which allows for a much greater α1 (Figures 2a, solid lines) and thus higher SNR efficiency (Figure 2b). The tailored VFA schedules are defined by assuming a tissue T1ρ and T1 relaxation time, thus deviation in true values from these assumed parameters will result in quantitative mapping errors. However, as demonstrated below, these errors can be quite small (<3%).
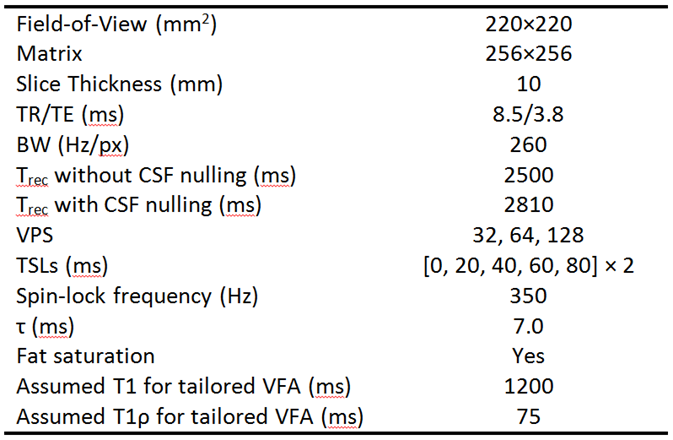
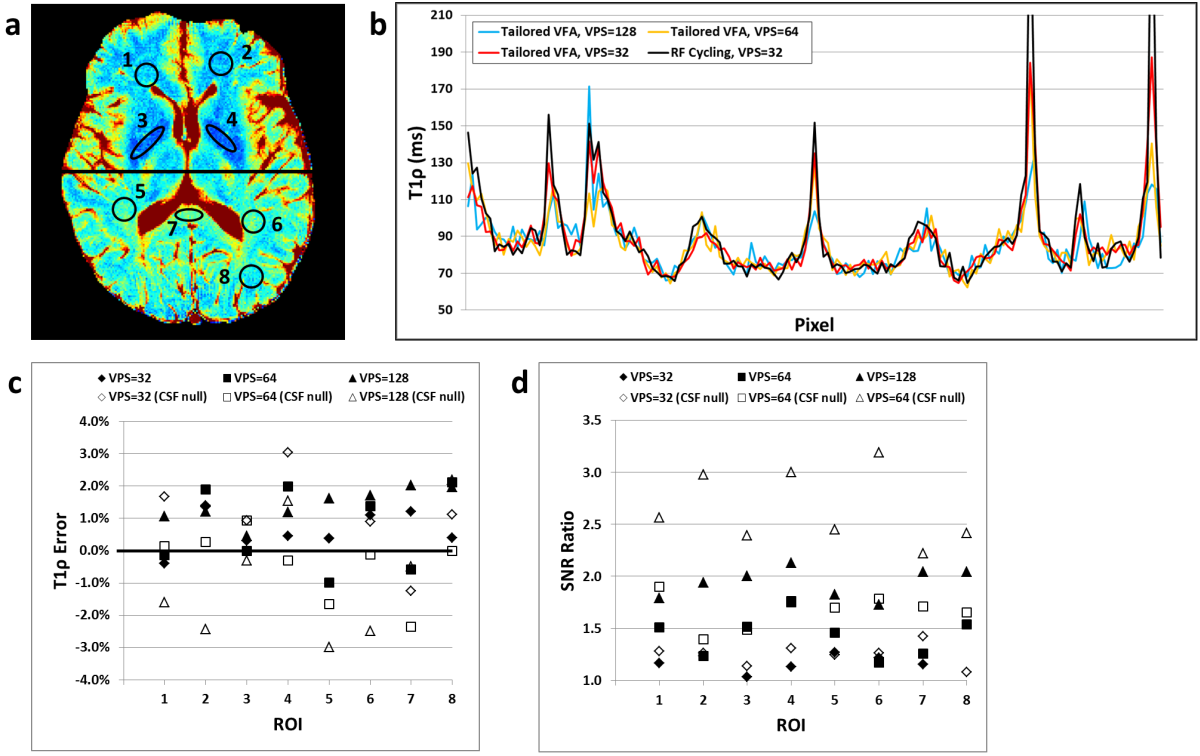
We compared the RF cycling (i.e., MAPSS) and tailored VFA scheduling methods for T1ρ mapping by imaging a volunteer’s brain in vivo. This experiment was conducted under an IRB-approved protocol on a 3T Siemens Trio system. 2D GRE images were acquired rather than 3D to reduce scan time and motion to best compare the methods, but the results apply equally well to the 3D case. VFA scheduling was applied along the phase-encode direction (R/L), and maps were acquired with VPS=32, 64, and 128, both without and with CSF nulling. Imaging parameters and scan times were identical for the RF cycling and tailored VFA scheduling methods (Table 1). Regions of interest (ROIs) and line profiles were used to compare relaxation times, SNR, and spatial fidelity between the two methods as a function of VPS. All processing was done using MATLAB.
Results
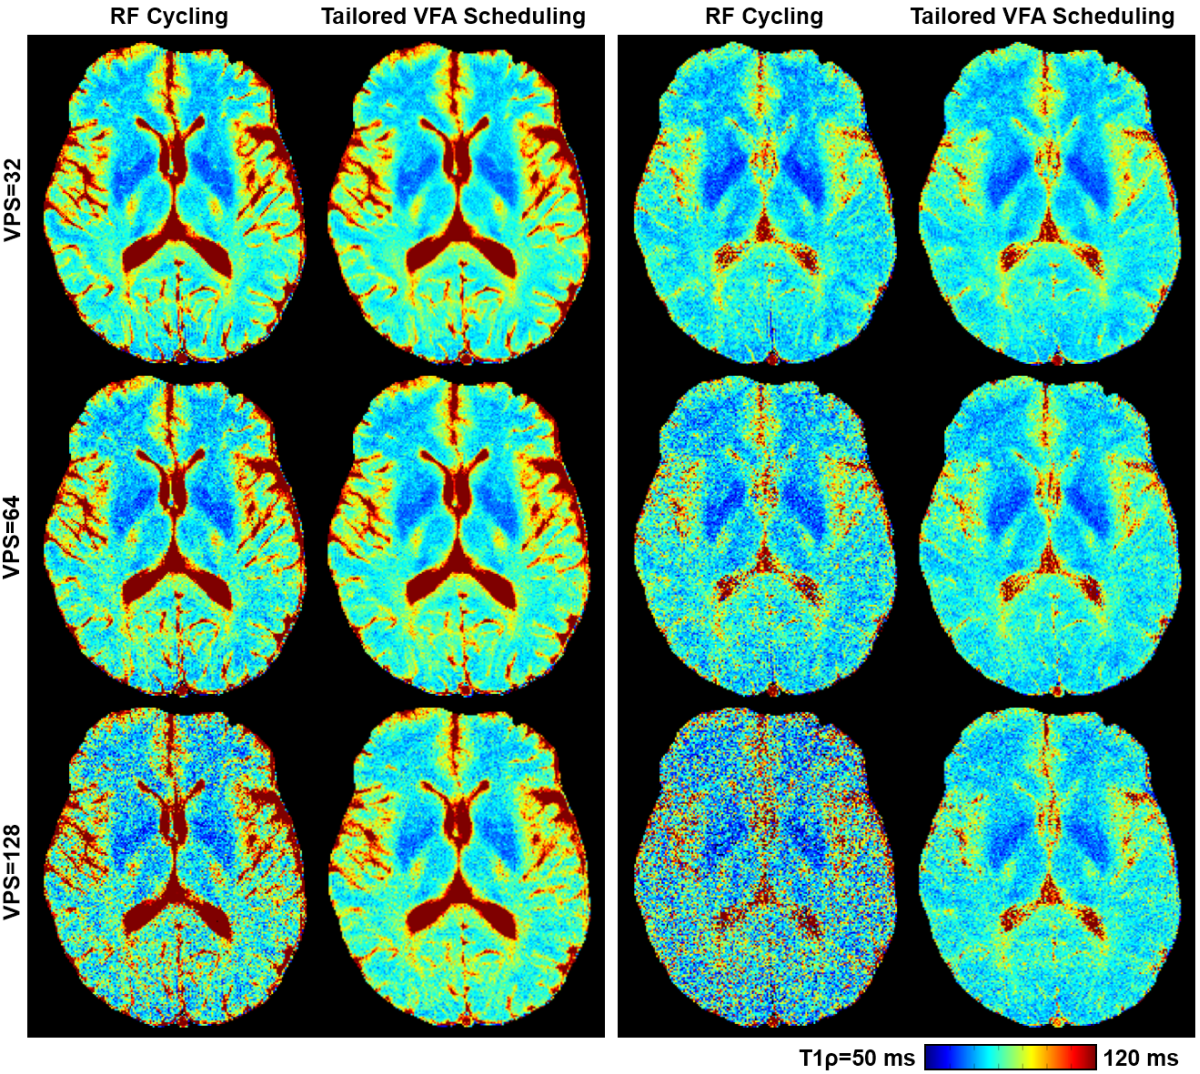
Imaging results and quantitative analyses are shown in Figures 3 and 4, respectively. The SNR advantage of tailored VFA scheduling vs. RF cycling is apparent and agrees with what is expected from simulations. For VPS=128, tailored VFA scheduling provided a 2× improvement in SNR (equivalent to a 4× savings in scan time). Remarkably, this substantial gain had little cost; T1ρ errors were ≤3% and there was no apparent loss in spatial fidelity.Discussion
Tailored VFA scheduling enables a substantial improvement in SNR efficiency for 3D GRE T1ρ mapping of the brain compared to the current state-of-the-art 3D MAPSS sequence. Further gains can be made by utilizing the method’s more flexible choice of TSLs.11 These large gains in efficiency can potentially be achieved at a small cost, which is a favorable tradeoff for many applications.Acknowledgements
This work was supported in part by a NARSAD Young Investigator Award from the Brain and Behavior Research Foundation and the NIH (K01AR070894; P41EB015894).References
1. Nestrasil I, Michaeli S, Liimatainen T, Rydeen CE, Kotz CM, Nixon JP, Hanson T, Tuite PJ. T1rho and T2rho MRI in the evaluation of Parkinson's disease. J Neurol 2010; 257(6):964-968.
2. Haris M, Singh A, Cai K, Davatzikos C, Trojanowski JQ, Melhem ER, Clark CM, Borthakur A. T1rho MR imaging in Alzheimer's disease and Parkinson's disease with and without dementia. J Neurol 2011; 258(3):380-385.
3. Mangia S, Carpenter AF, Tyan AE, Eberly LE, Garwood M, Michaeli S. Magnetization transfer and adiabatic T1ρ MRI reveal abnormalities in normal-appearing white matter of subjects with multiple sclerosis. Mult Scler 2014; 20(8):1066-1073.
4. Gonyea JV, Watts R, Applebee A, Andrews T, Hipko S, Nickerson JP, Thornton L, Filippi CG. In vivo quantitative whole-brain T1 rho MRI of multiple sclerosis. J Magn Reson Imaging 2015; 42(6):1623-1630.
5. Johnson CP, Follmer RL, Oguz I, Warren LA, Christensen GE, Fiedorowicz JG, Magnotta VA, Wemmie JA. Brain abnormalities in bipolar disorder detected by quantitative T1ρ mapping. Mol Psychiatry 2015; 20(2):201-206.
6. Wassef SN, Wemmie JA, Johnson CP, Johnson H, Paulsen JS, Long JD, Magnotta VA. T1ρ imaging in premanifest Huntington disease reveals changes associated with disease progression. Mov Disord 2015; 30(8):1107-1114.
7. Li X, Han ET, Busse RF, Majumdar S. In vivo T1ρ mapping in cartilage using 3D magnetization-prepared angle-modulated partitioned k-space spoiled gradient echo snapshots (3D MAPSS). Magn Reson Med 2008; 59(2):298-307.
8. Li X, Wyatt C, Rivoire J, Han E, Chen W, Schooler J, Liang F, Shet K, Souza R, Majumdar S. Simultaneous acquisition of T1ρ and T2 quantification in knee cartilage: repeatability and diurnal variation. J Magn Reson Imaging 2014; 39(5):1287-1293.
9. Chen W, Koon PD, Shankaranarayanan A. 3D quantitative imaging of relaxation parameters of whole brain. Proc Int Soc Magn Reson Med 2012; Abstract 3419.
10. Watts R, Andrews T, Hipko S, Gonyea JV, Filippi CG. In vivo whole-brain T1-rho mapping across adulthood: normative values and age dependence. J Magn Reson Imaging 2014; 40(2):376-382.
11. Johnson CP, Thedens DR, Magnotta VA. Precision-guided sampling schedules for efficient T1ρ mapping. J Magn Reson Imaging 2015; 41(1):242-250.
Figures