2752
A unified signal readout improves denoising of multi-modal spinal cord MRI1Queen Square MS Centre, UCL Institute of Neurology, Faculty of Brain Sciences, University College London, London, United Kingdom, 2Centre for Medical Image Computing, Department of Computer Science, University College London, London, United Kingdom, 3Center for Biomedical Imaging, Department of Radiology, New York University School of Medicine, New York, NY, United States, 4Philips UK, Guildford, Surrey, United Kingdom, 5NeuroPoly Lab, Institute of Biomedical Engineering, Polytechnique Montréal, Montréal, QC, Canada, 6Functional Neuroimaging Unit, CRIUGM, Université de Montréal, Montréal, QC, Canada, 7Centre for Medical Image Computing, Department of Medical Physics and Biomedical Engineering, University College London, London, United Kingdom, 8Dementia Research Centre, UCL Institute of Neurology, Faculty of Brain Sciences, University College London, London, United Kingdom, 9Brain MRI 3T Research Centre, C. Mondino National Neurological Institute, Pavia, Italy, 10Department of Brain and Behavioural Sciences, University of Pavia, Pavia, Italy
Synopsis
Denoising based on Marčenko-Pastur principal component analysis (MP-PCA) is a versatile model-free method proposed for brain imaging. Here, we assess the potential of the technique for multi-modal quantitative spinal cord MRI. We analyse a unique data set consisting of multi-modal cervical scans obtained with a unified signal readout, and corroborate in vivo findings with simulations. We show that MP-PCA denoising is a valid tool for pre-processing a variety of signal contrasts in the spinal cord. In particular, the overall performance of denoising can be enhanced further on multi-modal acquisitions with matched signal readout, due to increased data redundancy.
Introduction
Denoising based on Marčenko-Pastur (MP) principal component analysis (PCA), a model-free technique that relies on redundancy of MRI acquisitions, has recently been demonstrated for diffusion MRI of the brain1,2. Our aim is to explore synergies in simultaneous denoising of multi-modal spinal cord quantitative MRI (qMRI) (diffusion weighted imaging or DWI; quantitative magnetisation transfer imaging or qMT; T1 and T2 mapping), which notoriously suffers from low signal-to-noise ratio3 (SNR). Through analysis of synthetic and in vivo data, we test the hypothesis that by combining all modalities, the most redundant acquisitions (i.e. those with a large number of acquisitions versus number of underlying noise-free signal’s principal components, e.g. DWI) improve noise removal in less redundant acquisitions (e.g. qMT). The unified signal readout of our multi-modal acquisition thereby ensures comparable noise characteristics across modalities.Methods
In vivo data
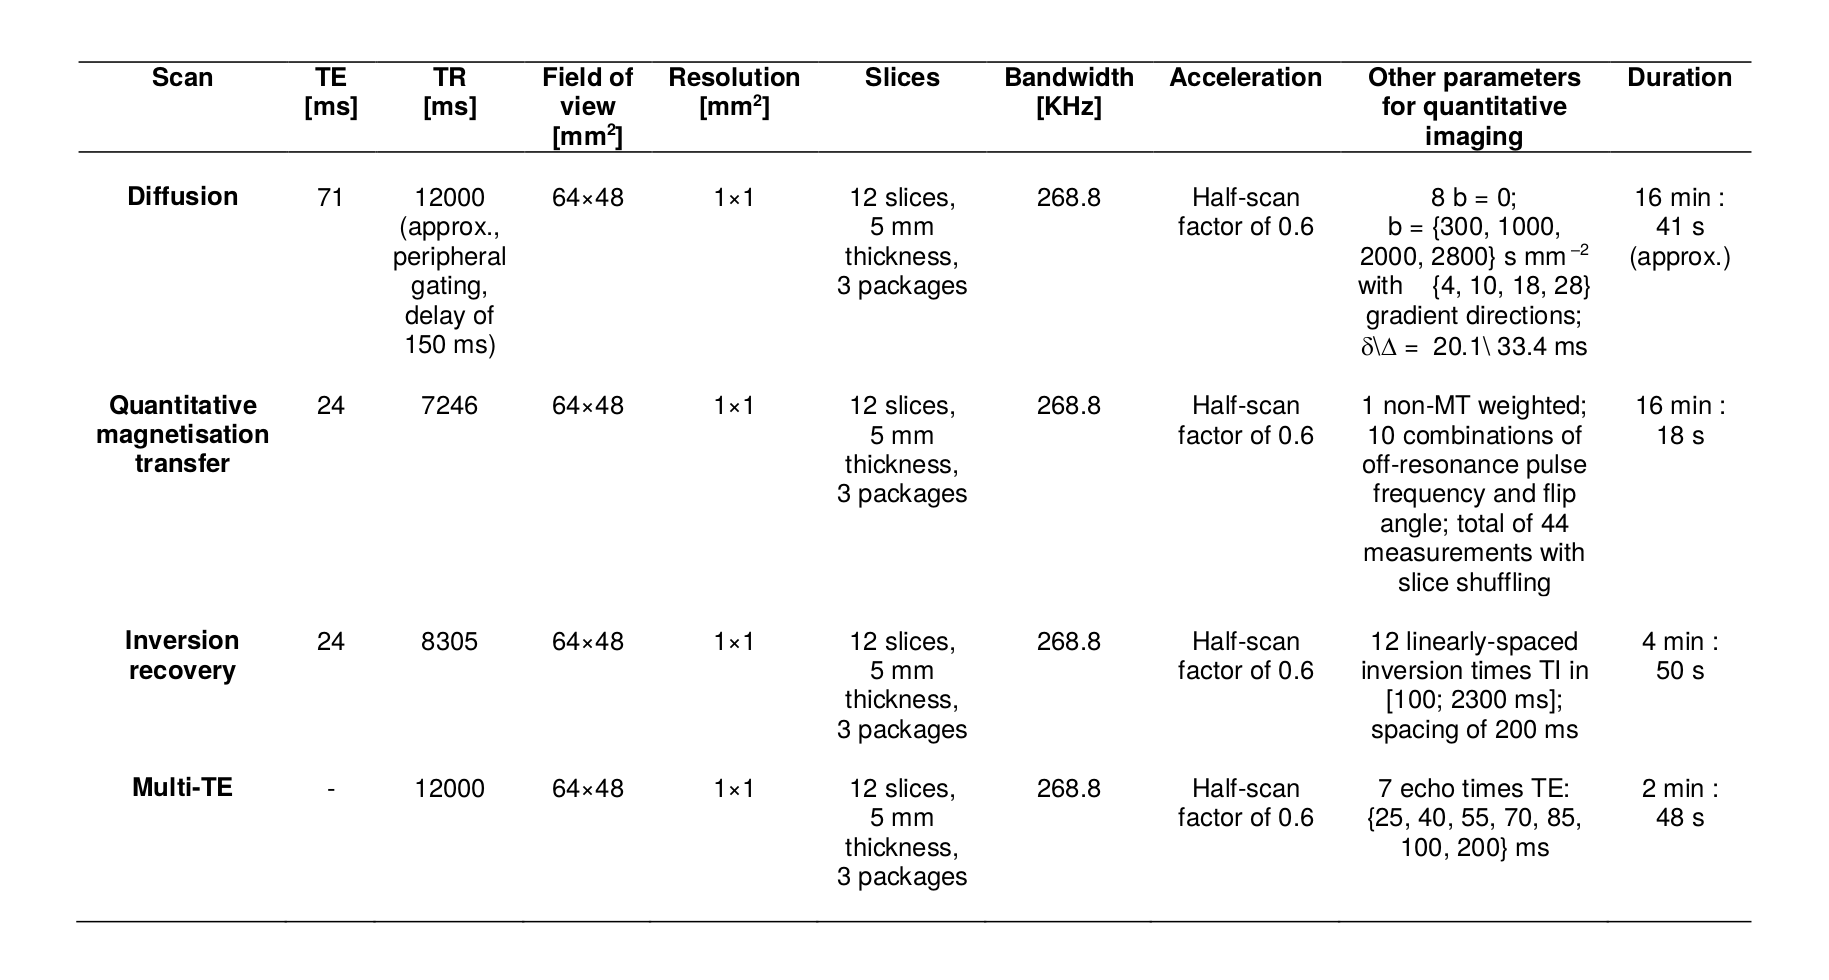
We scanned 4 healthy volunteers (2 males; age range 28-40) twice on a 3T Philips Achieva system. Imaging included an anatomical scan and a multi-modal protocol with a unified ZOOM-EPI4 signal readout (resolution 1×1×5 mm3; parameters in figure 1). ZOOM-EPI imaging consisted of: (i) multi-shell diffusion-weighted (DW) imaging, with (ii) non-DW images acquired at various TE, or multi-TE (mTE) acquisition; (iii) quantitative magnetisation transfer5 (qMT) and (iv) inversion recovery6 (IR) imaging.
Synthetic data
We generated a numerical phantom that mimics the multi-modal in vivo acquisition, relying on the Spinal Cord Toolbox7 (SCT) atlas for realistic anatomy/voxel-wise partial volumes. Multimodal signals for grey/white matter and cerebrospinal fluid were generated respectively for DW, qMT, mTE and IR based on reported literature values for the parameters of the corresponding diffusion tensor8,9, two-pool5,10, and mono-exponential T2 decay/T1 recovery11 models. Within-tissue complexity was simulated by drawing parameters from tissue-dependent normal distributions, independently for each parameter. Signals were corrupted with Rician noise13 at different SNRs.
Analysis: synthetic data
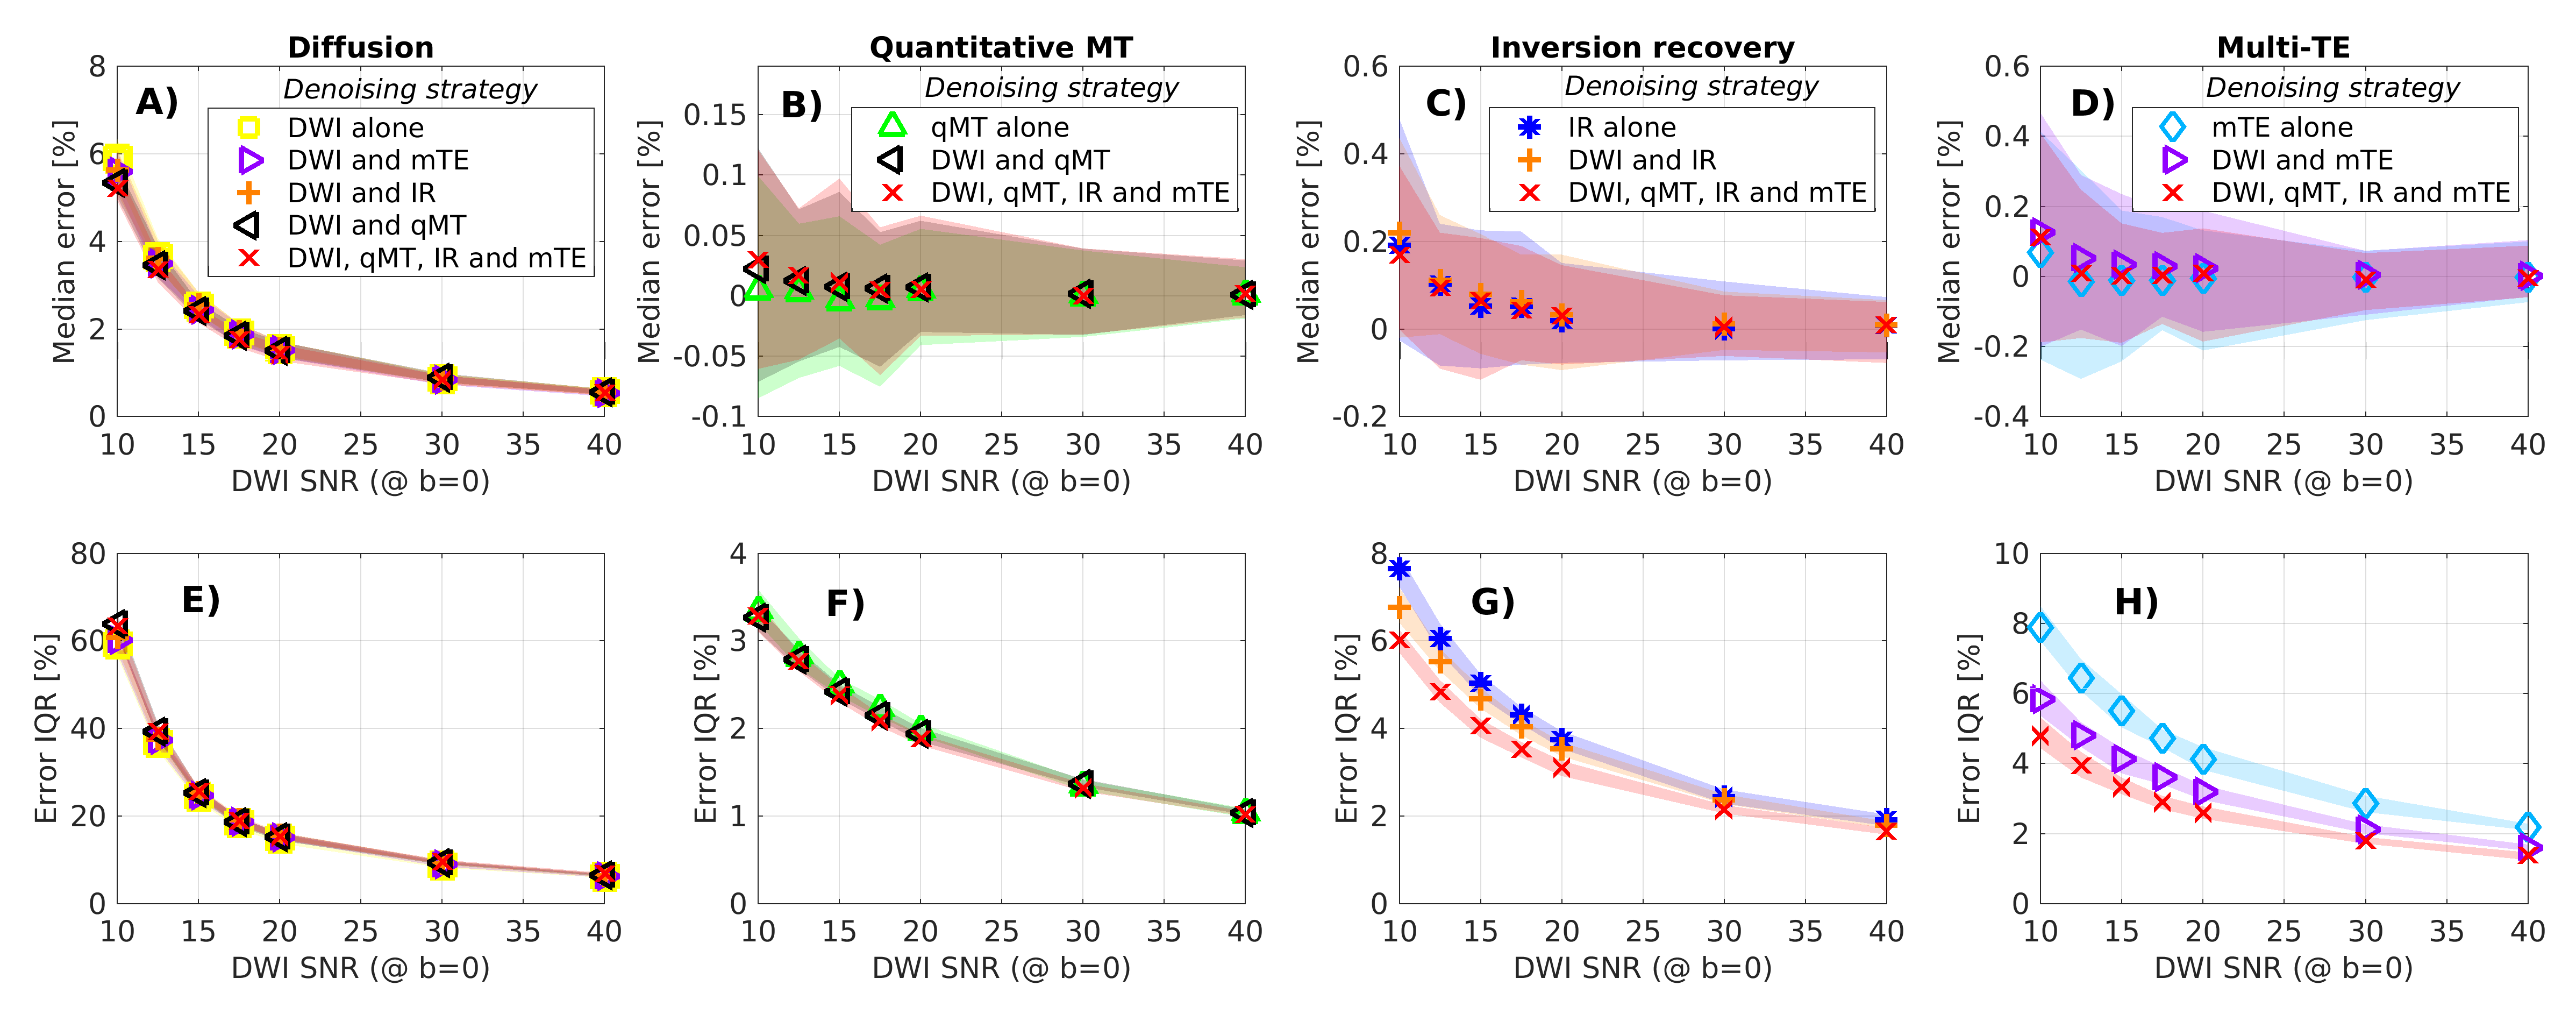
Synthetic signals were denoised slice-by-slice within the spinal cord in multiple ways with MP-PCA2, followed Rician bias mitigation14. First, denoising was performed on each modality individually. Next, qMT, mTE and IR were denoised after concatenation with the DW measurements. Finally, the whole set of multi-modal measurements was denoised as a whole. Denoised signals were compared to the ground truth to evaluate percentage relative error median (measuring accuracy) and inter-quartile range (IQR, measuring precision).
Analysis: in vivo data
We denoised in vivo scans within the spinal cord (segmented with the SCT15) following the same strategies as on the synthetic data. Afterwards, the diffusion kurtosis (DK) model16, two-pool model5 and mono-exponential relaxometry models were fitted to the noisy/denoised data (no motion correction was performed to avoid interpolation).
Results and discussion
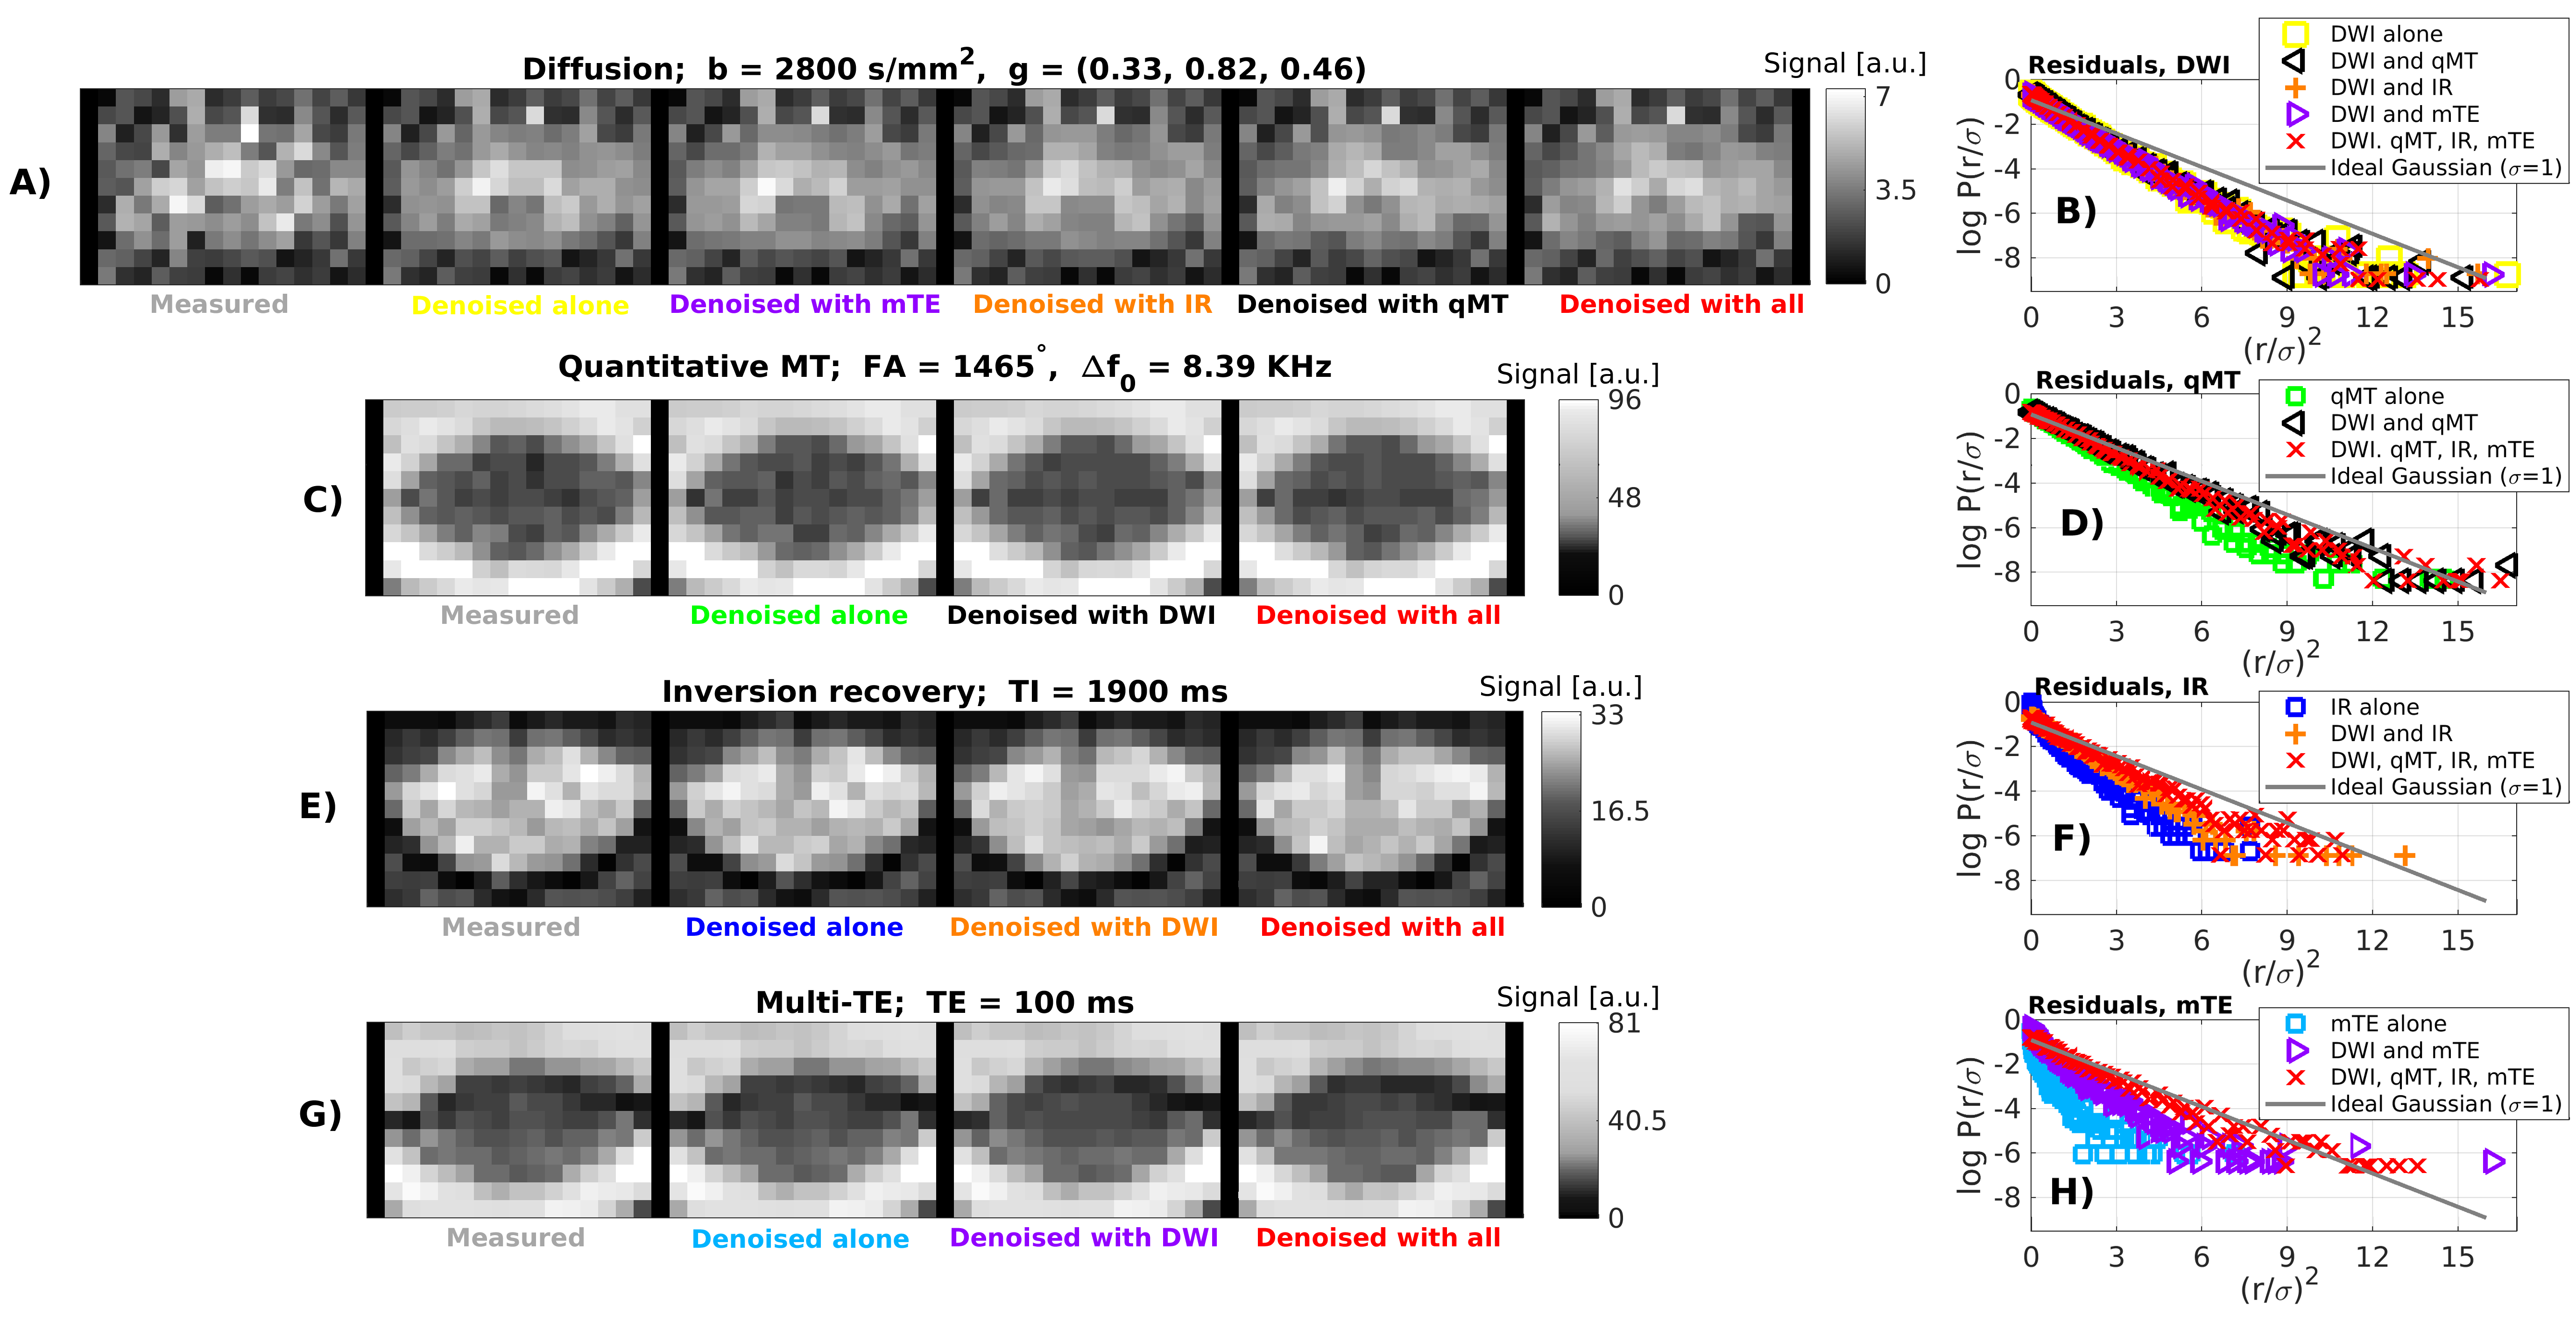
Figure 2 shows in vivo noisy/denoised images and denoising residuals. Denoising improves the quality of the data, most visibly on DW imaging. Remarkably, residual plots show that denoising a scan with limited redundancy such as mTE and IR after concatenation with more redundant modalities, removes noise in the former more effectively: the residuals r/σ normalised by estimated noise σ are closer to the unit Gaussian, expected from the physics of noise (panels 2.F and 2.H). The marked linearity in residual plots (Gaussianity test) indicates that the underlying anatomy is not removed1,2. Results are consistent across subjects/scan-rescan.
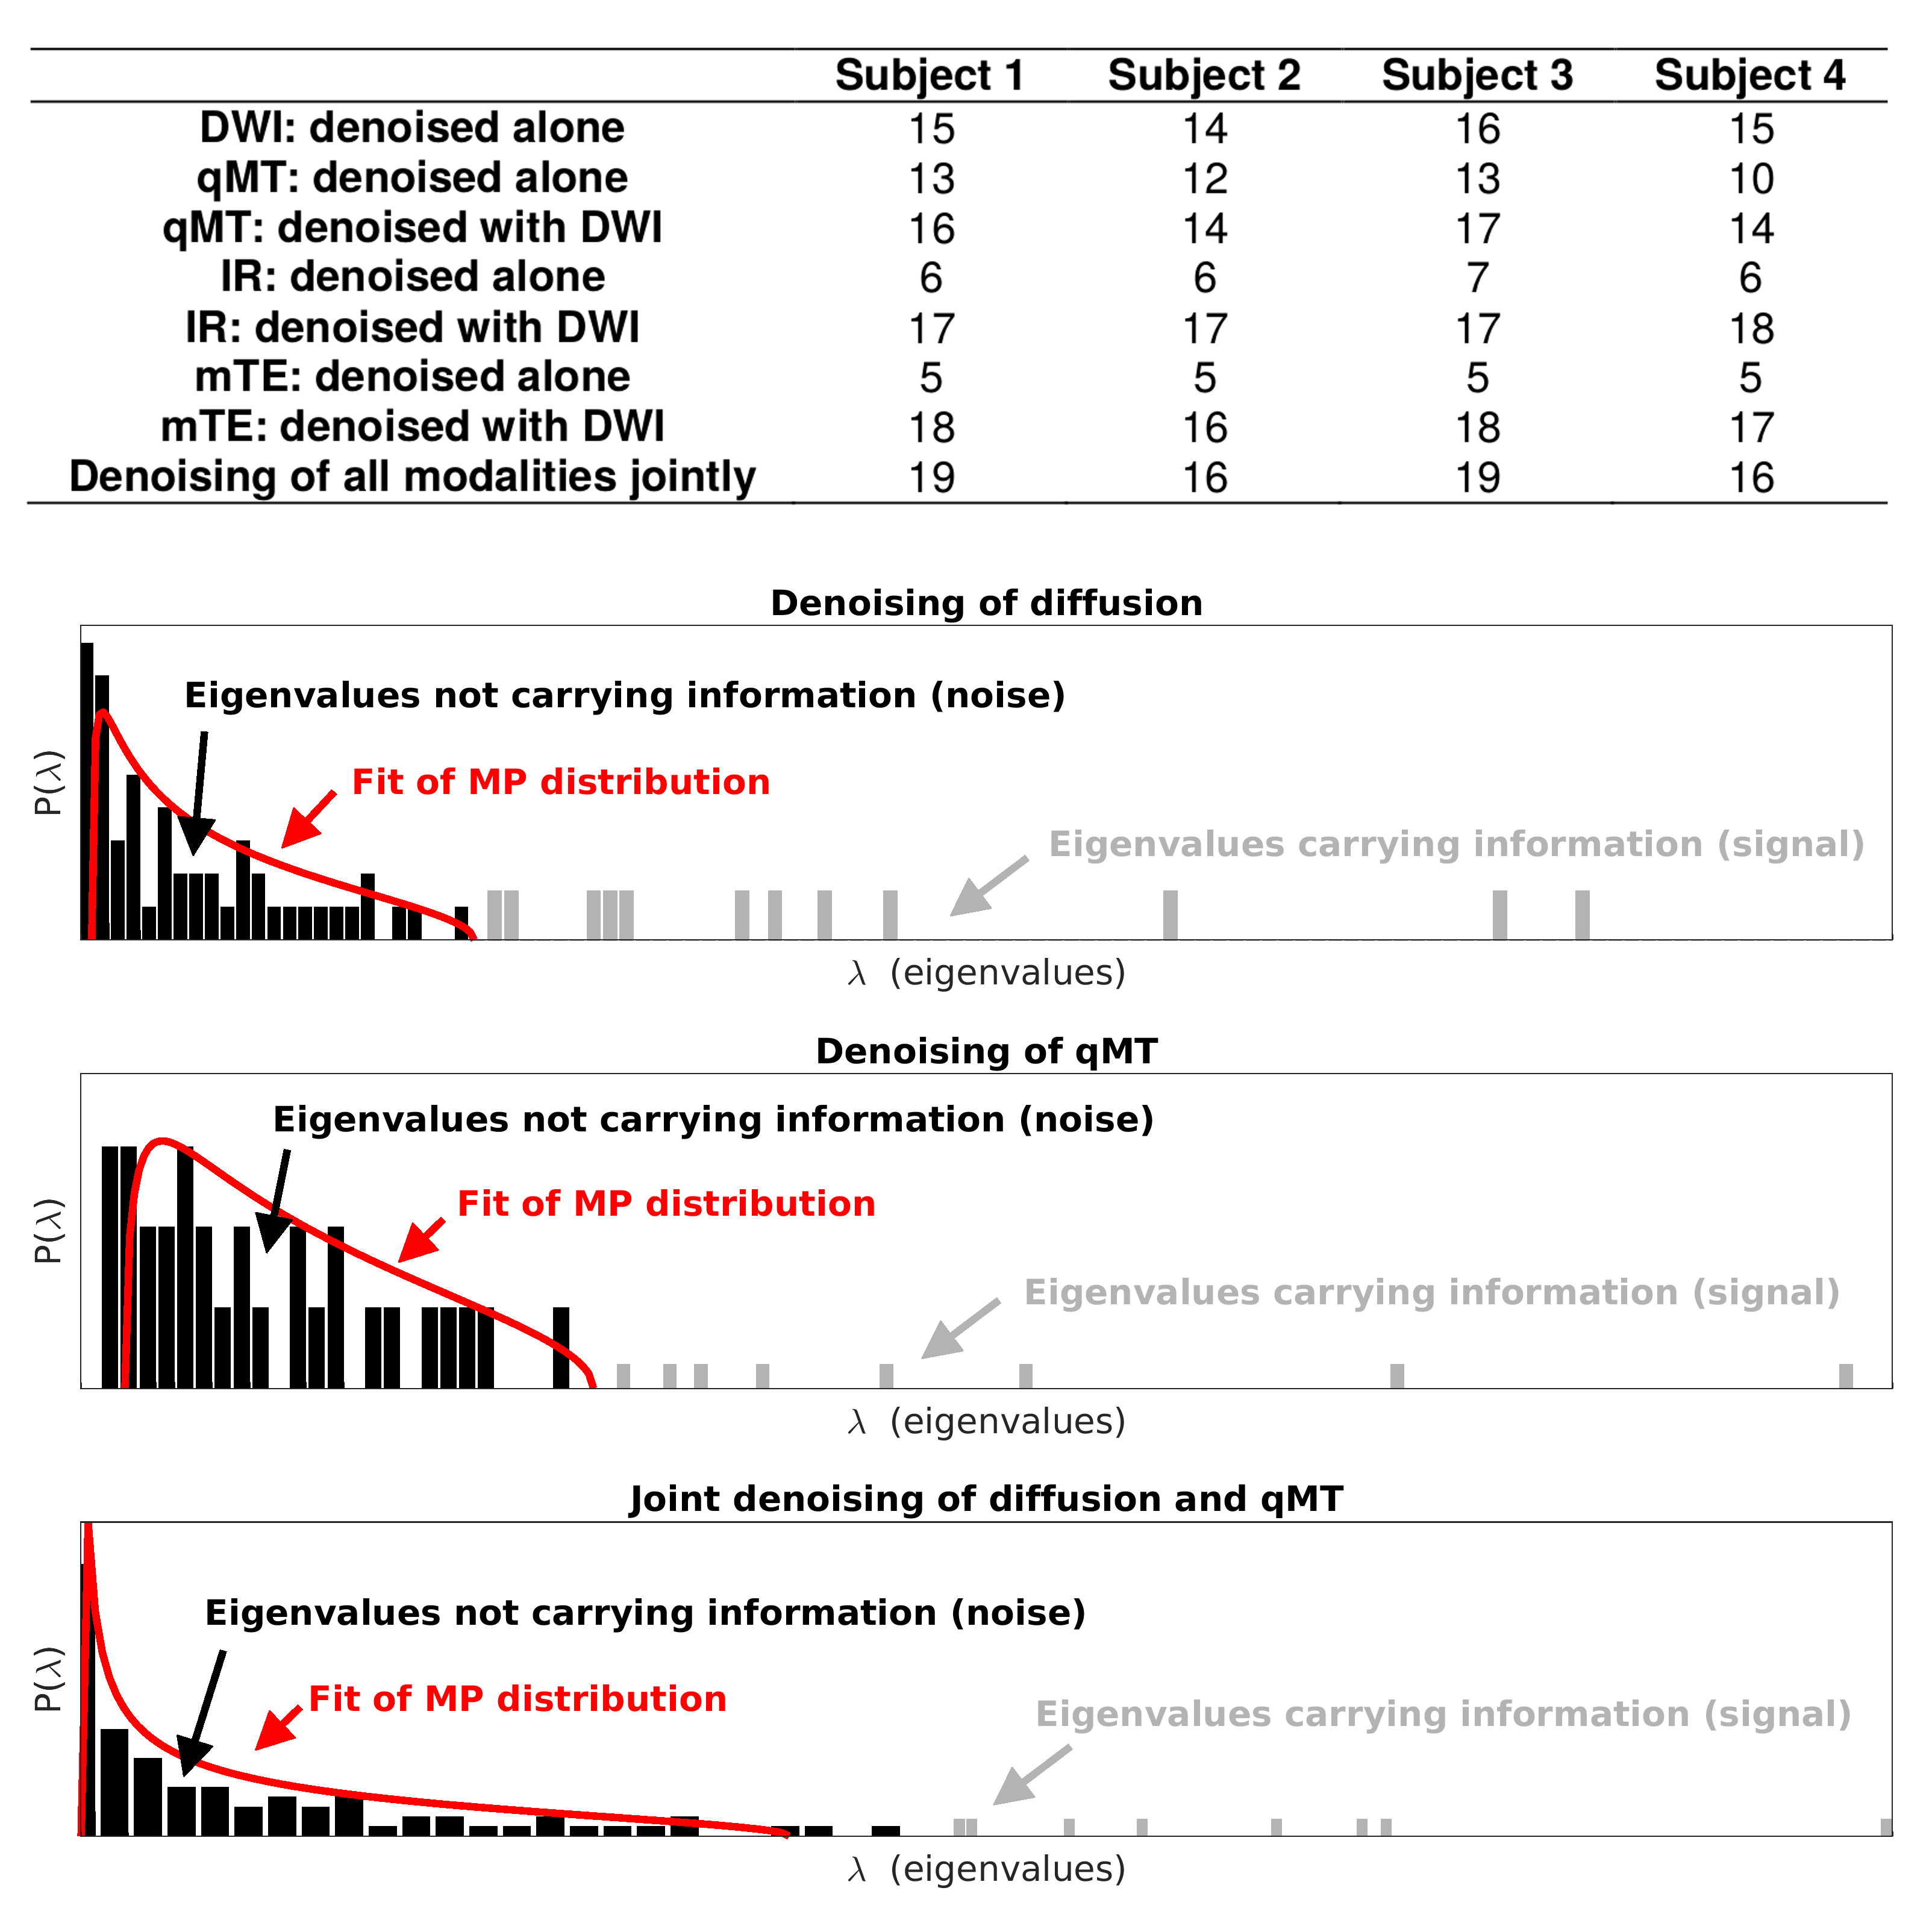
Significant signal components detected in vivo by MP-PCA and examples of noise/signal distributions are reported figure 3. Importantly, the number of components detected when concatenating modalities is smaller than the sum of the components detected in each modality separately, suggesting that the microstructural information in different modalities is not completely independent, i.e. modalities are not fully orthogonal. This additional layer of redundancy enables more effective denoising on modalities with fewer measurements.
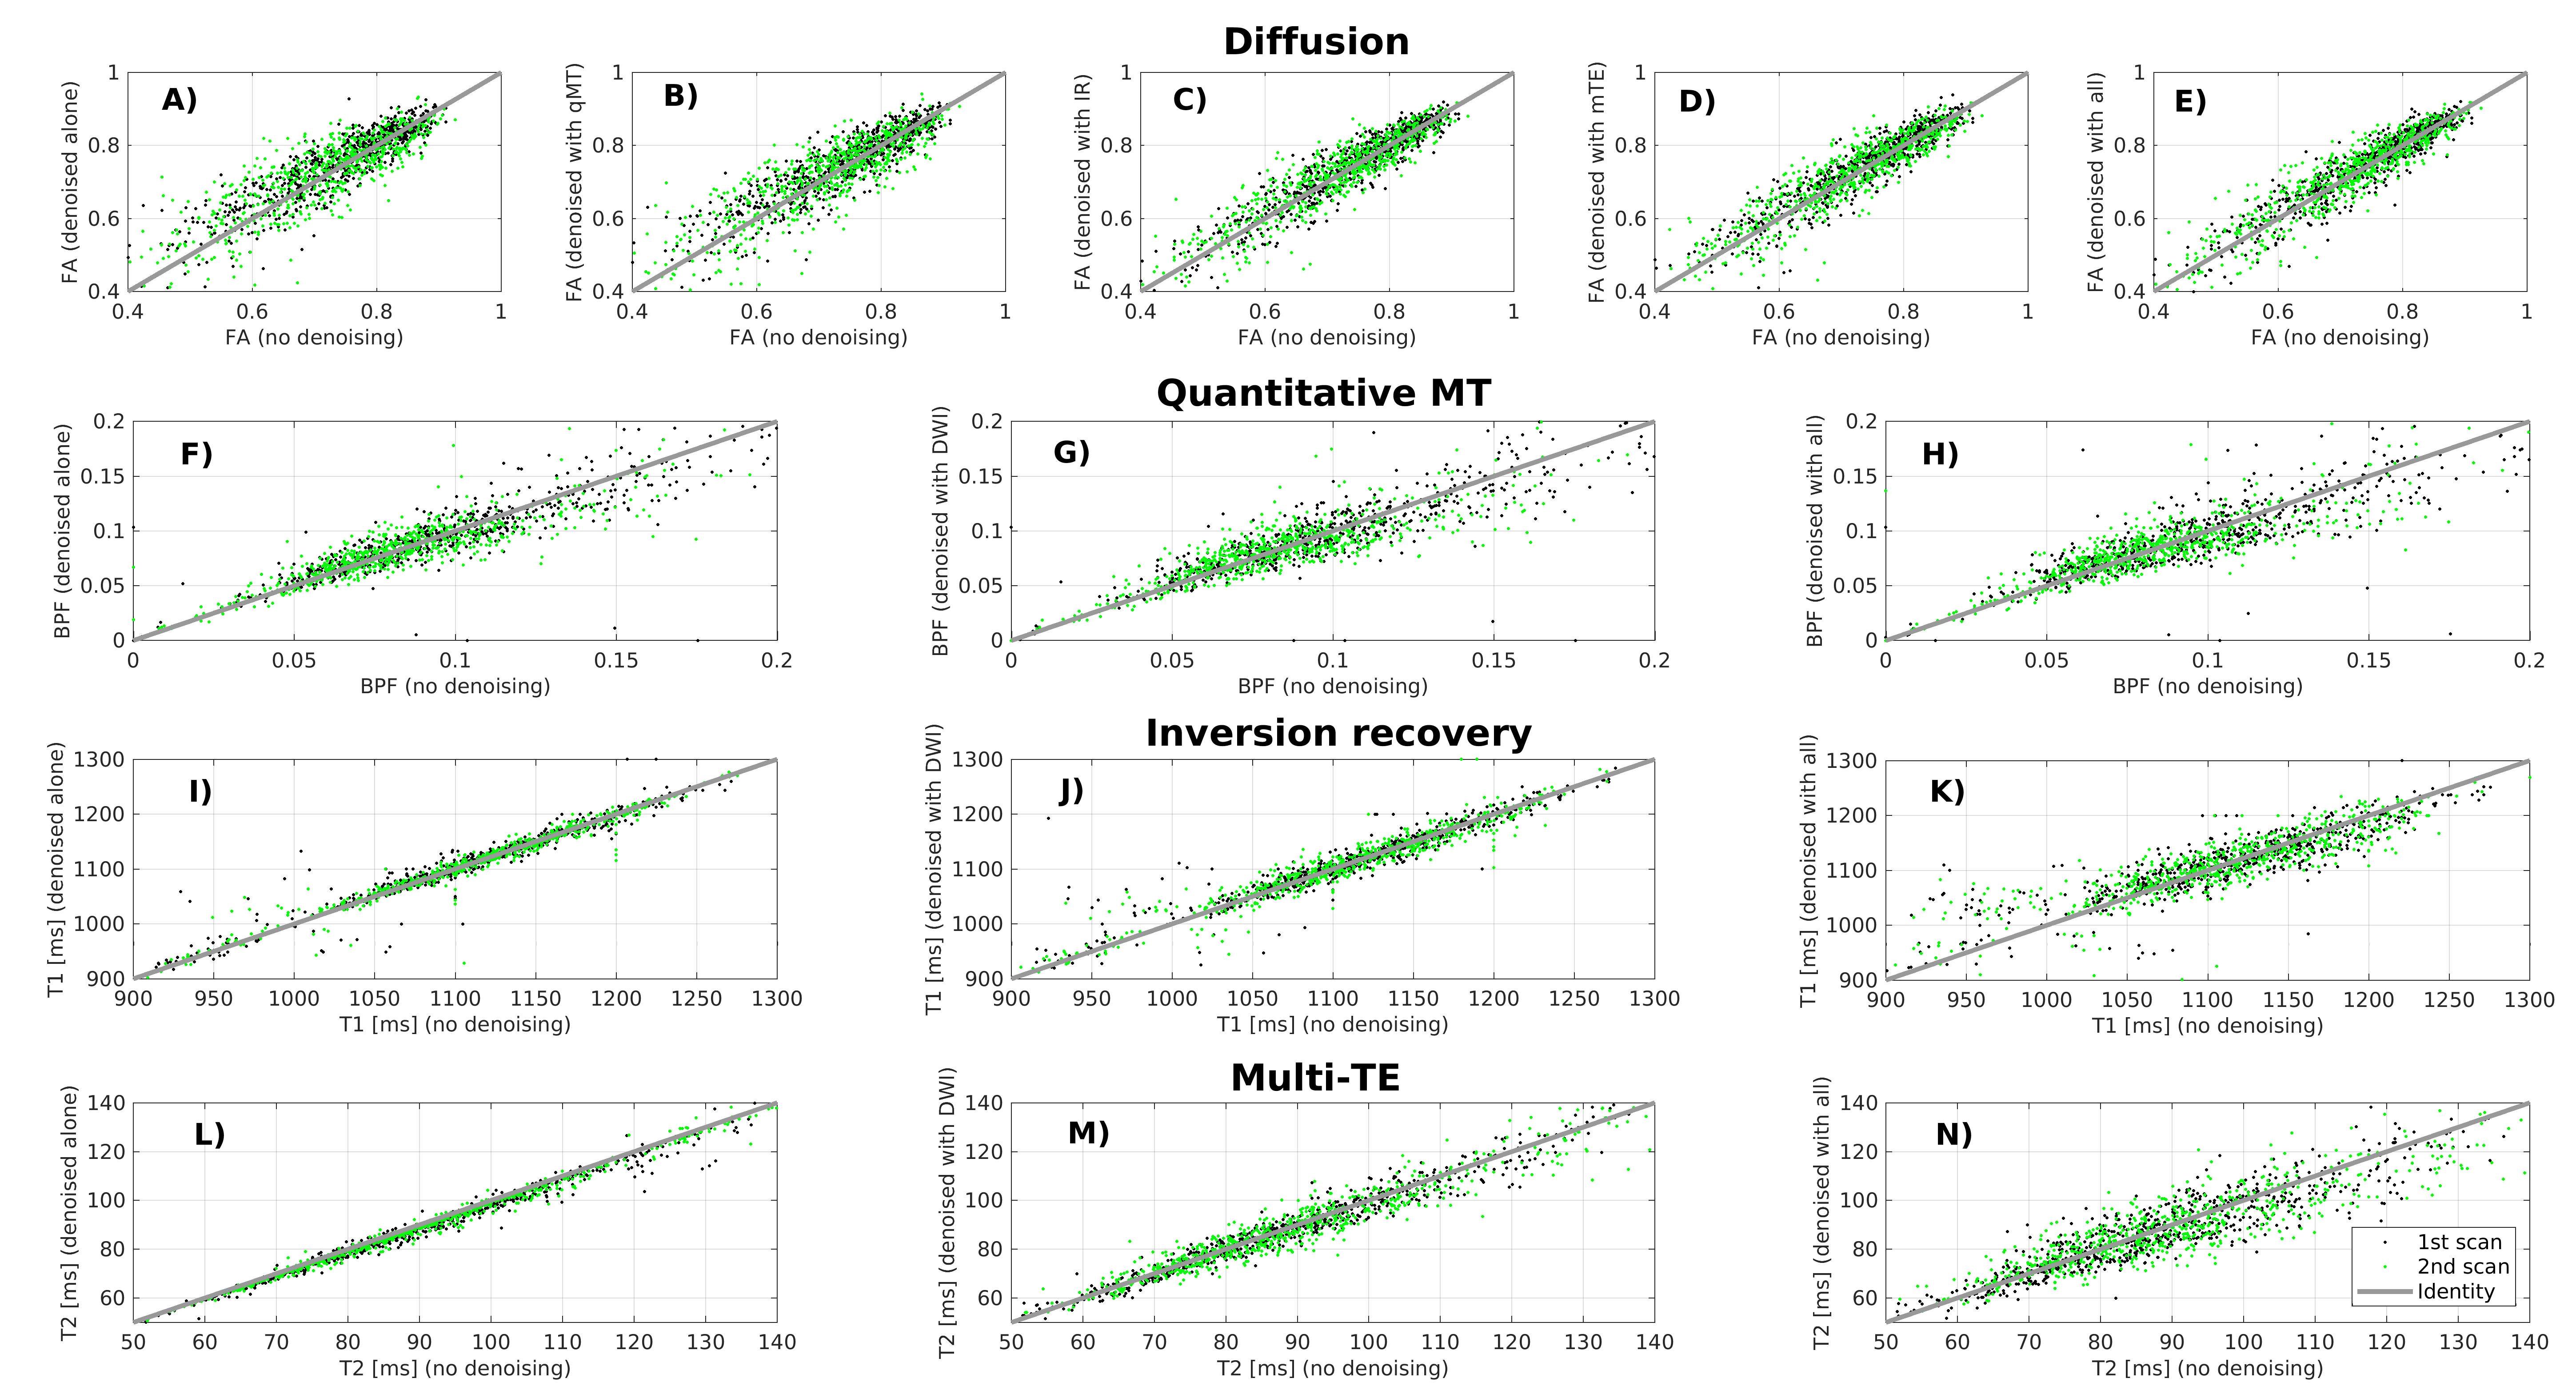
Figure 4 shows scatter plots of quantitative metrics obtained on noisy/denoised data in vivo in one subject. Denoising does not introduce significant biases on the metrics. Similar results are observed in all subjects. Our next step will be to study the implications of denoising in terms of scan-rescan repeatability.
Figure 5 shows results from simulations, which support observations in vivo. The precision in estimating the underlying signal for minimally-redundant acquisitions (mTE and IR) improves when denoising relies on the additional redundancy of richer data sets. Median error (accuracy) reveals a small but finite residual noise floor bias in DW imaging.
Conclusions
We demonstrate that MP-PCA denoising is a powerful tool for pre-processing of multi-modal spinal cord qMRI contrasts. Multi-modal protocols with unified signal readout are synergistic: they enable additional boosting of denoising performances, specifically in modalities with limited number of measurements (i.e. low redundancy), by exploiting common signal features borrowed from more redundant acquisitions.Acknowledgements
Our volunteers. EPSRC (M020533, N018702, EP/I027084/1, G007748, EP/H046410/1, EP/J020990/1, EP/K005278). CMIC Pump-Priming Awards. Horizon2020-EU.3.1 (ref: 634541). UK MS Society. NIHR Biomedical Research Centres (BRC R&D03/10/RAG0449). International Spinal Research Trust, Wings for Life and Craig H. Neilsen Foundation (INSPIRED). The last two authors are joint senior authors.References
1. Veraart J, Fieremans E and Novikov DS. Diffusion MRI noise mapping using random matrix theory. Magn Reson Med 2016; 76(5): 1582-1593.
2. Veraart J, Novikov DS, Christiaens D, et al. Denoising of diffusion MRI using random matrix theory. NeuroImage 2016; 142: 394-406.
3. Wheeler-Kingshott C, Stroman PW, Schwab JM, et al. The current state-of-the-art of spinal cord imaging: applications. NeuroImage 2014; 84(1): 1082-1093.
4. Wheeler-Kingshott CA, Parker GJ, Symms MR, et al. ADC mapping of the human optic nerve: increased resolution, coverage, and reliability with CSF-supressed ZOOM-EPI. Magn Reson Med 2002; 47(1): 24-31.
5. Battiston M, Grussu F, Ianus A, et al. An optimised framework for quantitative magnetisation transfer imaging of the cervical spinal cord in vivo. Magn Reson Med 2017 (early view ahead of print; DOI: 10.1002/mrm.26909).
6. Battiston M, Schneider T, Prados F, et al. Fast and reproducible in vivo T1 mapping of the human cervical spinal cord cord. Magn Reson Med 2017 (early view ahead of print; DOI: 10.1002/mrm.26852).
7. De Leener B, Lévy S, Dupont SM, et al. SCT: Spinal Cord Toolbox, an open-source software for processing spinal cord MRI data. NeuroImage 2017; 145(Pt A): 24-43.
8. Basser PJ, Mattiello J, LeBihan D. Diffusion tensor spectroscopy and imaging. Biophys J 1994; 66(1): 259-267.
9. Grussu F, Schneider T, Zhang H, et al. Neurite orientation dispersion and density imaging of the healthy cervical spinal cord in vivo. NeuroImage 2015; 590-601.
10. Henkelman RM, Huang X, Xiang QS, et al. Quantitative interpretation of magnetization transfer. Magn Reson Med 1993; 29(6): 759-766.
11. Smith SA, Edden RA, Farrell JA, et al. Measurement of T1 and T2 in the cervical spinal cord at 3 Tesla. Magn Reson Med 2008; 60(1): 213-219.
12. Volz S, Nöth U, Jurcoane A, et al. Quantitative proton density mapping: correcting the receiver sensitivity bias via pseudo proton densities. NeuroImage 2012; 63(1): 540-552.
13. Gudbjartsson H and Patz S. The Rician distribution of noisy MRI data. Magn Reson Med 1195; 34(6): 910-914.
14. Koay CG and Basser PJ. Analytically exact correction scheme for signal extraction from noisy magnitude MR signals. J Magn Reson 2006; 179(2): 317-322.
15. De Leener B, Kadoury S, Cohen-Adad J. Robust, accurate and fast segmentation of the spinal cord. NeuroImage 2014; 98: 528-536.
16. Veraart J, Sijbers J, Sunaert S, et al. Weighted linear least squares estimation of diffusion MRI parameters: strengths, limitations, and pitfalls. NeuroImage 2013; 81: 335-346.
Figures