2750
STAGE Imaging at 1.5T: A Rapid Brain Protocol Providing More Images As Well As Quantitative Data1Neusoft Medical System, Shanghai, China, 2Shanghai Key Laboratory of Magnetic Resonance, East China Normal University, Shanghai, China, 3The MRI Institute for Biomedical Research, Detroit, MI, United States, 4Sino-Dutch Biomedical and Information Engineering School, Northeastern University, Shenyang, China, 5Department of Radiology, School of Medicine, Wayne State University, Detroit, MI, United States
Synopsis
Many image contrasts are necessary in clinical magnetic resonance imaging (MRI) including qualitative and quantitative images, which traditionally take a long acquisition time. STrategically Acquired Gradient Echo (STAGE)1,2,3 is a rapid imaging method which can acquire multiple qualitative and quantitative images with good resolution and SNR in just 5 minutes at 3T. In this work, the STAGE concept is optimized, and further extended to 1.5T. A total of 11 high quality clinically meaningful images, and 2 field maps, were produced with 0.67x1.33x2.7 mm3 resolution in a single 9-min scan on a NMS 1.5T system covering the whole brain.
INTRODUCTION
Many types of contrasts such as PDW, T1W, FLAIR, T2*W, DWI, SWI, and quantitative images are needed for a good clinical diagnosis of disease. Conventional imaging schemes require a long acquisition time for a full set of contrasts. Recently, a rapid imaging technology referred to as STrategically Acquired Gradient Echo (STAGE) has been introduced1,2,3. STAGE provides full brain imaging in 5 minutes with multiple contrasts at 3T. The purpose of this work is to optimize and extend STAGE to 1.5T. Eleven(11) co-registered high quality clinically meaningful images were produced with 0.67x1.33x2.7 mm3 resolution covering the whole brain in a single 9-min on a NMS 1.5T system.METHODS
Sequence Design The extended STAGE protocol consists of two fully flow compensated triple-echo 3D susceptibility weighted imaging (SWI) gradient echo scans1 with different echo times and flip angles that constitute standard clinical imaging needs except for DWI and FLAIR.
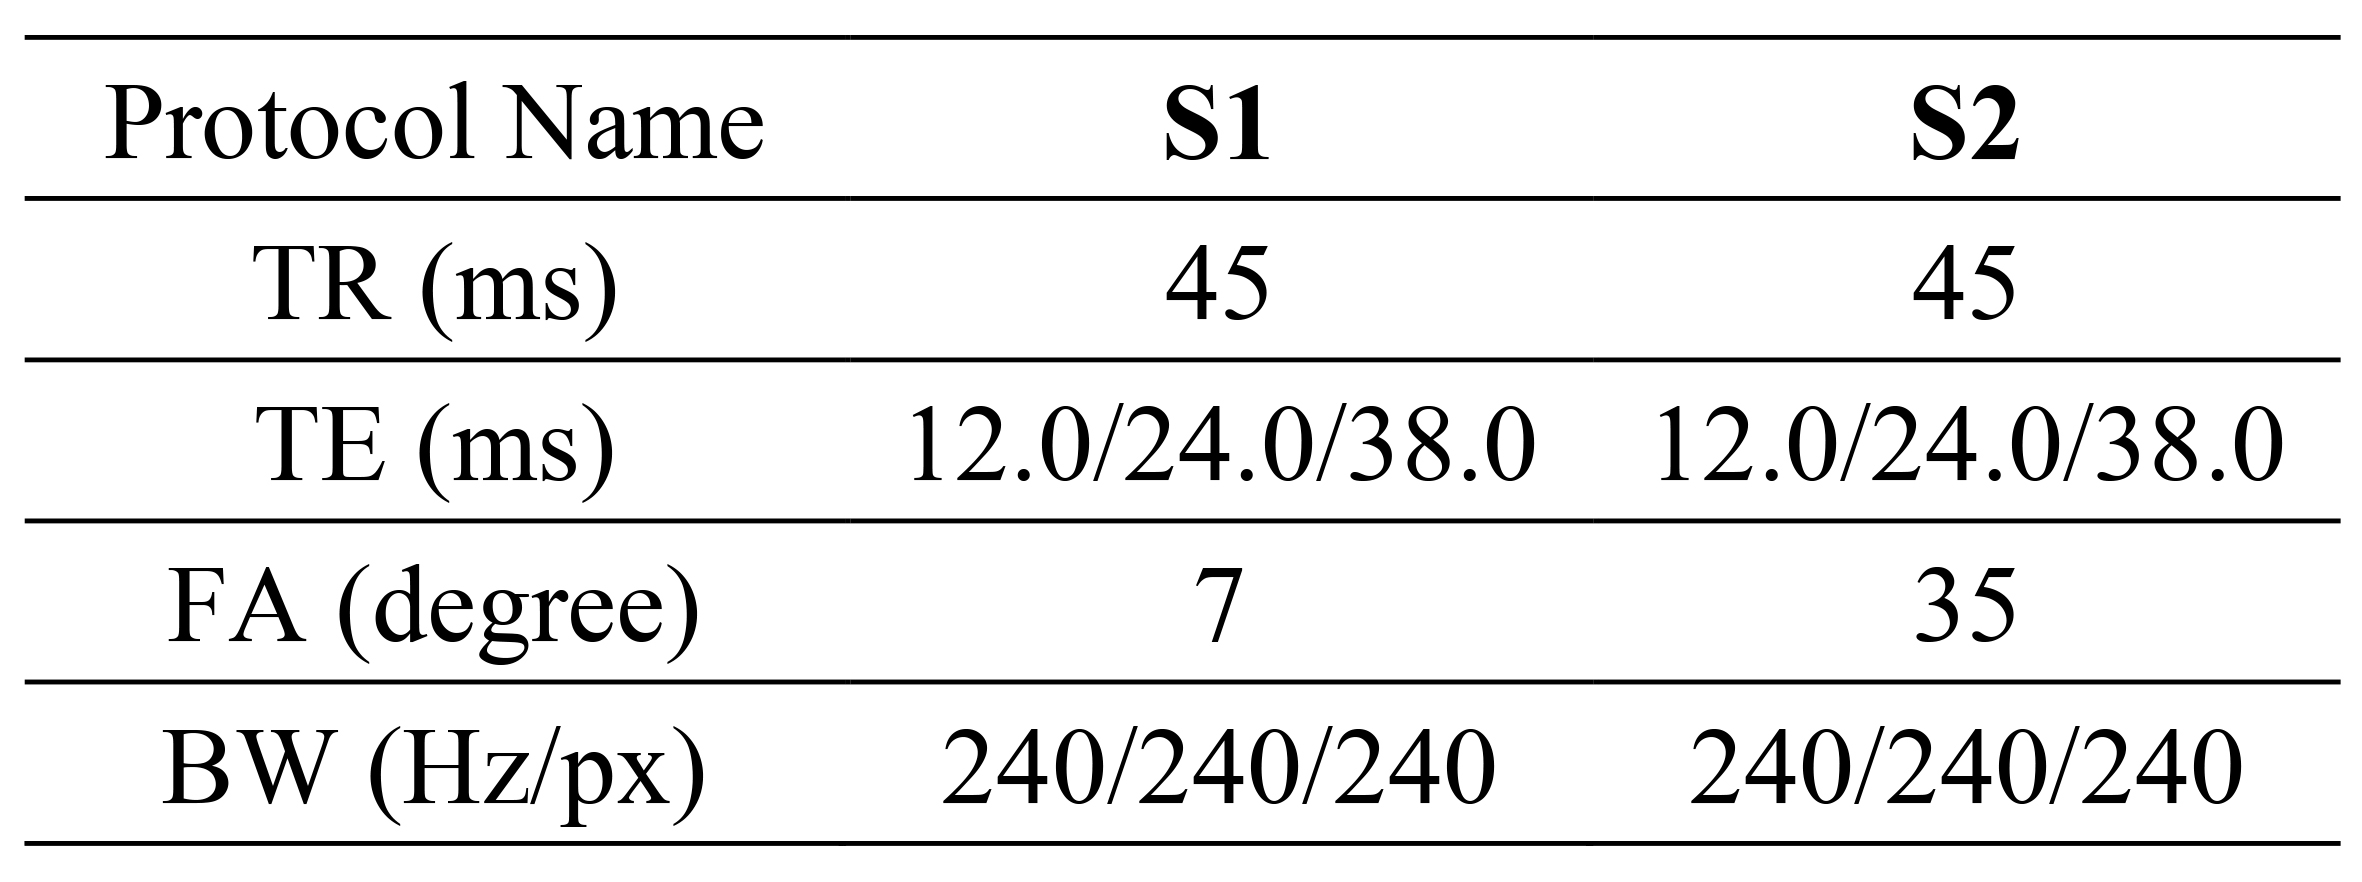
Data Acquisition Three healthy volunteers were scanned on a NMS S15P 1.5T system (Neusoft Medical System, Shenyang, China) with an 8-channel head coil (NMS, Shenyang, China). Using a SENSE factor of 1.5 along the L-R direction, six 3D axial images with a resolution 0.67x1.33x2.7 mm3, 48 transversal slices, were acquired in 9-min. Table 1 provides the imaging parameters, which were optimized for 1.5T to achieve the highest SNR and CNR.
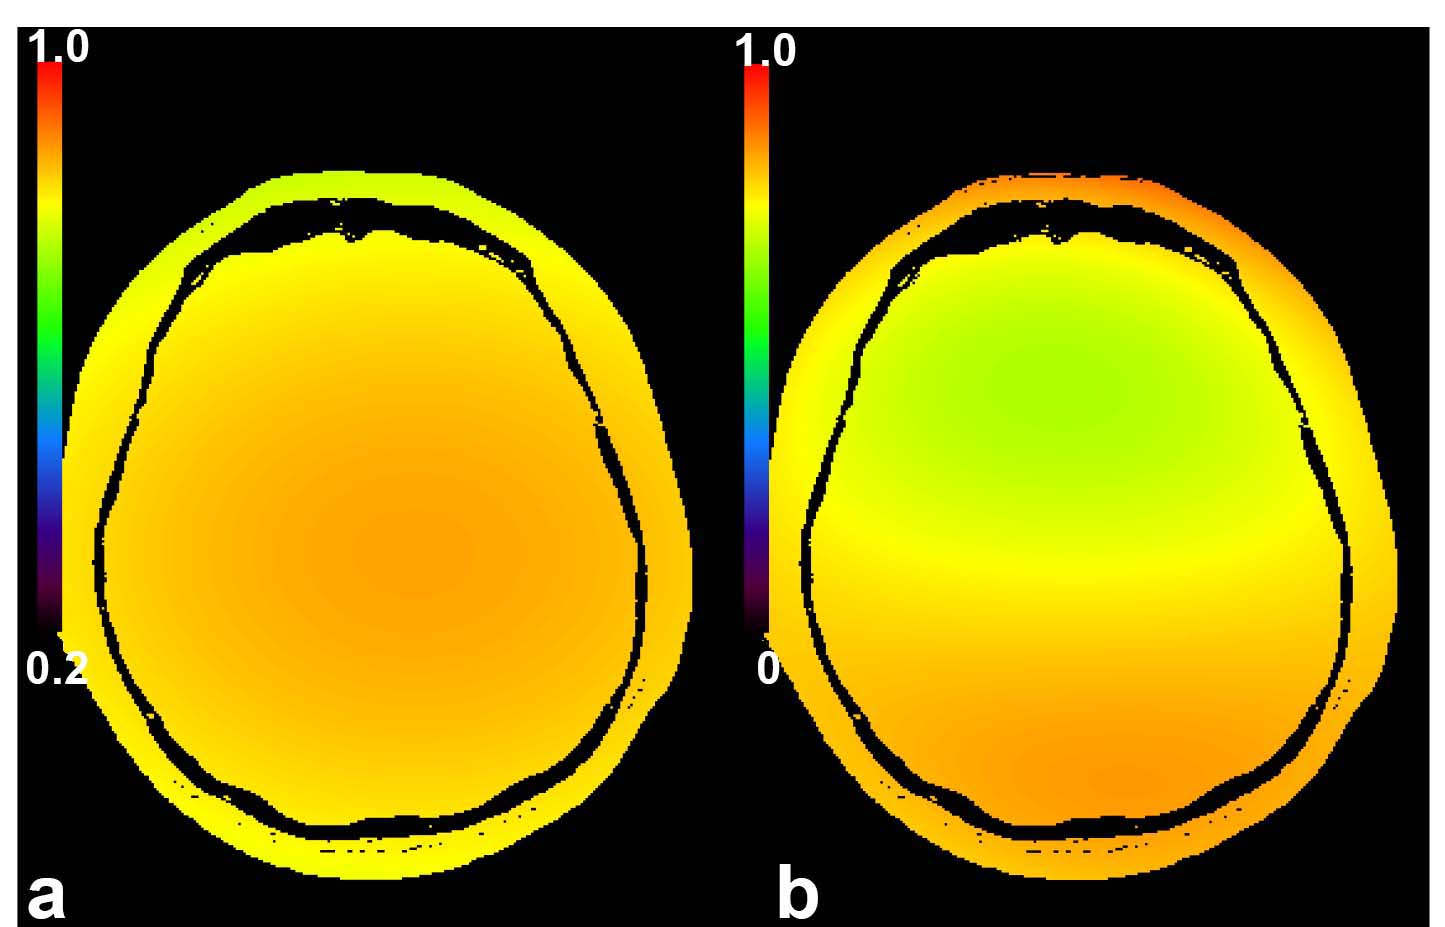
Data Processing T1W, PDW, enhanced T1W (eT1W), T1 map, PD map, R2* map, SWI, true-SWI or tSWI, QSM were calculated using the scheme in [1] with a slight modification to produce higher SNR. Also, because the accuracy of the T1 and PD maps are related to B1, it is critical to make radiofrequency (RF) field corrections. The scheme introduced in [2] for the calculation of B1+ and B1- without additional data acquisition was modified for 1.5T to create more accurate T1 and PD maps in this work. This was accomplished by assuming that the T1 of WM equals 600 ms, T1 of GM equals 1000 ms at 1.5T, and then synthesizing an image for 1.5T to make WM/GM isointense by using a flip angle of 20° with TR = 45 ms and TE = 10 ms. A simulated FLAIR (sFLAIR) was calculated using T2* instead of T2. Finally, a low resolution MRA was investigated that was capable of displaying large arteries generated from the maximum intensity projection (MIP) of the first echo T1W images.
RESULTS
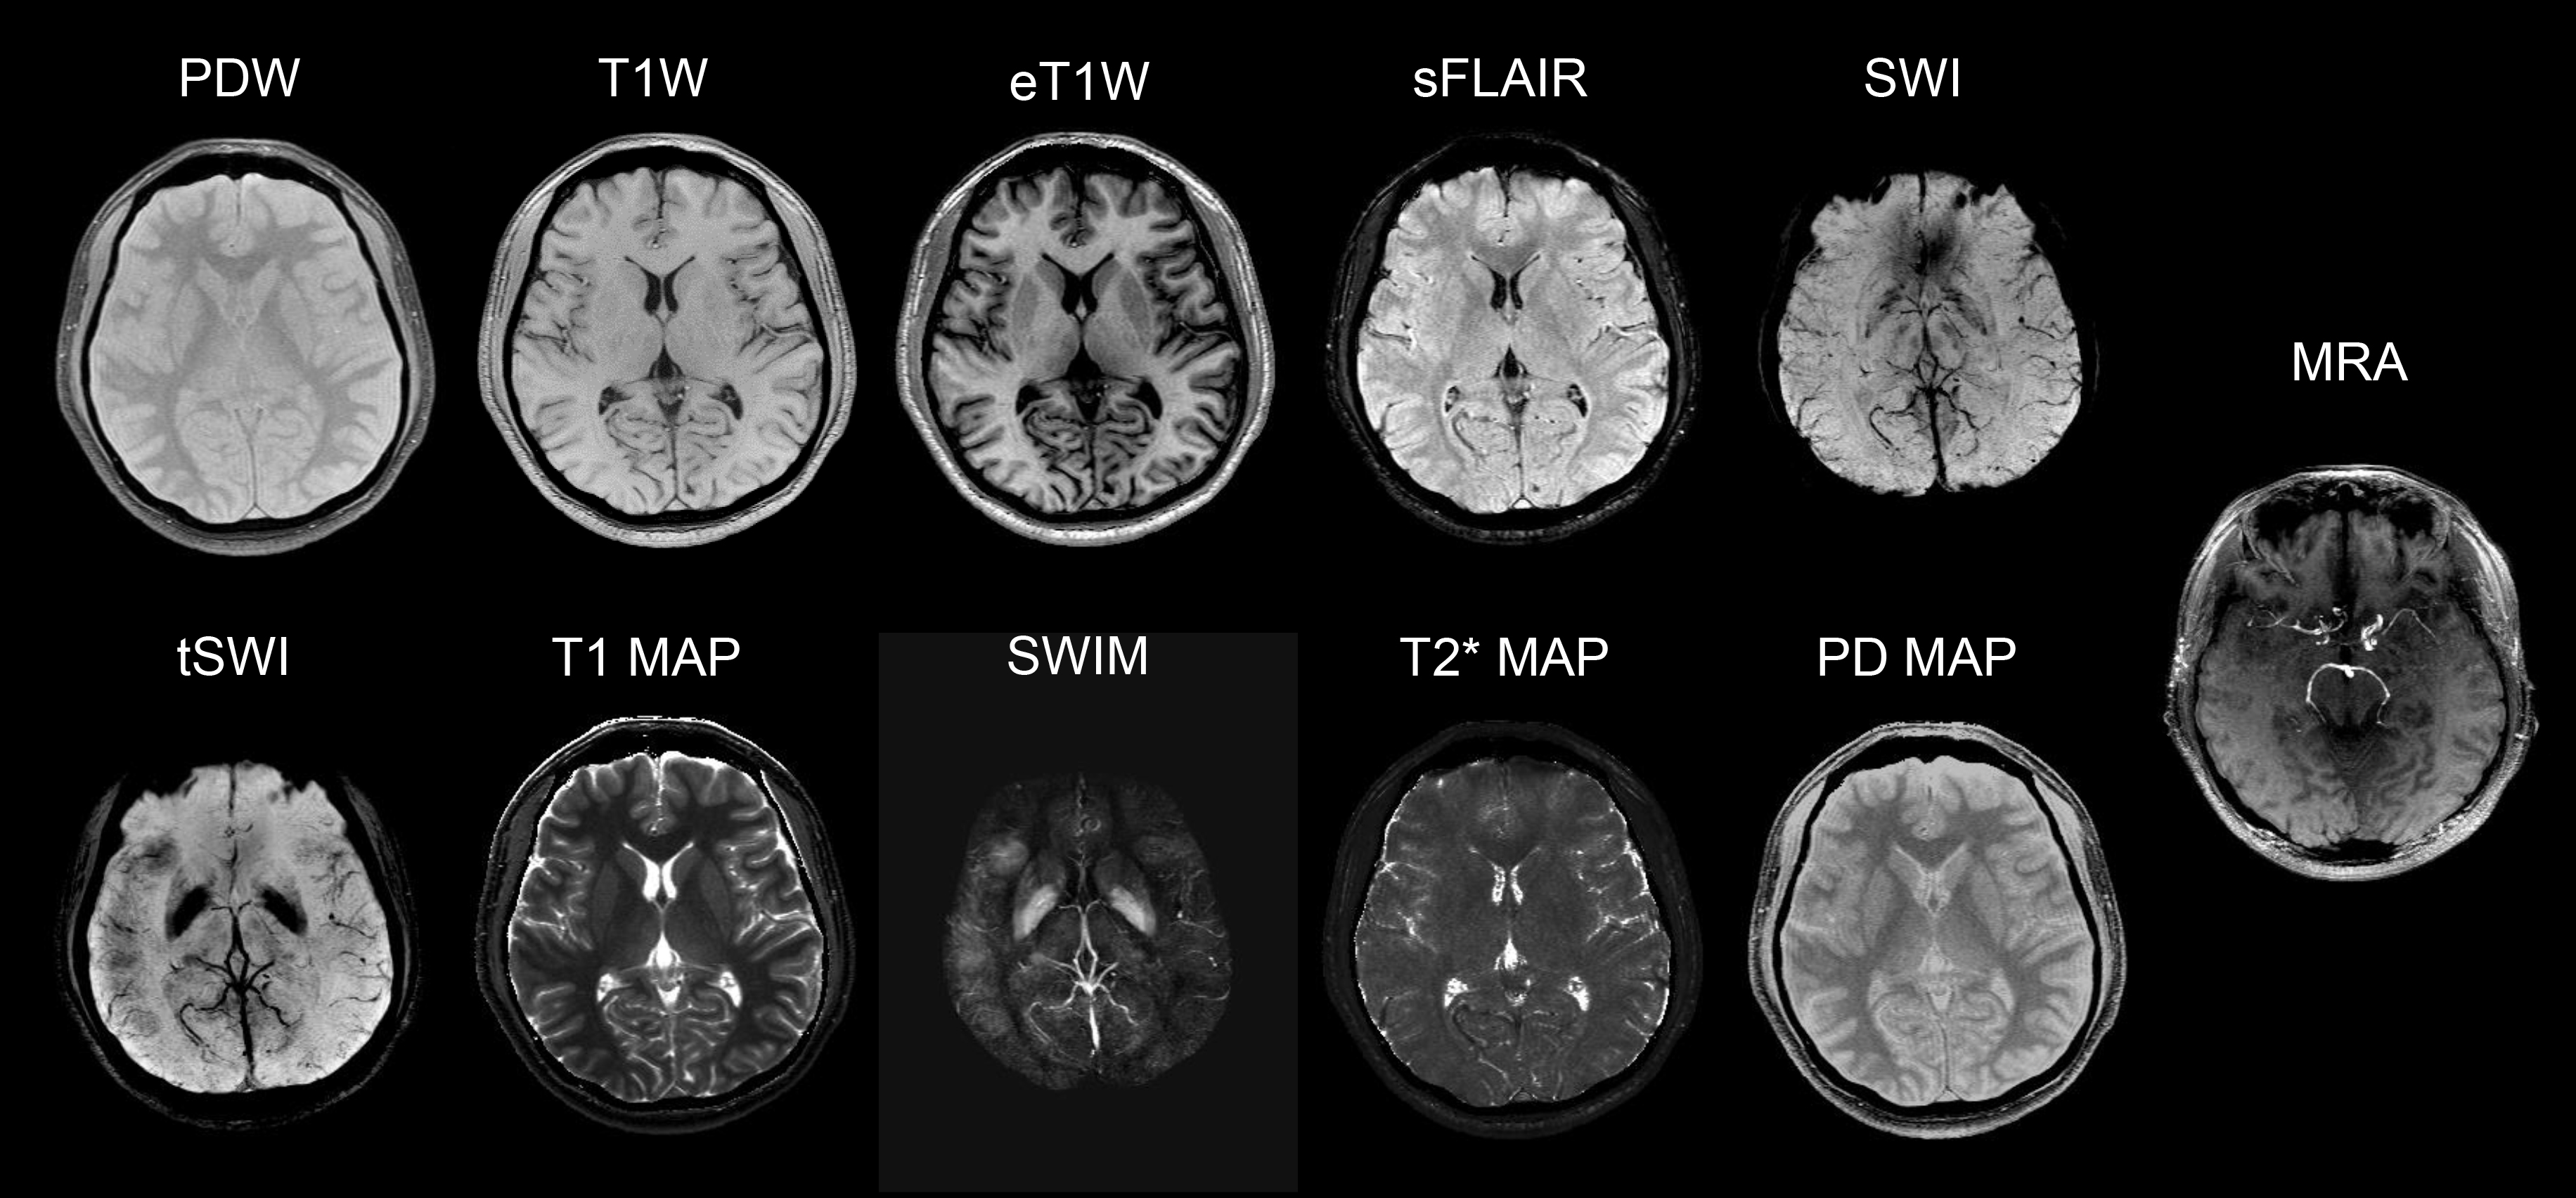
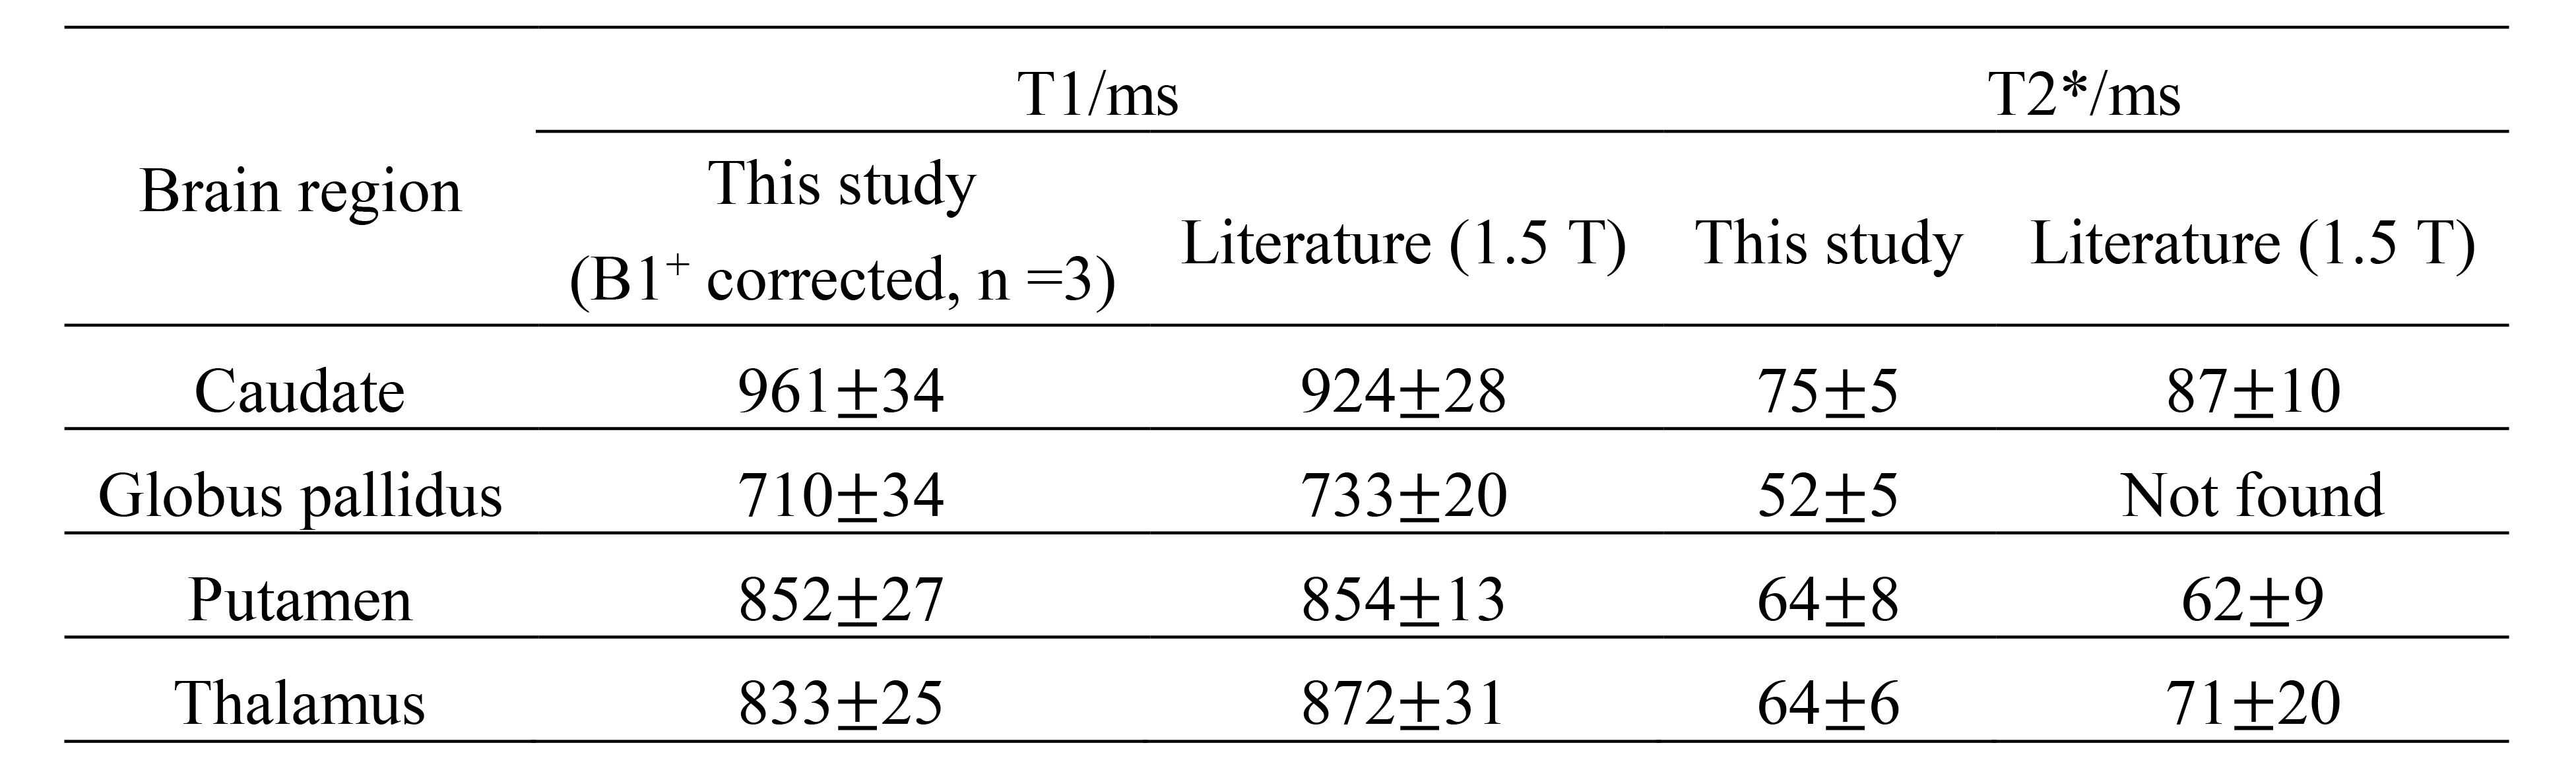
With the 6-echo data set, eleven 3D images were produced: T1W, PDW, FLAIR, enhanced T1W, SWI, tSWI, T1 map, PD map, T2* map, QSM and MRA. In addition, 2 field maps were extracted. Figure 1 provides the results from one volunteer. Figure 2 provides the calculated B1+ and B1- map. Table 2 provides the comparison of the calculated T1 and T2* value with those in literature4-8.DISCUSSION
STAGE provides one solution for acquiring multiple contrasts in one scan. At 1.5T, eleven high resolution, good SNR and co-registered images were generated in a 9-min scan. Moreover, 1) Images are generated with excellent contrast, such as sFLAIR and eT1W shown in Figure 1. Both SWI and tSWI provide clear visualization of veins and other high susceptibility structures. QSM shows good visualization and accuracy of veins and basal ganglia compared to high resolution QSM; 2) Table 2 demonstrates that STAGE can provide similar quantitative estimates for T1 and T2* as published in other studies4-8. Clinically, these images can be used for detecting thrombus and hemorrhage in stroke, and in clinically assessing many other neurodegenerative diseases. The acquisition time for collecting all of the data available in the STAGE protocol is much shorter than running the conventional single contrast scans. Compared to state-of-art MR Fingerprinting9,10, STAGE provides direct quantitative maps for brain with higher resolution in a shorter acquisition time with rapid reconstructions, as well as lower requirement to the MR system. Compared to Synthetic MR11, STAGE provides additional SWI and QSM data. In the feasibility test, only conservative SENSE factor 1.5, is used. Fast imaging methods to further reduce the acquisition time will be report separately.CONCLUSION
STAGE provides a clinically applicable scheme to acquire multiple high resolution, good SNR, co-registered 3D, clinically meaningful images, in single rapid scan at 1.5T.Acknowledgements
No acknowledgement found.References
[1] Chen Y, etc., Magn Reson Imag, 2017, doi:10.1016/j.mri.2017.10.005. [2] Wang Y, etc., Magn Reson Imag, 2017, doi: 10.1016/j.mri.2017.10.006. [3] Chen Y, etc., ISMRM 2017; p1215. [4] Deichmann R, Magn Reson Med 2005; 54:20-27. [5] Deoni SCL, etc., Magn Reson Med 2005; 53:237-241. [6] Rooney WD, etc., Magn Reson Med 2007; 57:308-318. [7] Oros-Peusquens AM, etc., Magn Reson Mater Phy 2008; 21:131-147. [8] Warntjes JB, etc., MRM 2007; 60:320-329. [9] Ma D, etc., Natural, 2013; 495(7440): 187–192. [10] Ma D, etc., Magn Reson Med 2017, 78:1781–1789. [11] Gulani V, etc., Investigative radiology. 39(12): 676–774.Figures