2749
Radiomics based strategy for identifying poorly differentiated HCC by using precontrast MRI1Department of Radiology, The First Affiliated Hospital of Dalian Medical University, Dalian, China, 2Huiying Medical Technology Co., Ltd., Beijing, China, 3GE Healthcare, MR Research, Beijing, China
Synopsis
This work aimed for a radiomics based strategy to identify poorly differentiated hepatocellular carcinoma (HCC) which may own a high risk of recurrence or metastasis. By comparing the performance of four classifiers (decision tree, DT; random forest, RF; k-nearest neighbors, KNN; logistic regression, LR) on dual-echo T1WI (in-phase and out-phase), T2WI and DWI images, we found that LR achieved the best result (AUC: 0.95; sensitivity: 0.75; specificity: 0.85) on DWI images, forming a valuable strategy for clinical practice.
Purpose
This study aims to present a radiomics based strategy for grading poorly differentiated hepatocellular carcinoma (HCC) with pre-contrast MR images.Introduction
HCC is the most common type of primary liver cancer and it has caused high morbidity and mortality1. Poor differentiation of HCC would be a risk factor for tumor seeding or intrahepatic dissemination after treatment delivery2. At present, the pathological analysis of tumor samples derived from surgery or puncture is a gold criteria to determine histological grade of HCC. Noninvasive and precise identification of HCC grade is extremely valuable for preoperative clinical practice. Radiomics (a quantitative practice of robust high-dimensional data derived from medical images) has been a hotspot in recent years. Some studies have suggested that radiomics can be effective for grading tumors such as glioma and bladder cancer3,4. We hypothesize that it’s feasible to grade HCC by radiomics based strategy.
Material and Methods
The present study retrospectively enrolled 120 patients who were pathologically confirmed as HCC, including 52 poorly differentiated HCCs and 68 non-poorly (well or moderately) differentiated HCCs. All patients have underwent preoperative MRI, including in-phase and out-phase T1WI, T2WI and DWI. Two radiologists with 3 years of clinical experience were blinded to all patients’ data and manually outlined the ROIs which enclose the boundary of target lesions. The radiomics features included first order statistic, shape, gray level co-occurrence matrix (GLCM), gray level run length matrix (GLRLM) and gray level size zone matrix (GLSZM) and these features were further transformed with exponential, square, square root, logarithm and wavelet (wavelet-LHL, wavelet-LHH, wavelet-HLL, wavelet-LLH, wavelet-HLH, wavelet-HHH, wavelet-HHL and wavelet-LLL). After that, features were analyzed with variance threshold and LASSO on each sequence. Then, four classifiers, including decision tree (DT), random forest (RF), k-nearest neighbors (KNN), logistic regression (LR), were used to identify poorly differentiated HCC. At last, the diagnostic performance of the radiomics based strategy was quantified with the area under receiver-operating characteristic curve (AUC), sensitivity and specificity. The schematic diagram of the proposed radiomics strategy was shown in Fig.1.
Results
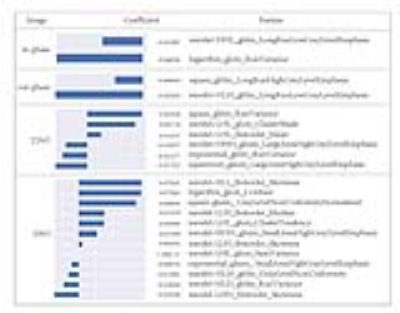
Extracted features may quantitatively represent the lesions on in-phase T1WI, out-phase T1WI, T2WI and DWI images. Fig.2 showed the features and their coefficients in LASSO analysis. Then, ROC was used to evaluate the prediction performance of four classifiers on each sequence (Fig.3). Focusing on AUC which was greater than or equal to 0.80, four classification strategies were present: KNN model on out-phase images, LR model on in-phase, T2WI and DWI images. Results indicated that LR analysis on DWI images (AUC: 0.95; sensitivity: 0.75, specificity: 0.85) was the optimal strategy to identify poorly differentiated HCC.Discussion and Conclusion
The radiomics based strategy has shown great potential in grading HCC, and DWI images contain more useful cues of poorly differentiated HCC by using LR classifier. This result was consistent with the previous study which suggested that signal intensity on DWI images was potential predictor of histological grade of HCC5. In addition, we obtained twelve features to quantitatively analyze DWI images. Although these features involve first order statistic, shape, GLCM, GLRLM, GLSZM and various transformation, we still believe richer features are necessary to explore. To our best knowledge, this is the first study of MR based radiomics strategy to grade HCC, further study will be performed to optimize the performance of the predictor and verifying its utility.Acknowledgements
No acknowledgment found.References
[1]. Omata M, Cheng AL, Kokudo N, et al. Asia-Pacific clinical practice guidelines on the management of hepatocellular carcinoma: a 2017 update. Hepatology International, 2017, 11(4):317.
[2]. Regimbeau J M, Abdalla E K, Vauthey J N, et al. Risk factors for early death due to recurrence after liver resection for hepatocellular carcinoma: Results of a multicenter study. Journal of Surgical Oncology, 2004, 85(1):36-41.
[3] Kang Y, Choi S, Kim Y, et al. Gliomas: histogram analysis of apparent diffusion coefficient maps with standard- or high-b-value diffusionweighted MR imaging-correlation with tumor grade. Radiology, 2011, 261:882–890.
[4] Zhang X, Xu X, Tian Q, et al. Radiomics assessment of bladder cancer grade using texture features from diffusion-weighted imaging. Journal of Magnetic Resonance Imaging Jmri, 2017
[5] Nasu K, Kuroki Y, Tsukamoto T, et al. Diffusion-weighted imaging of surgically resected hepatocellular carcinoma: Imaging characteristics and relationship among signal intensity, apparent diffusion coefficient, and histopathologic grade. American Journal of Roentgenology, 2009, 193(2):438.
Figures


