2747
Deep learning based MR image diagnostic quality deduction to reduce patient recall1GE Global Research, Bangalore, India, 2GE Global Research, Niskayuna, NY, United States, 3GE Global Research, Garching bei München, Germany
Synopsis
In this abstract, we describe a fast and robust methodology to highlight on-console, the diagnostic quality of acquired MRI imaging data. Specifically, using convolutional neural networks we flag the MRI volumes affected by motion and consequently hinder the diagnosis by clinician at the time of reading the exam. By prospectively flagging such exams at acquisition console itself and re-acquiring them with improved protocol will obviate the need for costly patient recall and re-scan in clinical setting.
Introduction
In clinical practice, MRI images are interpreted by radiologist at a later point of time after image acquisition. Consequently, any motion affected MRI data which hinders diagnosis results in patients being recalled and re-scanned. Overall, motion related disruptions in diagnosis result in substantive costs to the imaging centers [l]. In this work, we present an on-console, real-time deep learning (DL) based workflow to automatically highlight MRI images affected by motion and potentially affect diagnosis, provide MRI technician with a score of diagnostic quality and help take remedial action. Prior works on deep learning based motion detection were mainly focused on improving the accuracy of quantitative imaging [2-4]. On contrary, the goal of our work is to help optimize the clinical workflow by focusing on the utility of MRI data for accurate disease diagnosis.Methods
MRI Data: MRI data for the study was obtained from the brain studies of two clinical sites for different patient conditions such as stroke, tumors, tremors etc. A total of 441 unique patient studies were included in the study, with many patients being followed-up. An appropriate IRB approved all the studies. At both the sites, clinical data was acquired using 1.5T GE SignaHDxt MRI scanner and 8-channel brain and head-neck-spine coils. Data from different MRI protocols (T1W, T1W+CE, T2W, FLAIR) and with varied MRI scan parameters and orientations (TE/TR/Flip Angle/Resolution) were used in the study. Care was taken to choose all acquisitions only with cartesian k-space trajectory.
Data Labelling: Two trained radiologists
labelled each of the individual MRI volume as belonging to two classes (Figure
1): a.
Clinically Good (CG) - images
with no motion artifacts present or images with motion present but acceptable
for diagnostic purpose and b. Clinically Bad (CB) - images with motion artifacts present &
are not acceptable for diagnostic purposes. The radiologists also
identified the slices in the volume which belonged to CG and CB.
Deep Learning (DL) based classification
The overall DL based workflow is shown in Figure 2A. We trained a 2D-classification model, based on Convolutional Neural Network (CNN) to classify a given MRI slice as belonging to CG or CB class. For a new MRI volume, DL model predicts, for a given slice, probability value for CG and CB class. Next, we generate a goodness of volume score for the new MRI volume by computing geometric mean of predicted CG probabilities from all slices in a volume (=n√(P1 P2 ... Pn) where P1 P2 ... Pn are the predictions for each slice and 1, 2, … n are the slice numbers). Finally, the new volume is rated as CG if geometric mean > 0.5 and as CB if geometric mean < 0.5.
CNN Architecture: The CNN based classification architecture is shown in Figure. 2B [5]. Use of merge layers in architecture improve the robustness of the model [5]. Other DL hyper-parameters were: optimizer = “rmsprop”, loss function= “binary_crossentropy”, batch size = 32 and epochs = 20.
DL Experiment Details: We used a total pool of 17584 2D brain MRI images (9672 images of CG & 7912 images of CB class) for training. 10% of the input training data was used for validation (i.e. data never seen by training and fixed across epochs). The model with minimal validation loss is chosen as the best model for classification. Testing of the DL model was done on 68 MRI brain volumes (33 volumes (845 slices) of CG & 35 volumes (910 slices) of CB, which are completely unseen by the classifier in the training phase. We used area under the curve (AUC) as the metric for evaluating the per volume basis classification performance, with AUC > 90% being judged as excellent performance.
Results and discussion
Overall, we obtained an AUC of 98% for classifying a volume as belonging to CB or CG class (Figure 3). Figures 4-5 demonstrate the workflow for test CG and CB MRI volumes. The results indicate that the current workflow, by characterizing the motion trends across the scan in real-time, be used to: a. stop the scan if motion progressing towards clinically bad class b. Guide technician to a better protocol (e.g. propeller in case systemic motion) or c. guide technician to provide instructions to user.Conclusion:
We have demonstrated that the proposed DL based methodology can predict the diagnostic quality of the MRI brain volumes reliably with high AUC value. This will help the technician to decide if motion present in the data can affect diagnostic potential of the imaging volume. This will avoid patient-recall as well as unwanted repeat of clinically satisfactory scans.Acknowledgements
No acknowledgement found.References
1. Andre, Jalal B., et al. "Toward quantifying the prevalence, severity, and cost associated with patient motion during clinical MR examinations." Journal of the American College of Radiology 12.7 (2015): 689-695.
2. Nahla M H Elsaid, et al. “Phase based Motion Detection for Diffusion Magnetic Resonance Imaging.” ISMRM 2017, abstract no: 1288.
3. Pizarro, Ricardo A., et al. "Automated Quality Assessment of Structural Magnetic Resonance Brain Images Based on a Supervised Machine Learning Algorithm." Frontiers in neuroinformatics 10 (2016).
4. Christopher Kelly, et al. “Transfer learning and convolutional neural net fusion for motion artifact detection.” ISMRM 2017, abstract no: 3523.
5. Kaiming He et.al., “Deep Residual Learning for Image Recognition”, arXiv:1512.03385 [cs.CV].
Figures

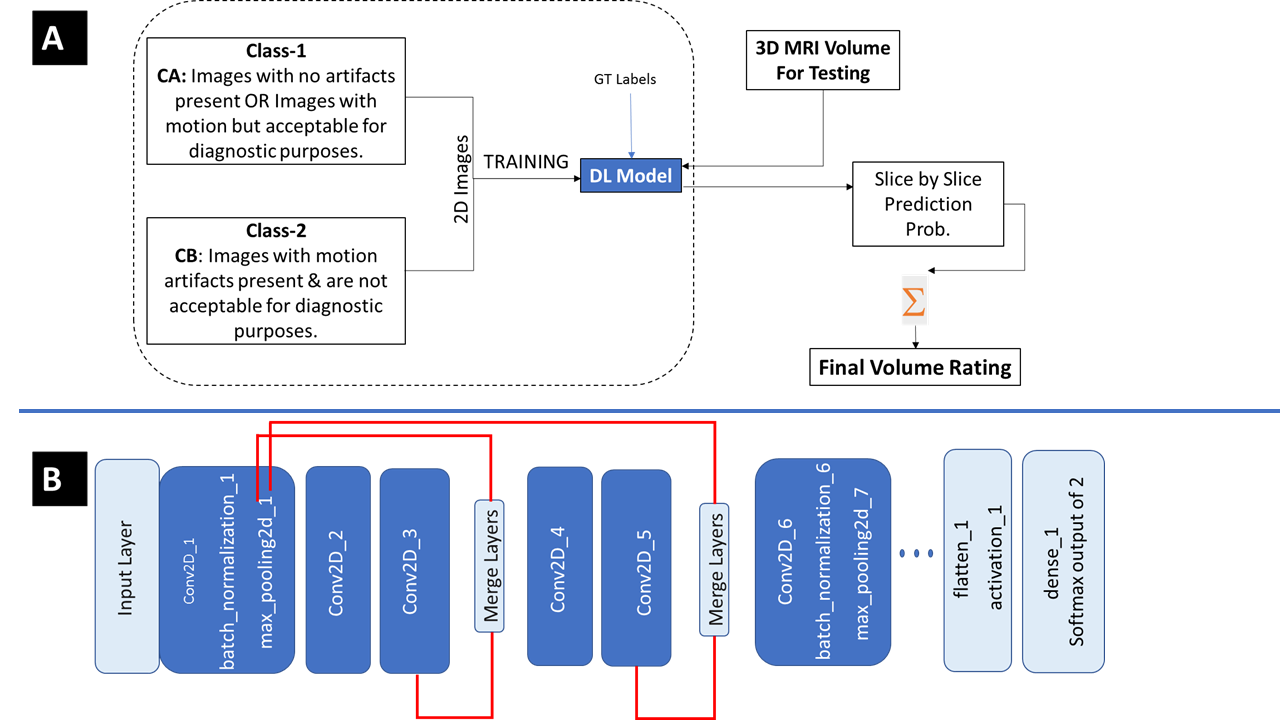
Figure 2: A. Experiment pipeline. The training is done by labelling 2D images to belong to two classes (CG,CB). In the testing phase, a 3D volume is the input. The model will give slice by slice probabilities for it being CG. Final volume rating is obtained by geometrically averaging the CG predictions from all the slices. B. CNN Architecture used in the experiment. The input to the DL model is a 2D image of size 128x128. It consists of eight convolutional layers, four “max pool” layers, “elu” activation and two merge layers between convolutional layers.
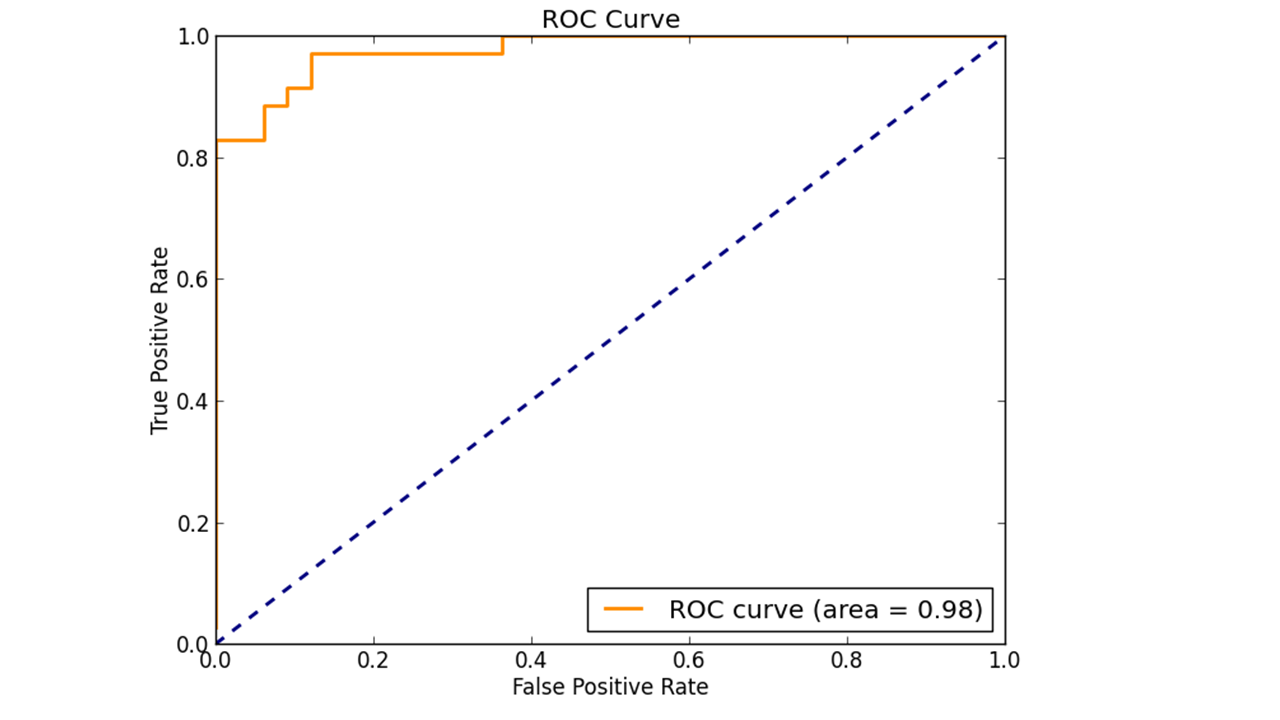
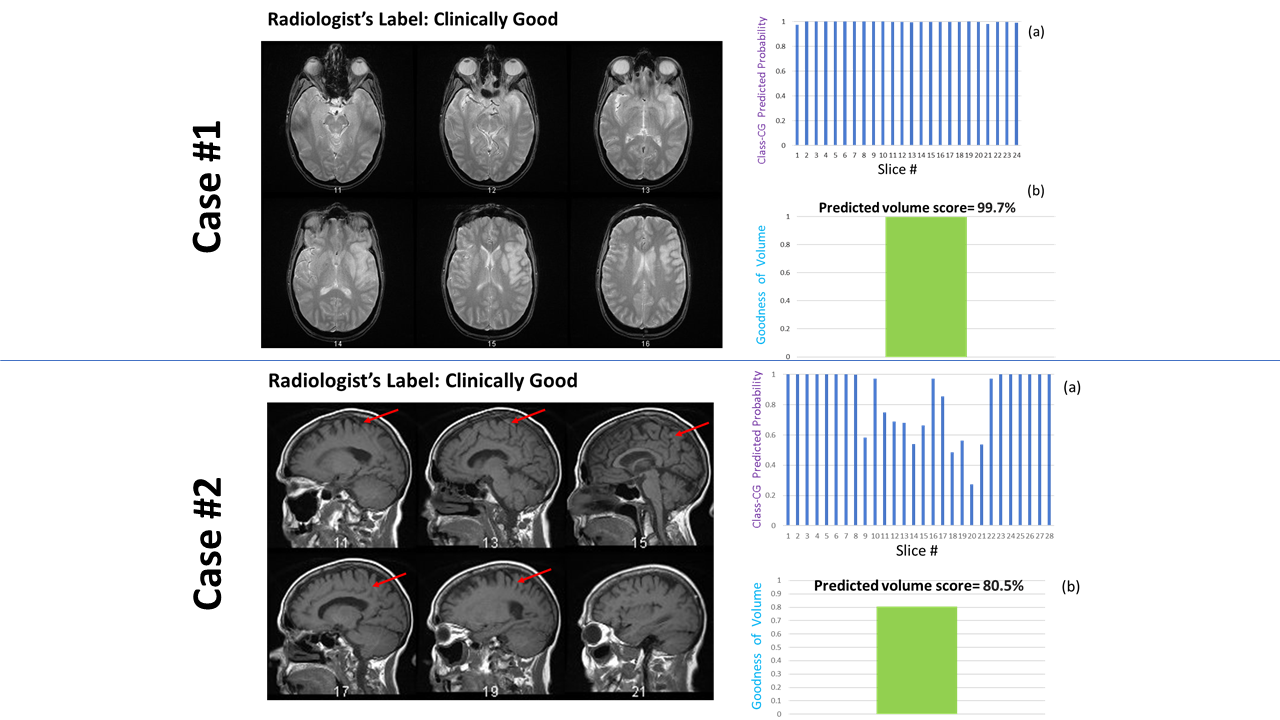
Figure 4: DL based prediction in clinically good cases.
Case#1: The tested volume is an axial GRE. There are no motion artifacts present in any of the 2D slices. The slice by slice Class-1 predicted probabilities have high probabilities as shown in graph (a). The goodness of the volume predicted for this is 99.7%, which matches the clinician’s rating.
Case#2: The tested volume is a Sagittal-T1. There is motion artifact present (arrows) in some of the 2D slices. But the volume is rated as diagnostically good (CG). The CG predicted probability for some of the slices are low (graph a). Overall, the goodness of the volume estimated for this is 80.5% , again matches with the clinician’s rating.
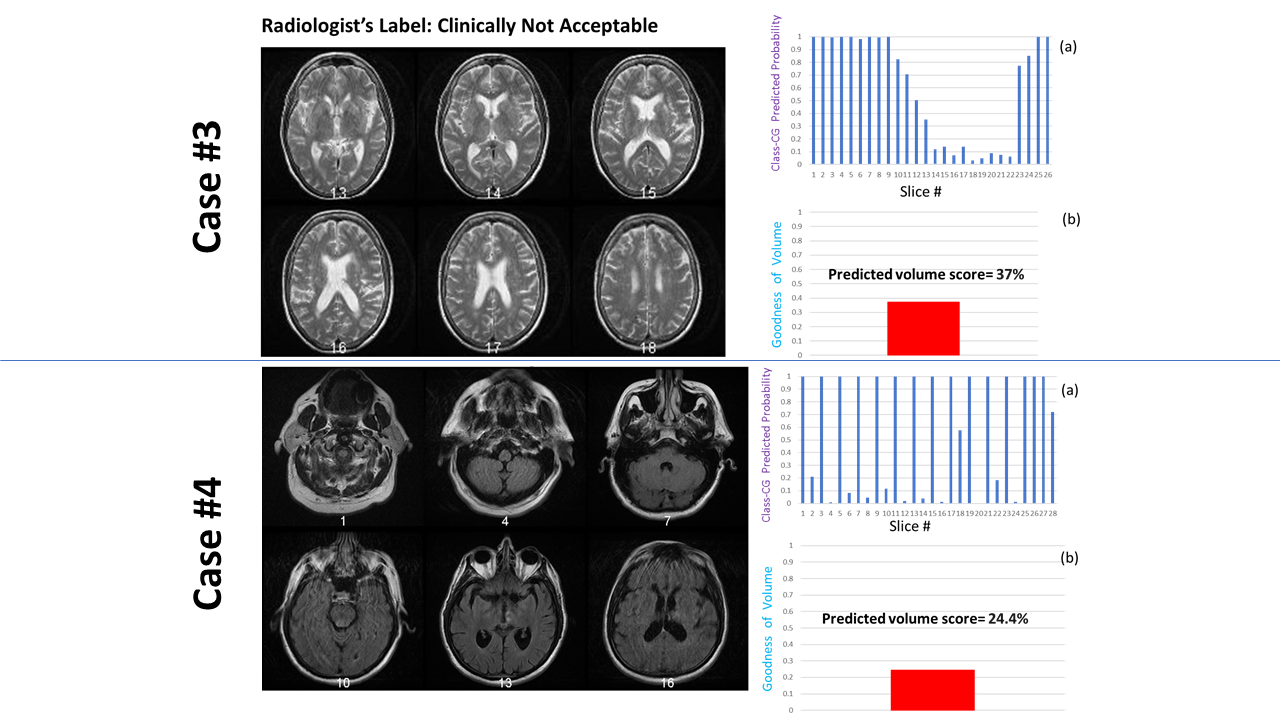
Figure 5: DL based prediction in clinically bad cases.
Case#1: The tested volume is an Axial-T2. There is motion artifact present in some of the 2D slices. The Class-1 predicted probability values for some of the slices are low (graph a). The goodness of the volume (or geometric mean) estimated for this is 37% , indicating a clinically bad volume prediction, which matches with clinician’s rating.
Case#2:The tested volume is Axial Flair. There is high motion artifact present in alternate slices. The Class-1 predicted probability values for alternate slices are low (graph a). The goodness of the volume (or geometric mean) estimated for this is 24% , which again matches the clinician's rating for this volume.