2746
Resting-state Brain Networks using Spectral Clustering Analysis1Computer Science, State University of New York at Binghamton, Vestal, NY, United States, 2Mathematical Sciences, State University of New York at Binghamton, Vestal, NY, United States, 3Department of Radiology, Beth Israel Deaconess Medical Center and Harvard Medical School, Boston, MA, United States
Synopsis
Seed-based correlation method and independent component analysis (ICA)-based method have been used to extract the resting-state brain networks from fMRI data. Both methods require either prior knowledge of brain anatomy or selection of unordered spatial sources. Here, we investigate a data-driven spectral clustering algorithm to study brain networks for resting-state arterial spin labeling (ASL) and blood-oxygen-level dependent (BOLD) fMRI data. The spectral clustering algorithm successfully separates the brain resting-state networks and rank the non-neural noises at last. It is of great benefit to use ASL to study brain resting-state networks because of the largely reduced non-neural noise sources.
Introduction
Functional magnetic resonance imaging (fMRI) has revealed the resting-state brain networks. Seed-based correlation analysis is the most frequently used approach for extracting the brain networks [1]. However, it requires prior knowledge of brain anatomy or task fMRI approach to detect the location for a reliable seed. Independent component analysis (ICA) is another alternative approach for functional connectivity analysis [2] but it is difficult to select the spatial sources for brain networks due to lack of prioritization for the spatial sources. Here, we explore the spectral clustering community detection algorithm for its capability in separating the resting-state brain networks. The spectral clustering algorithm is fully data driven without the need of any prior information about brain anatomy. The spectral clustering algorithm has been investigated for both arterial spin labeling (ASL) and blood-oxygen-level dependent (BOLD) fMRI.Theory
The spectral clustering algorithm is based on spectral graph theory [3]. The spectral clustering algorithm uses the eigenvalue decomposition of similarity graph, which can be constructed as the pairwise correlation matrix from all brain voxels. The eigenvectors of this correlation matrix represents a low-dimensional representation for the correlation of brain voxels. Standard k-mean algorithms can then be used for clustering.
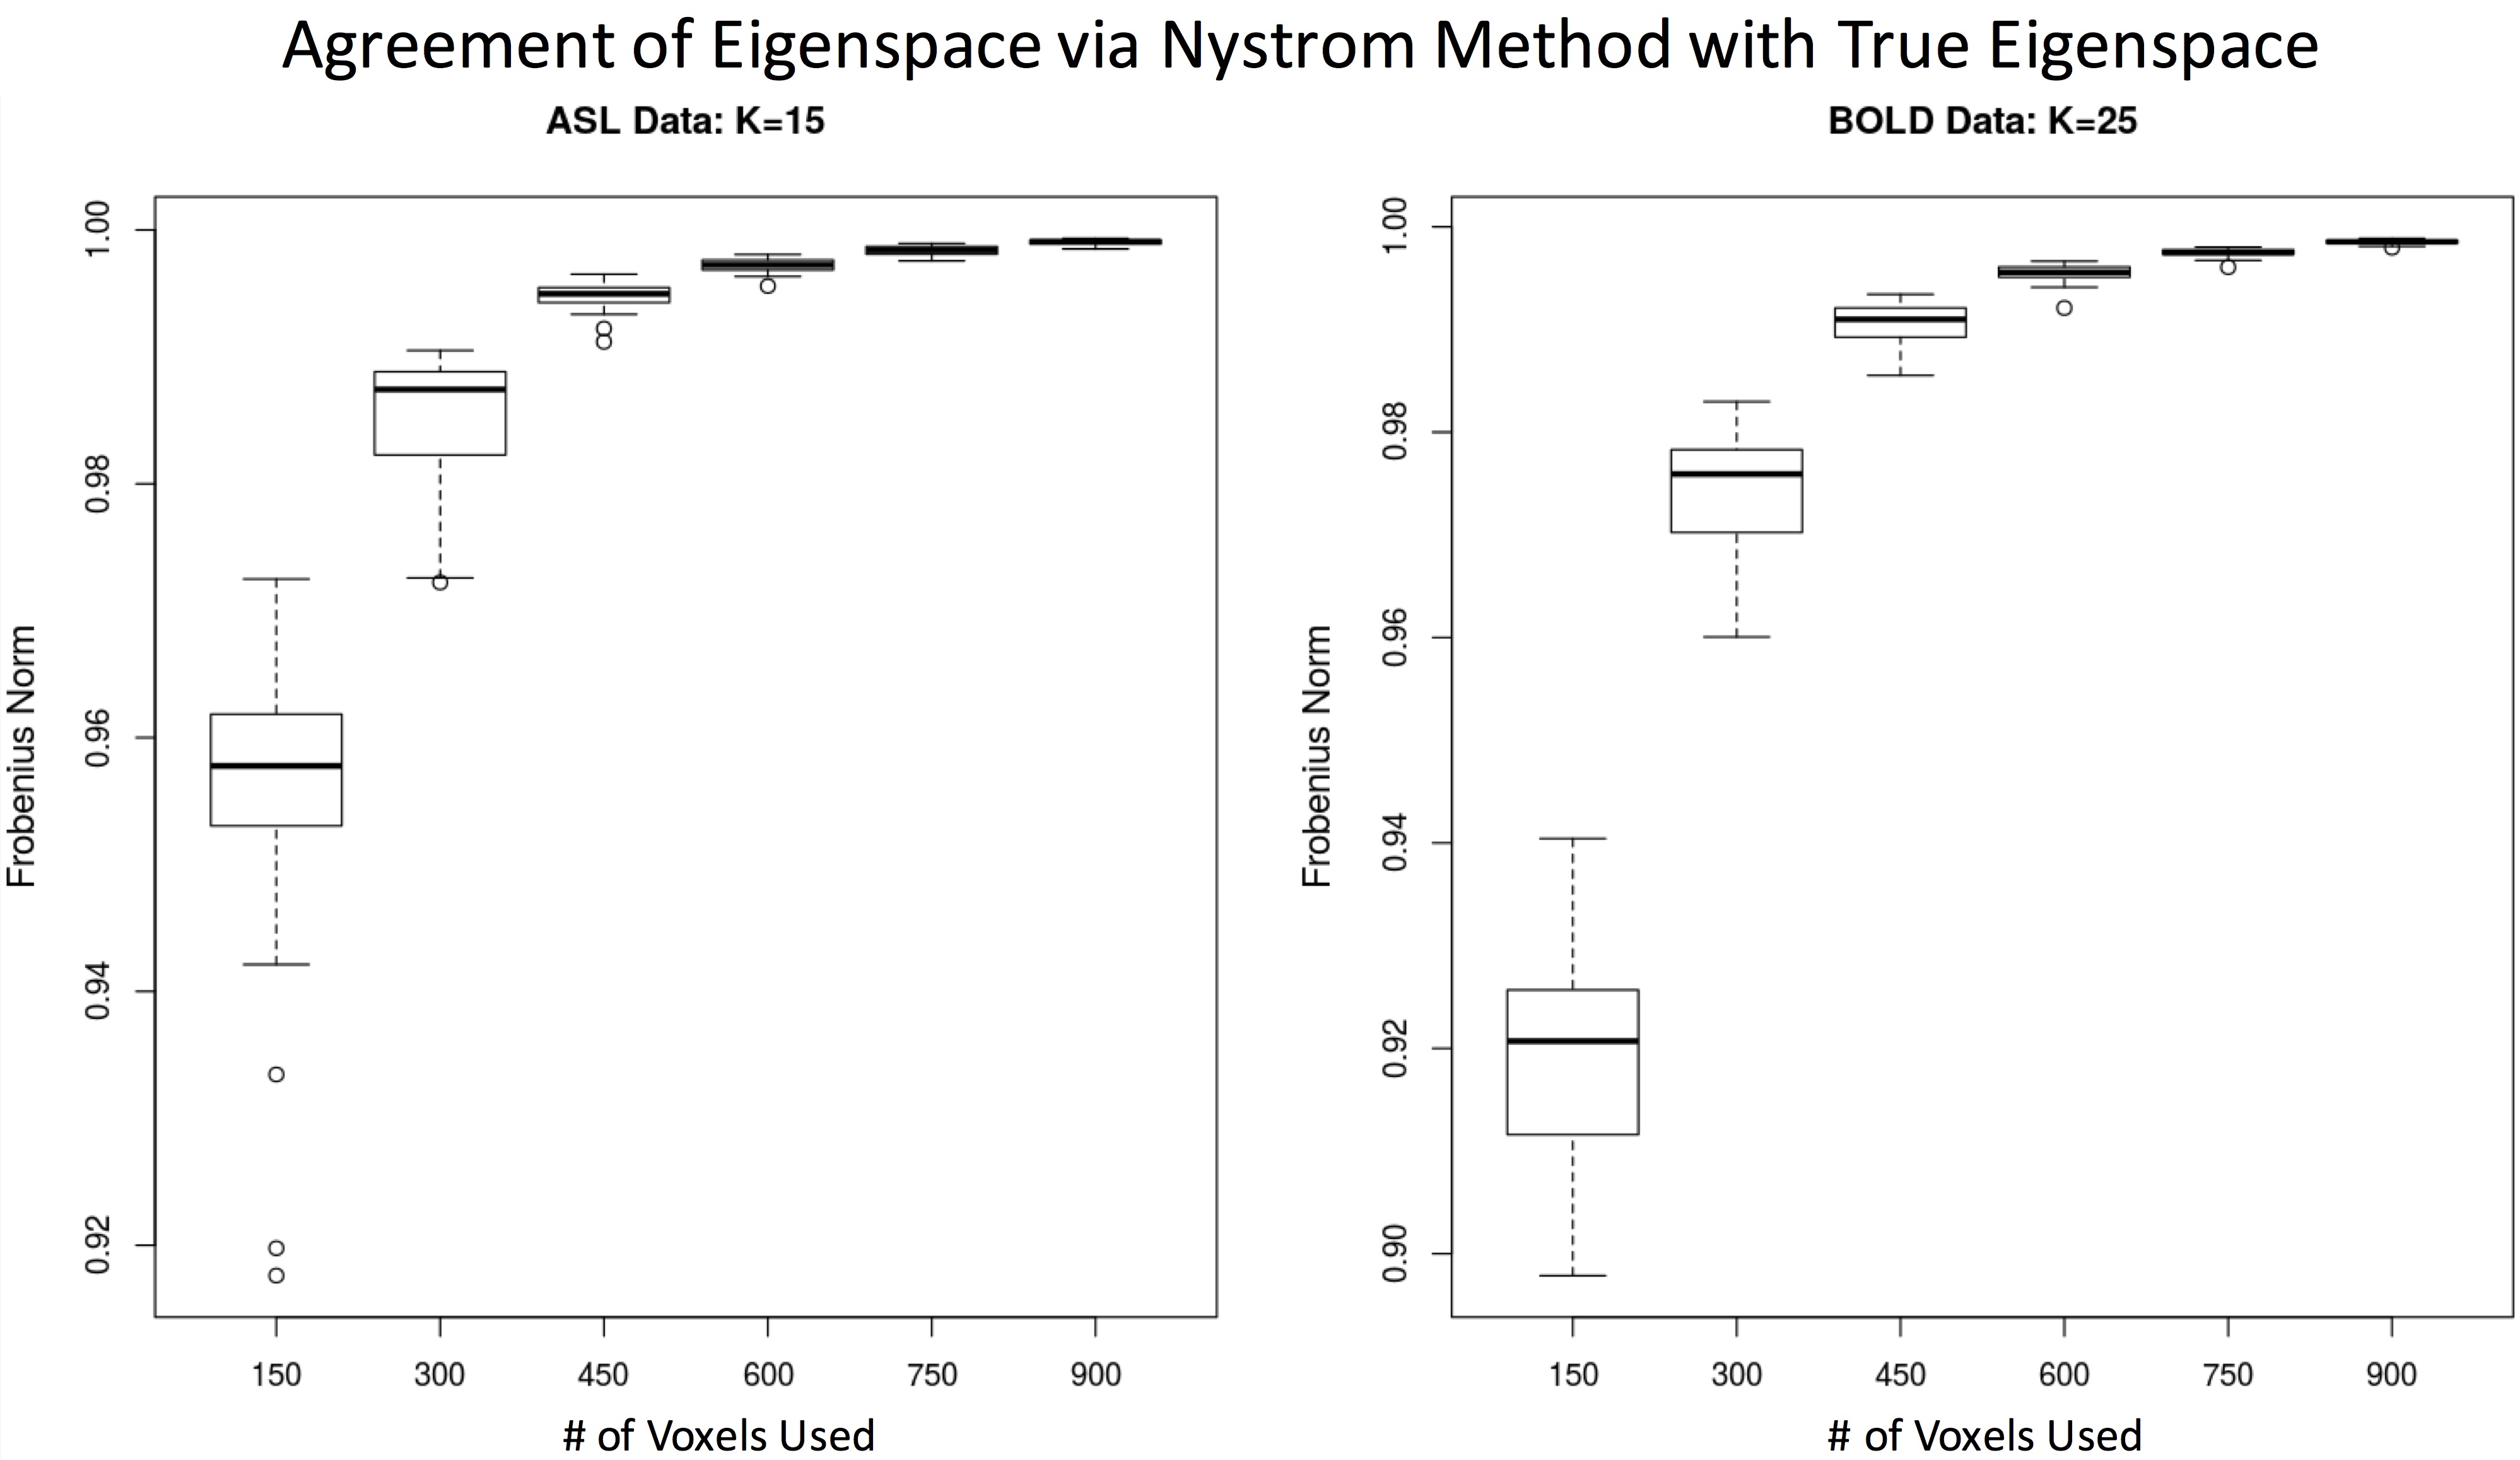
An issue with the spectral clustering is that it requires the eigenvalue decomposition of a large matrix. The number of brain voxels in the entire brain is about 32,000 voxels for ASL and BOLD data with 4-mm resolution. It is not realistic to calculate the eigenvalue decomposition for a 32,000 × 32,000 matrix. The Lanczos method [4] and Nystrom method [5] are two methods for approximating the eigenvalue decomposition for a large matrix. The Lanczos method uses the tridiagonal approximation of the matrix and then calculates the eigenvalues, while the Nystrom method samples a random portion of the data to approximate the eigenvalues of the matrix. Their performance was compared using both ASL and BOLD data.
Methods
We studied the performance of the spectral clustering algorithm on both resting-state ASL [6] (40 image time series) and BOLD (300 image time series), acquired from 20 healthy subjects (8 females/12 males, 22–38 years old 30.3 ±4.6) [7]. Axial T1-weighted magnetizationprepared rapid gradient echo (MPRAGE) images were collected using GE 3T scanner.
Both ASL and BOLD images were motion corrected and registered to the standard MNI space using SPM8. We scaled each subject’s image time series by the same factor so that the global mean from each subject is the same. All subjects’ data were temporally concatenated to form a 2D matrix (temporal dimension × spatial dimension). Each voxel was normalized with mean of 0 and variance of 1. The correlated matrix was then reconstructed using pair-wise correlation of all brain voxels. A normalized Laplacian matrix was formed from the correlation matrix, and then singular-value decomposition was performed on the adjacency matrix using the Nystrom method and Lanczos methods. The M largest eigenvalues were selected and the space corresponding to the largest eigenvectors were selected. The K-means algorithm, using Pearson correlation as the distance metric, was finally applied to the eigenvector space to produce K clusters. Each cluster represents a group of voxels that are highly correlated. The clusters were ranked based on the mean correlation over all the voxels within each cluster.
Results & Discussion
The Lanczos method can produce the eigenspace that is very close to the true eigenspace. However, the performance of Nystrom method depends on the number of random samples used for the ASL and BOLD data. The more random samples, the more accurately the Nystrom method approximates the space spanned by eigenvectors (Fig. 1). But the Lanczos method is about 50 times slower than the Nystrom method using 3% of the total voxels. The spectral clustering results using the Lanczos approximation method are shown in Fig. 2 for the ASL and BOLD data. Using the spectral clustering algorithm, we can readily identify several resting-state brain networks: default mode, sensory-motor, left lateral, right lateral, lateral visual, and medial visual networks, using M = K = 15 for ASL data and M = K = 25 for BOLD data. One out of 15 clusters and 10 out of 25 clusters are noise clusters for ASL and BOLD separately, and the noise clusters are ranked as the last clusters, as indicated by the smaller correlation. For BOLD data, we noticed some isolated voxels and mixed-in brain edge voxels for some clusters. These results further emphasize the benefit of ASL for studying resting-state networks with reduction of non-neural noise sources.Acknowledgements
No acknowledgement found.References
1. Biswal B, Yetkin FZ, Haughton VM, and Hyde JS, Functional connectivity in the motor cortex of resting human brain using echo-planar MRI. Magn Reson Med, 1995;34(4):537-41.
2. Beckmann CF and Smith SM, Probabilistic independent component analysis for functional magnetic resonance imaging. IEEE Trans Med Imaging, 2004;23(2):137-52.
3. Chung F, Spectral Graph Theory. CBMS Conference Board of the Mathematical Sciences, 1997;92.
4. Lanczos C, An iteration method for the solution of the eigenvalue problem of linear differential and integral operators. Journal of Research of the National Bureau of Standards, 1950;45(4):255-282.
5. Baker CTH, The numerical Treatment of Integral Equations. 1977: Oxford: Clarendon Press.
6. Dai W, Garcia D, de Bazelaire C, and Alsop DC, Continuous flow-driven inversion for arterial spin labeling using pulsed radio frequency and gradient fields. Magn Reson Med, 2008;60(6):1488-97.
7. Dai W, Varma G, Scheidegger R, and Alsop DC, Quantifying fluctuations of resting state networks using arterial spin labeling perfusion MRI. J Cereb Blood Flow Metab, 2016;36(3):463-73.
Figures