2739
Application of machine learning for MRI case studies1University of Wisconsin Madison, Madison, WI, United States
Synopsis
Machine learning can be used to train a model that maps MRI features to clinical phenotype covariates. We present the application of such a framework in the context of MRI case studies. While the presented framework is general in its applicability for individual level analysis, it has particular appeal in the context of case studies where the data can be extraordinarily rare or precious. Specifically, the framework was applied to study the case of an extraordinary long term meditator whose MRI data was acquired over four different time points over a period of fifteen years. Thanks to standardization of image processing and sparsity enhancing regularization methods in machine learning, the case study was performed by including the existing prior data in training the model.
Introduction
There are several analysis methods emerging in the field of MRI that focus on "subject-level" analysis1,2. These methods could enable clinicians to make meaningful inferences from the high-dimensional imaging data similar to what they are used to with univariate clinical measures. Statistical techniques in this area typically focus on the derived measures just from the imaging data and also at the individual voxel level. For example, the "$$$z$$$-score" family of methods derive a $$$z$$$-statistic based on distributions of imaging measurements from prior data or control groups. The newer machine learning techniques with enhanced regularization and estimators can allow us to focus on the relationships between imaging measures and clinically relevant/familiar covariates. Typical applications of machine learning so far focused on developing diagnosis classifiers, and search light family of methods but few have been applied for case studies. Note that case studies are not quite the same as single-subject analysis because typically even when the machine learning models are able to give predictions at individual level it learns the model from independent and identically distributed (i.i.d.) samples drawn from the distribution the individual belongs to. Case studies on the other hand include data that are much rarer and hence precious. There is a dedicated journal Neurocase3 that publishes case studies but very few of the published articles use machine learning. This abstract presents a framework building on the applications of relevance vector machines for $$$T_1$$$-weighted MRI case studies.Methods
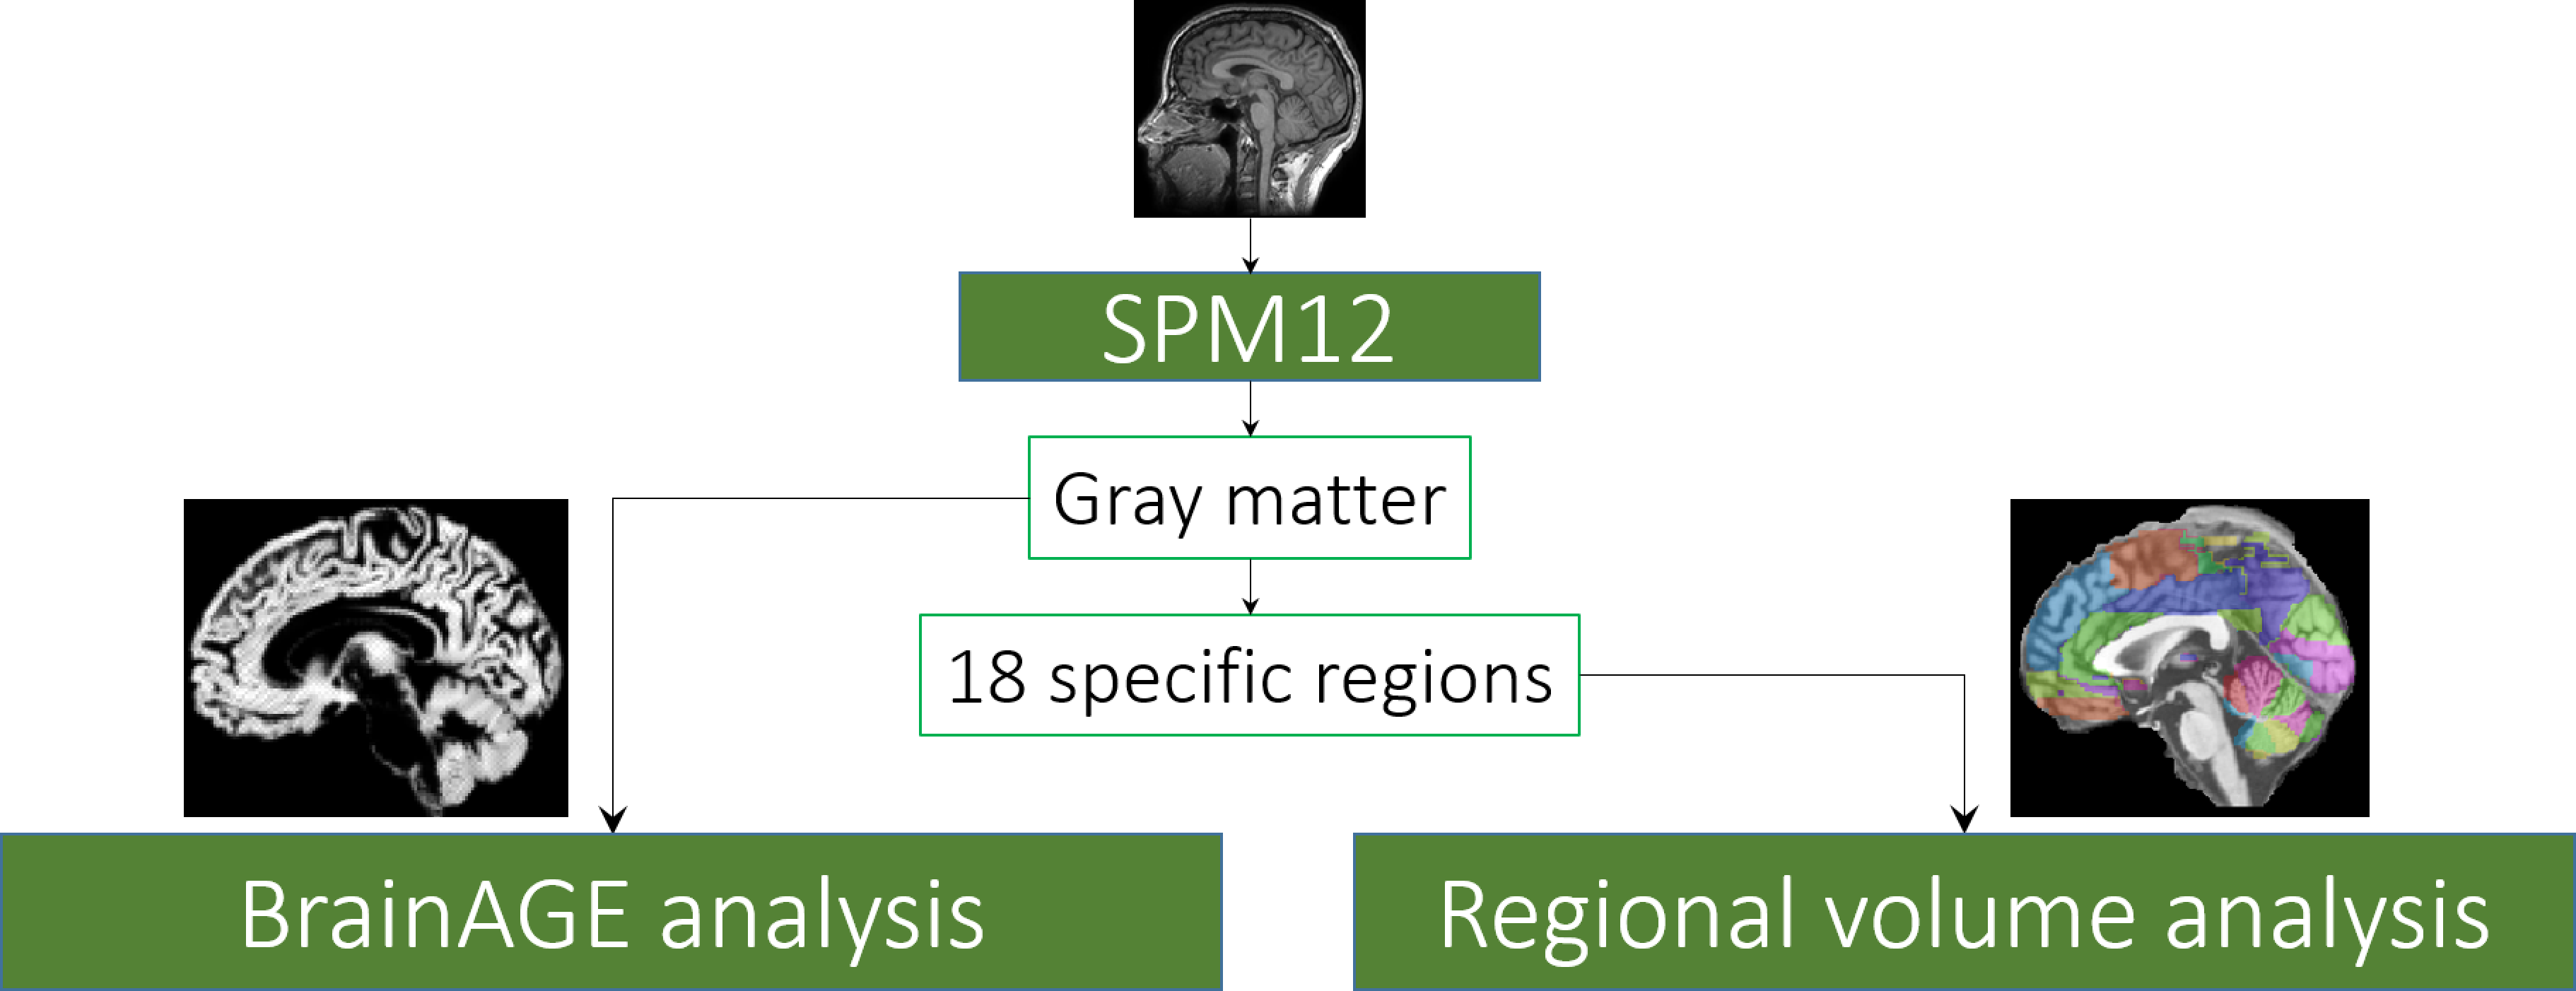
The $$$T_1$$$-weighted MRI data were processed using the most recent, version 12, of the Statistical Parametric Mapping software (SPM12)4. The images were first manually realigned so that the anterior commissure (AC) and posterior commissure (PC) are in the same axial plane. Then the images were segmented into three major tissue types namely gray matter (GM), white matter (WM), and the cerebrospinal fluid (CSF). Each voxel is given a value between 0 and 1 indicating the likelihood (proportion) of the voxel belonging to the particular tissue type. All the images were then spatially normalized to Montreal Neurological Institute (MNI)-152 template space. The spatial transformations were modulated to preserve volume after the normalization. The gray matter maps were smoothed with an 8 mm full-width at half-maximum (FWHM) Gaussian kernel. The overall image processing steps are shown in Fig.1.
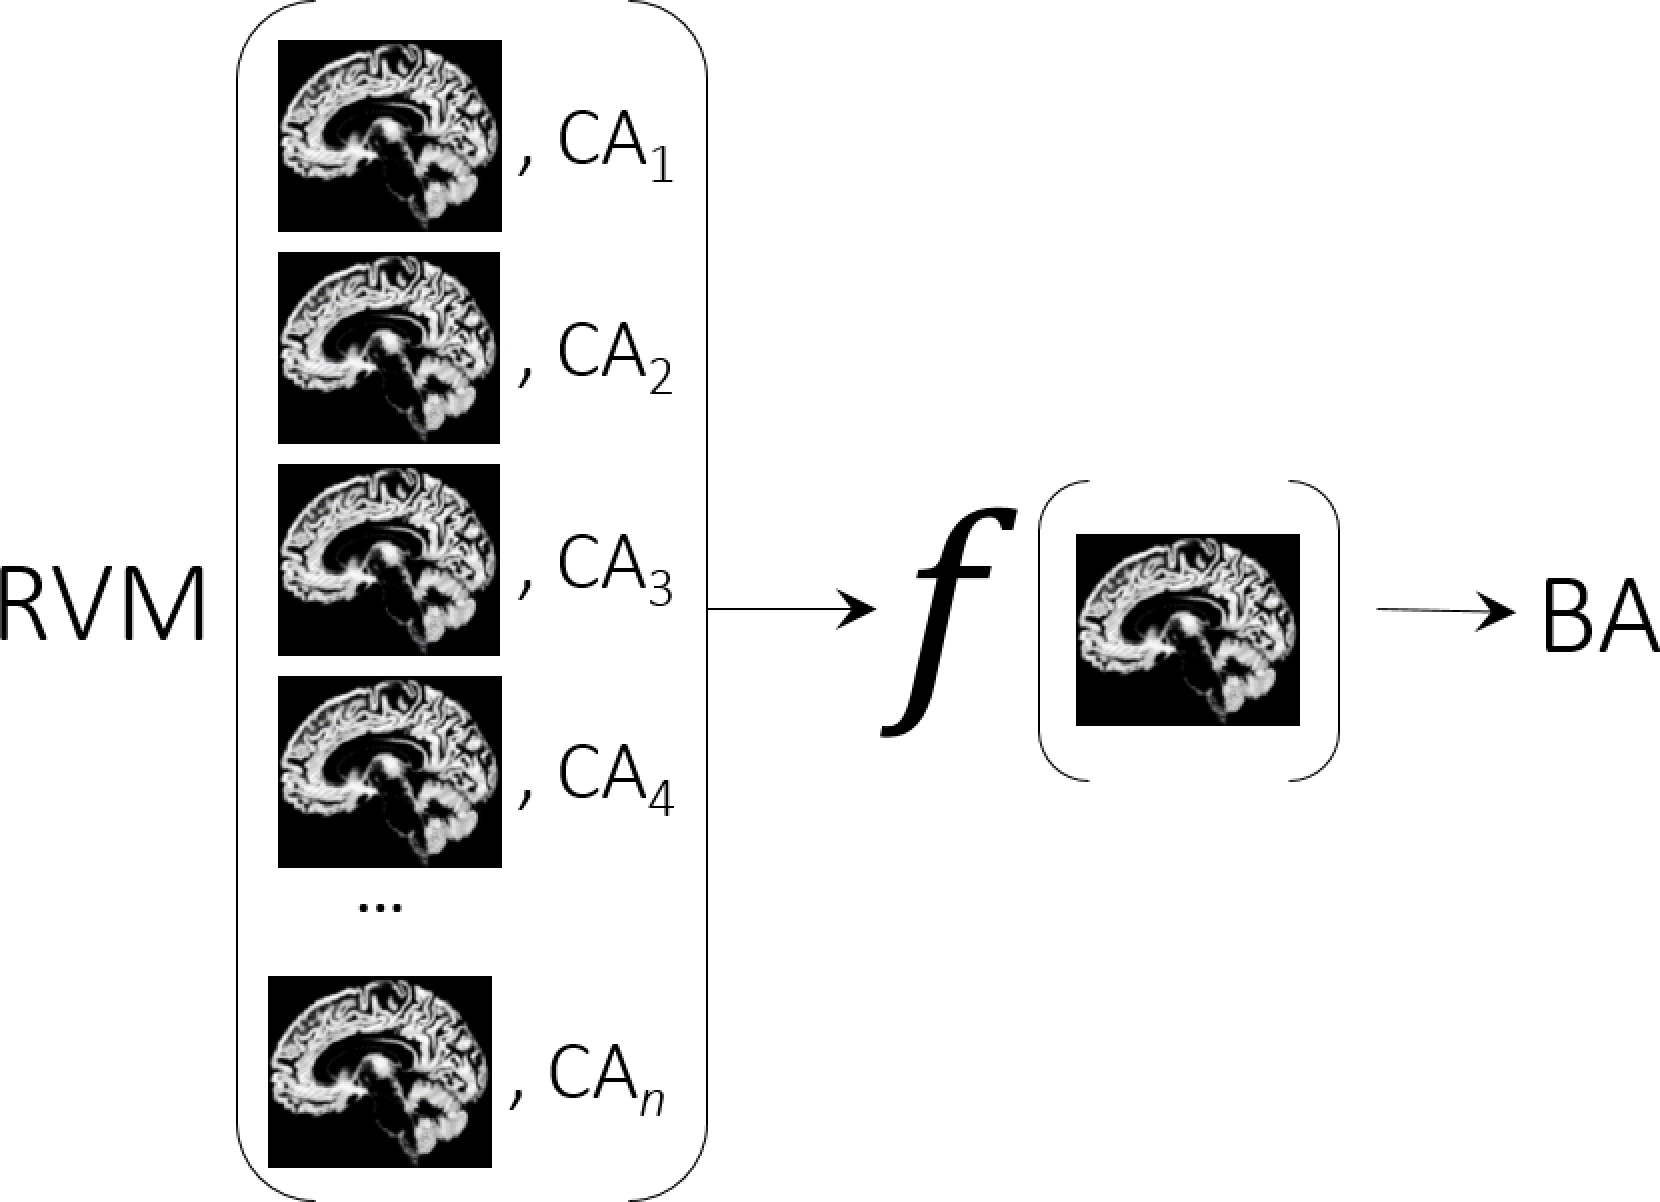
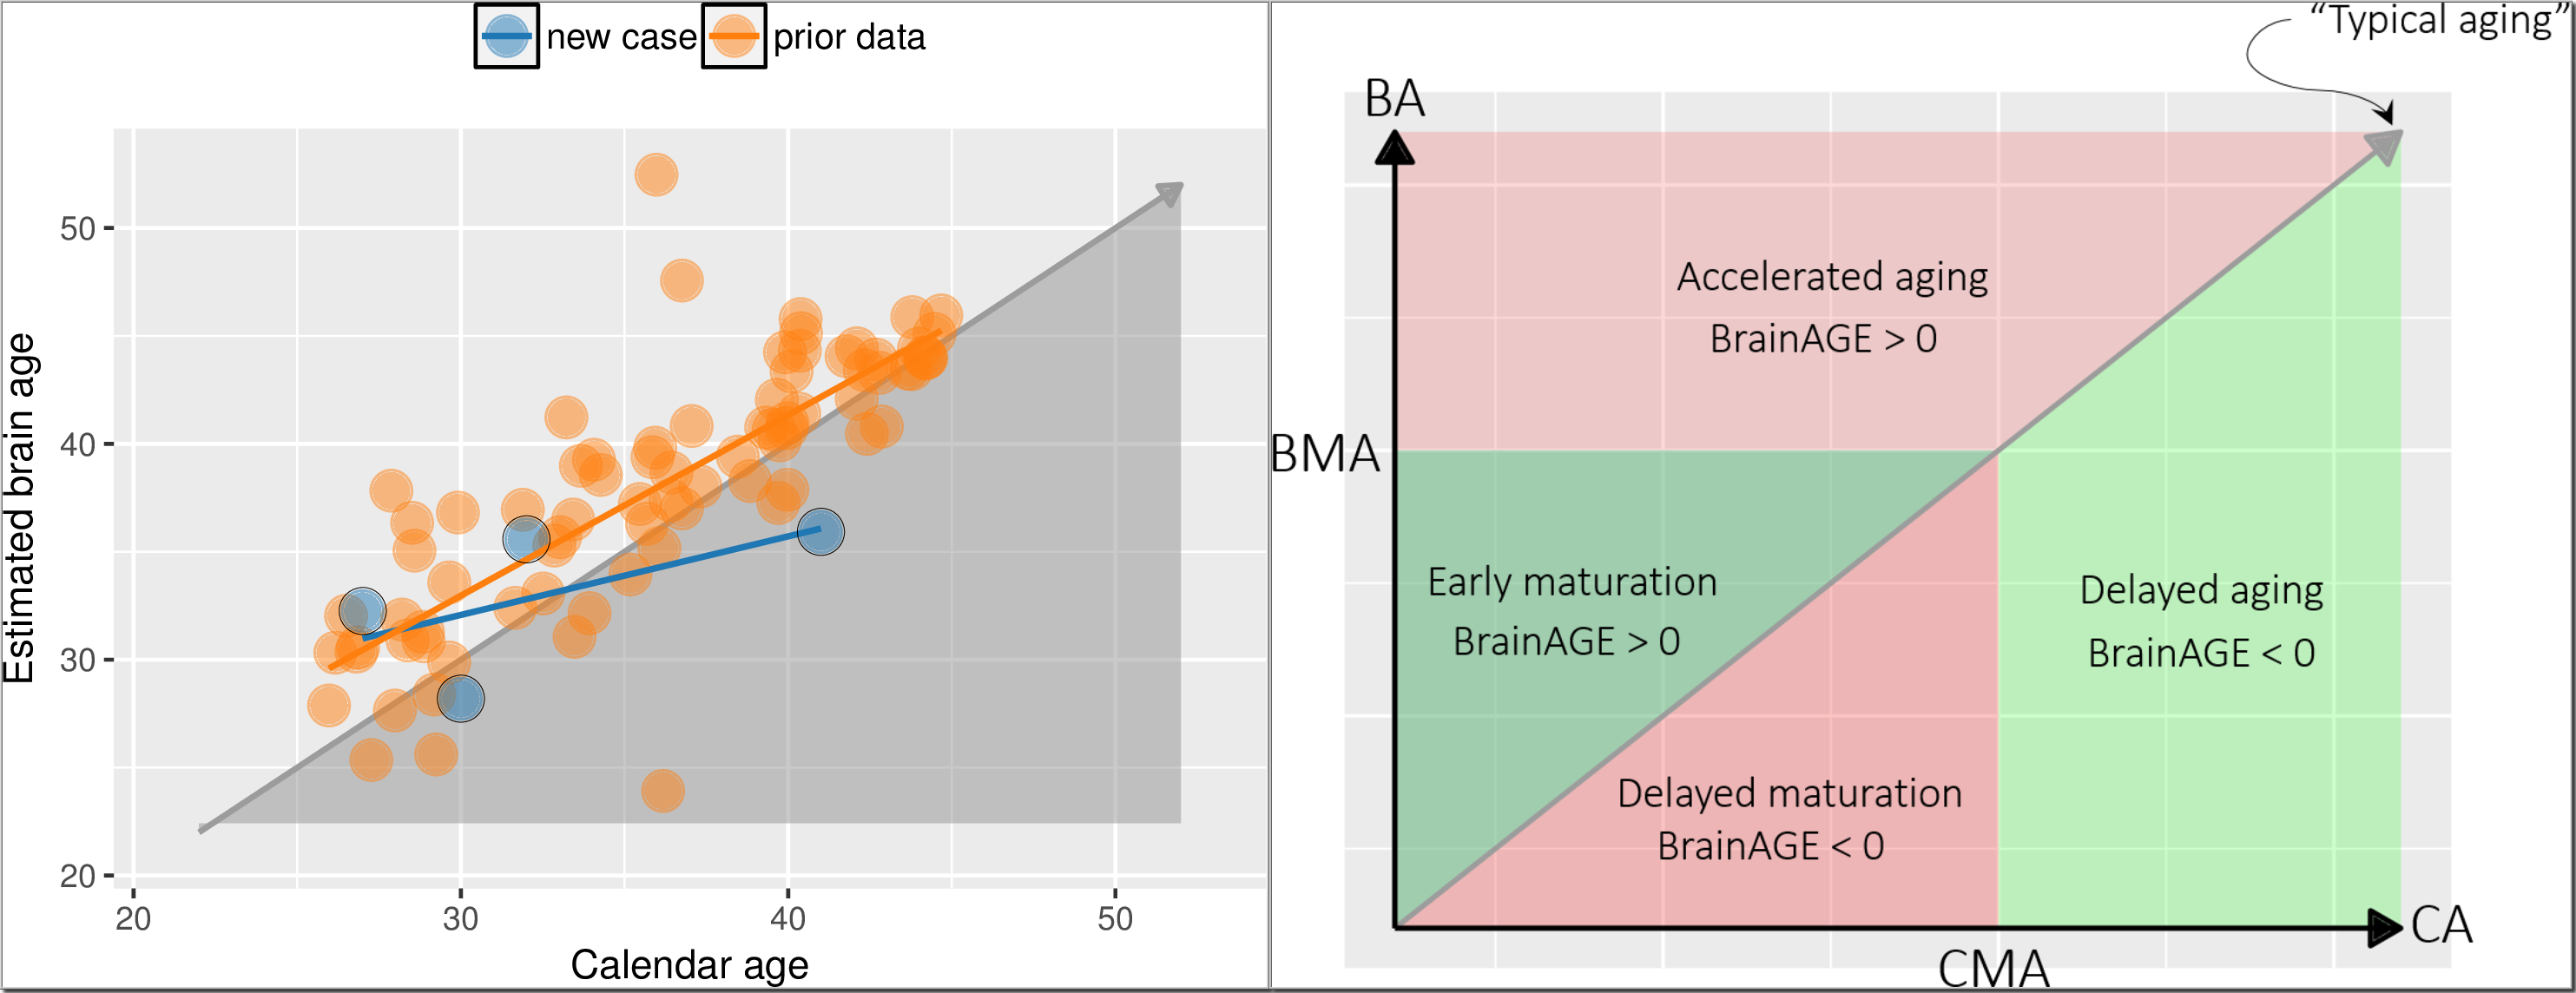
Recently a machine learning based analysis introduced the so called $$$\mathtt{BrainAGE}$$$ variable5. This variable is the gap between what the machine thinks the age of the brain is and what the calendar tell us. In fact $$$\mathtt{BrainAGE}$$$ stands for Brain Age Gap Estimation. The basic idea of the framework is shown in Fig.2. The relevance vector machine (RVM) learns a function $$$f$$$ that can predict the age of an input brain image. It learns by finding the best empirical model relating the brain images and the calendar ages from the input training data. $$$\mathtt{BrainAGE}$$$ for a particular test subject is then simply the difference between the estimated brain age (BA) and the calendar age (CA) i.e. BA - CA. This framework has been studied extensively and has been empirically shown to be robust to scanner parameters6. The $$$\mathtt{BrainAGE}$$$ variable can be used to classify the space of the estimated brain age and the calendar age as shown in Fig.3. Let us say there is a typical calendar maturation age (CMA) and biological brain maturation age (BMA). If $$$\mathtt{BrainAGE} > 0$$$, before the maturation age then it indicates early maturation of the brain for that individual. If $$$\mathtt{BrainAGE} < 0$$$ it could be construed as delayed maturation of the brain. On the contrary, post maturation age if the $$$\mathtt{BrainAGE} < 0$$$, it could be considered that the brain is relatively younger (or delayed aging of the brain) and if it is greater than 0 then there could be accelerated aging which could indicate accelerated brain atrophy. On a technical level the RVMs are estimated using sparse Bayesian learning extension of the popular support vector machines (SVMs). The sparse version of the SVMs are named relevance vector machines (RVMs)7 since the prior imposed is motivated from the work on automatic relevance determination.
Results
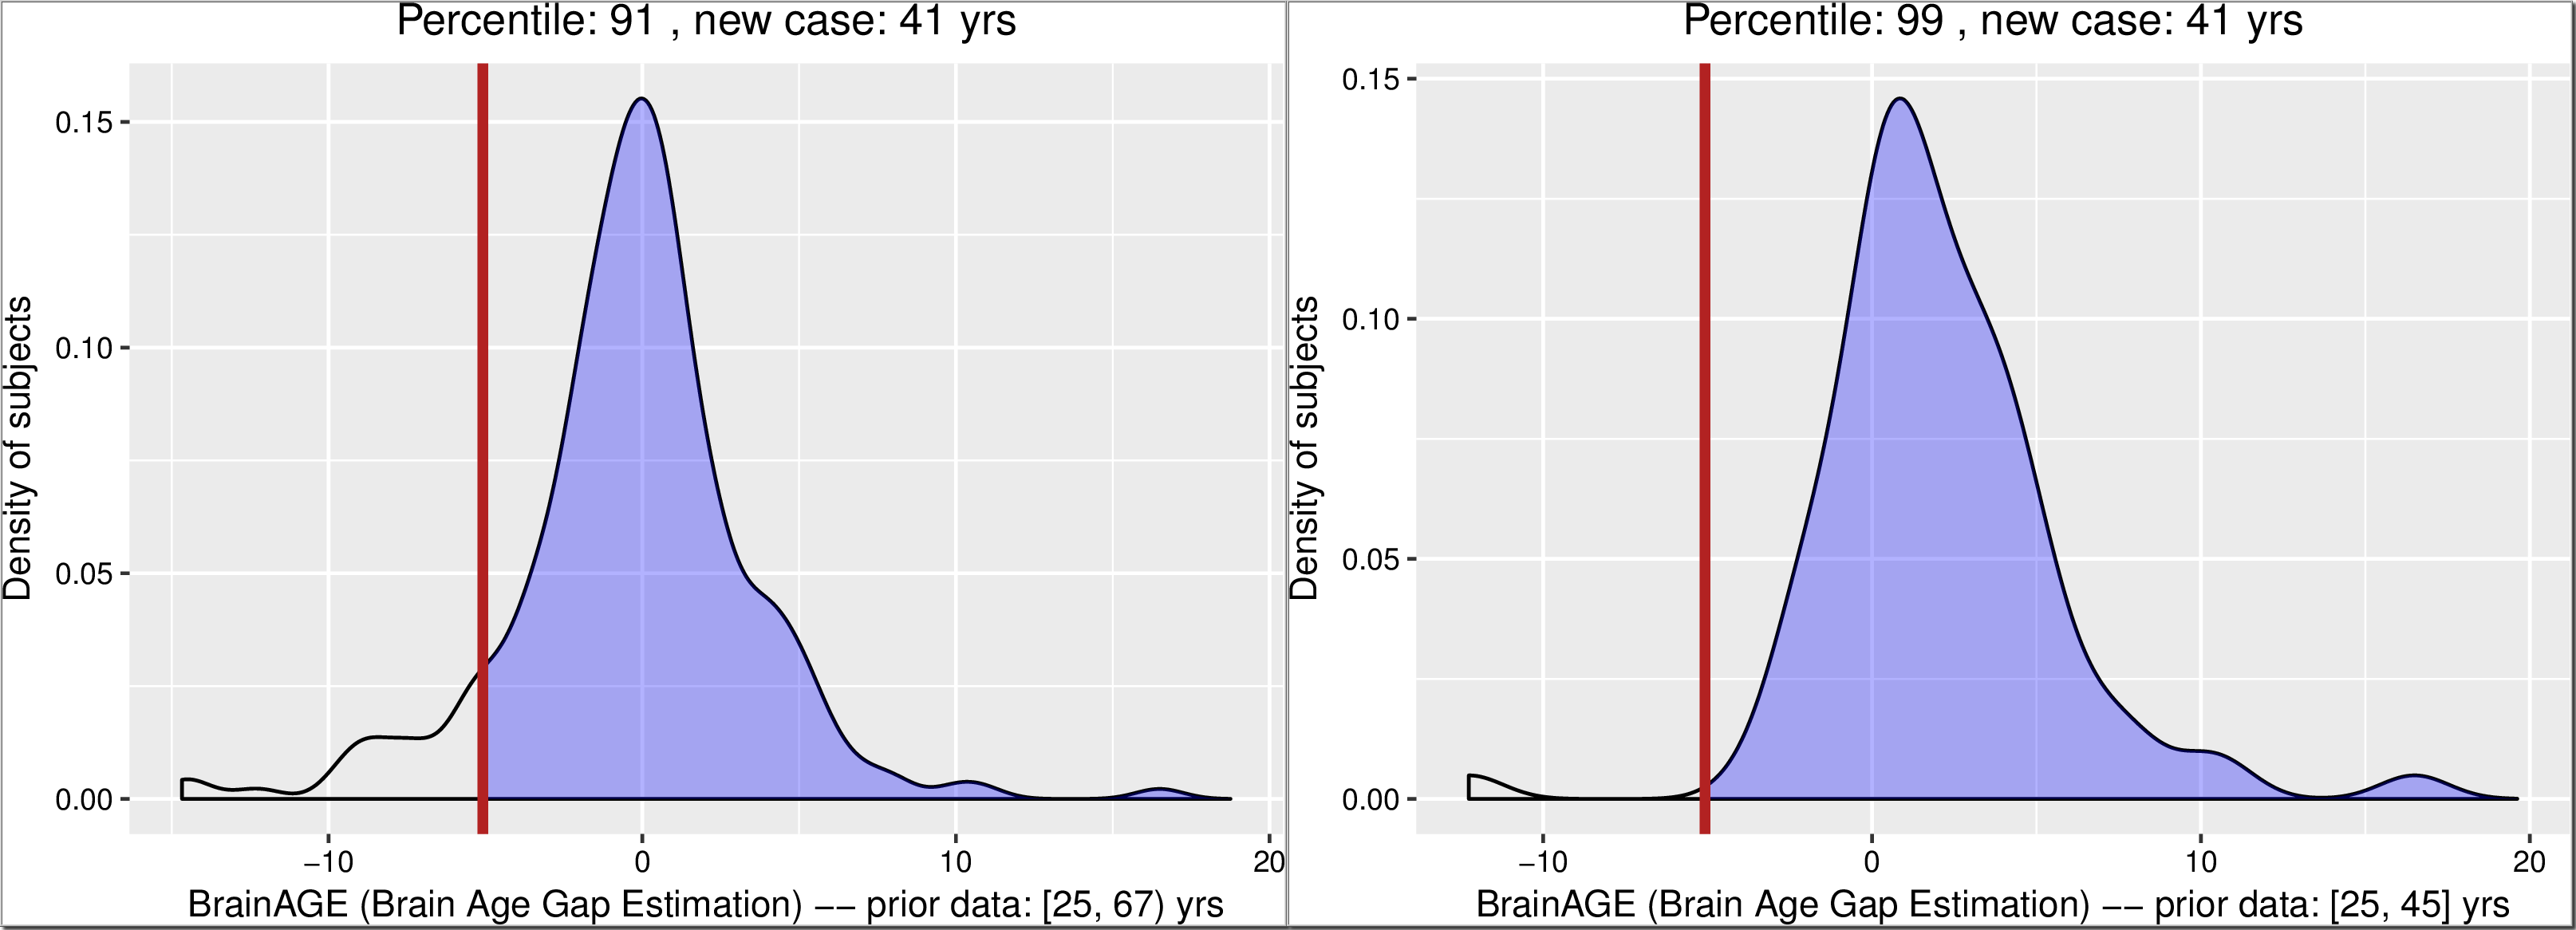
The results from $$$\mathtt{BrainAGE}$$$ analysis as well as regional volumetric changes8 are presented in Figs. 3,4,5. Please see the captions for more details.
Discussion and conclusion
We presented a novel use of a machine learning approach for performing MRI case studies. One could also perform a $$$k$$$-nearest classification procedure using BA by finding the $$$k$$$ closest individuals from the prior database on BA dimension and averaging their other relevant characteristics including the calendar age for example.Acknowledgements
NIH grants U54-HD090256 and P01-AT004952, several team members and the long-term meditator are gratefully acknowledged.References
1. Koay C, Yeh P, Ollinger J, et al. Tract Orientation and Angular Dispersion Deviation Indicator (TOADDI): A framework for single-subject analysis in diffusion tensor imaging. NeuroImage 2016;126:151-63.
2. Maudsley A, Govind V, Levin B, et al. Distributions of Magnetic Resonance Diffusion and Spectroscopy Measures with Traumatic Brain Injury. J Neurotrauma. 2015; 32(14):1056–1063.
3. Neurocase. The neural basis of cognition. http://www.tandfonline.com/toc/nncs20/current
4. http://www.fil.ion.ucl. ac.uk/spm
5. Luders, E, Cherbuin, N, Gaser, C. Estimating brain age using high-resolution pattern recognition: Younger brains in long-term meditation practitioners. NeuroImage. 2016;134:508-513.
6. Franke, K, Ziegler, G, et al. Estimating the age of healthy subjects from T1-weighted MRI scans using kernel methods: Exploring the influence of various parameters. NeuroImage. 2010;3:883-892.
7. Tipping, M. Sparse Bayesian learning and the relevance vector machine. Journal of Machine Learning Research. 2001;1:211-244
8. Fox, K, Nijeboer, S, et al. Is meditation associated with altered brain structure? A systematic review and meta-analysis of morphometric neuroimaging in meditation practitioners. Neuroscience and Biobehavioral Reviews. 2014;43:48-73
Figures
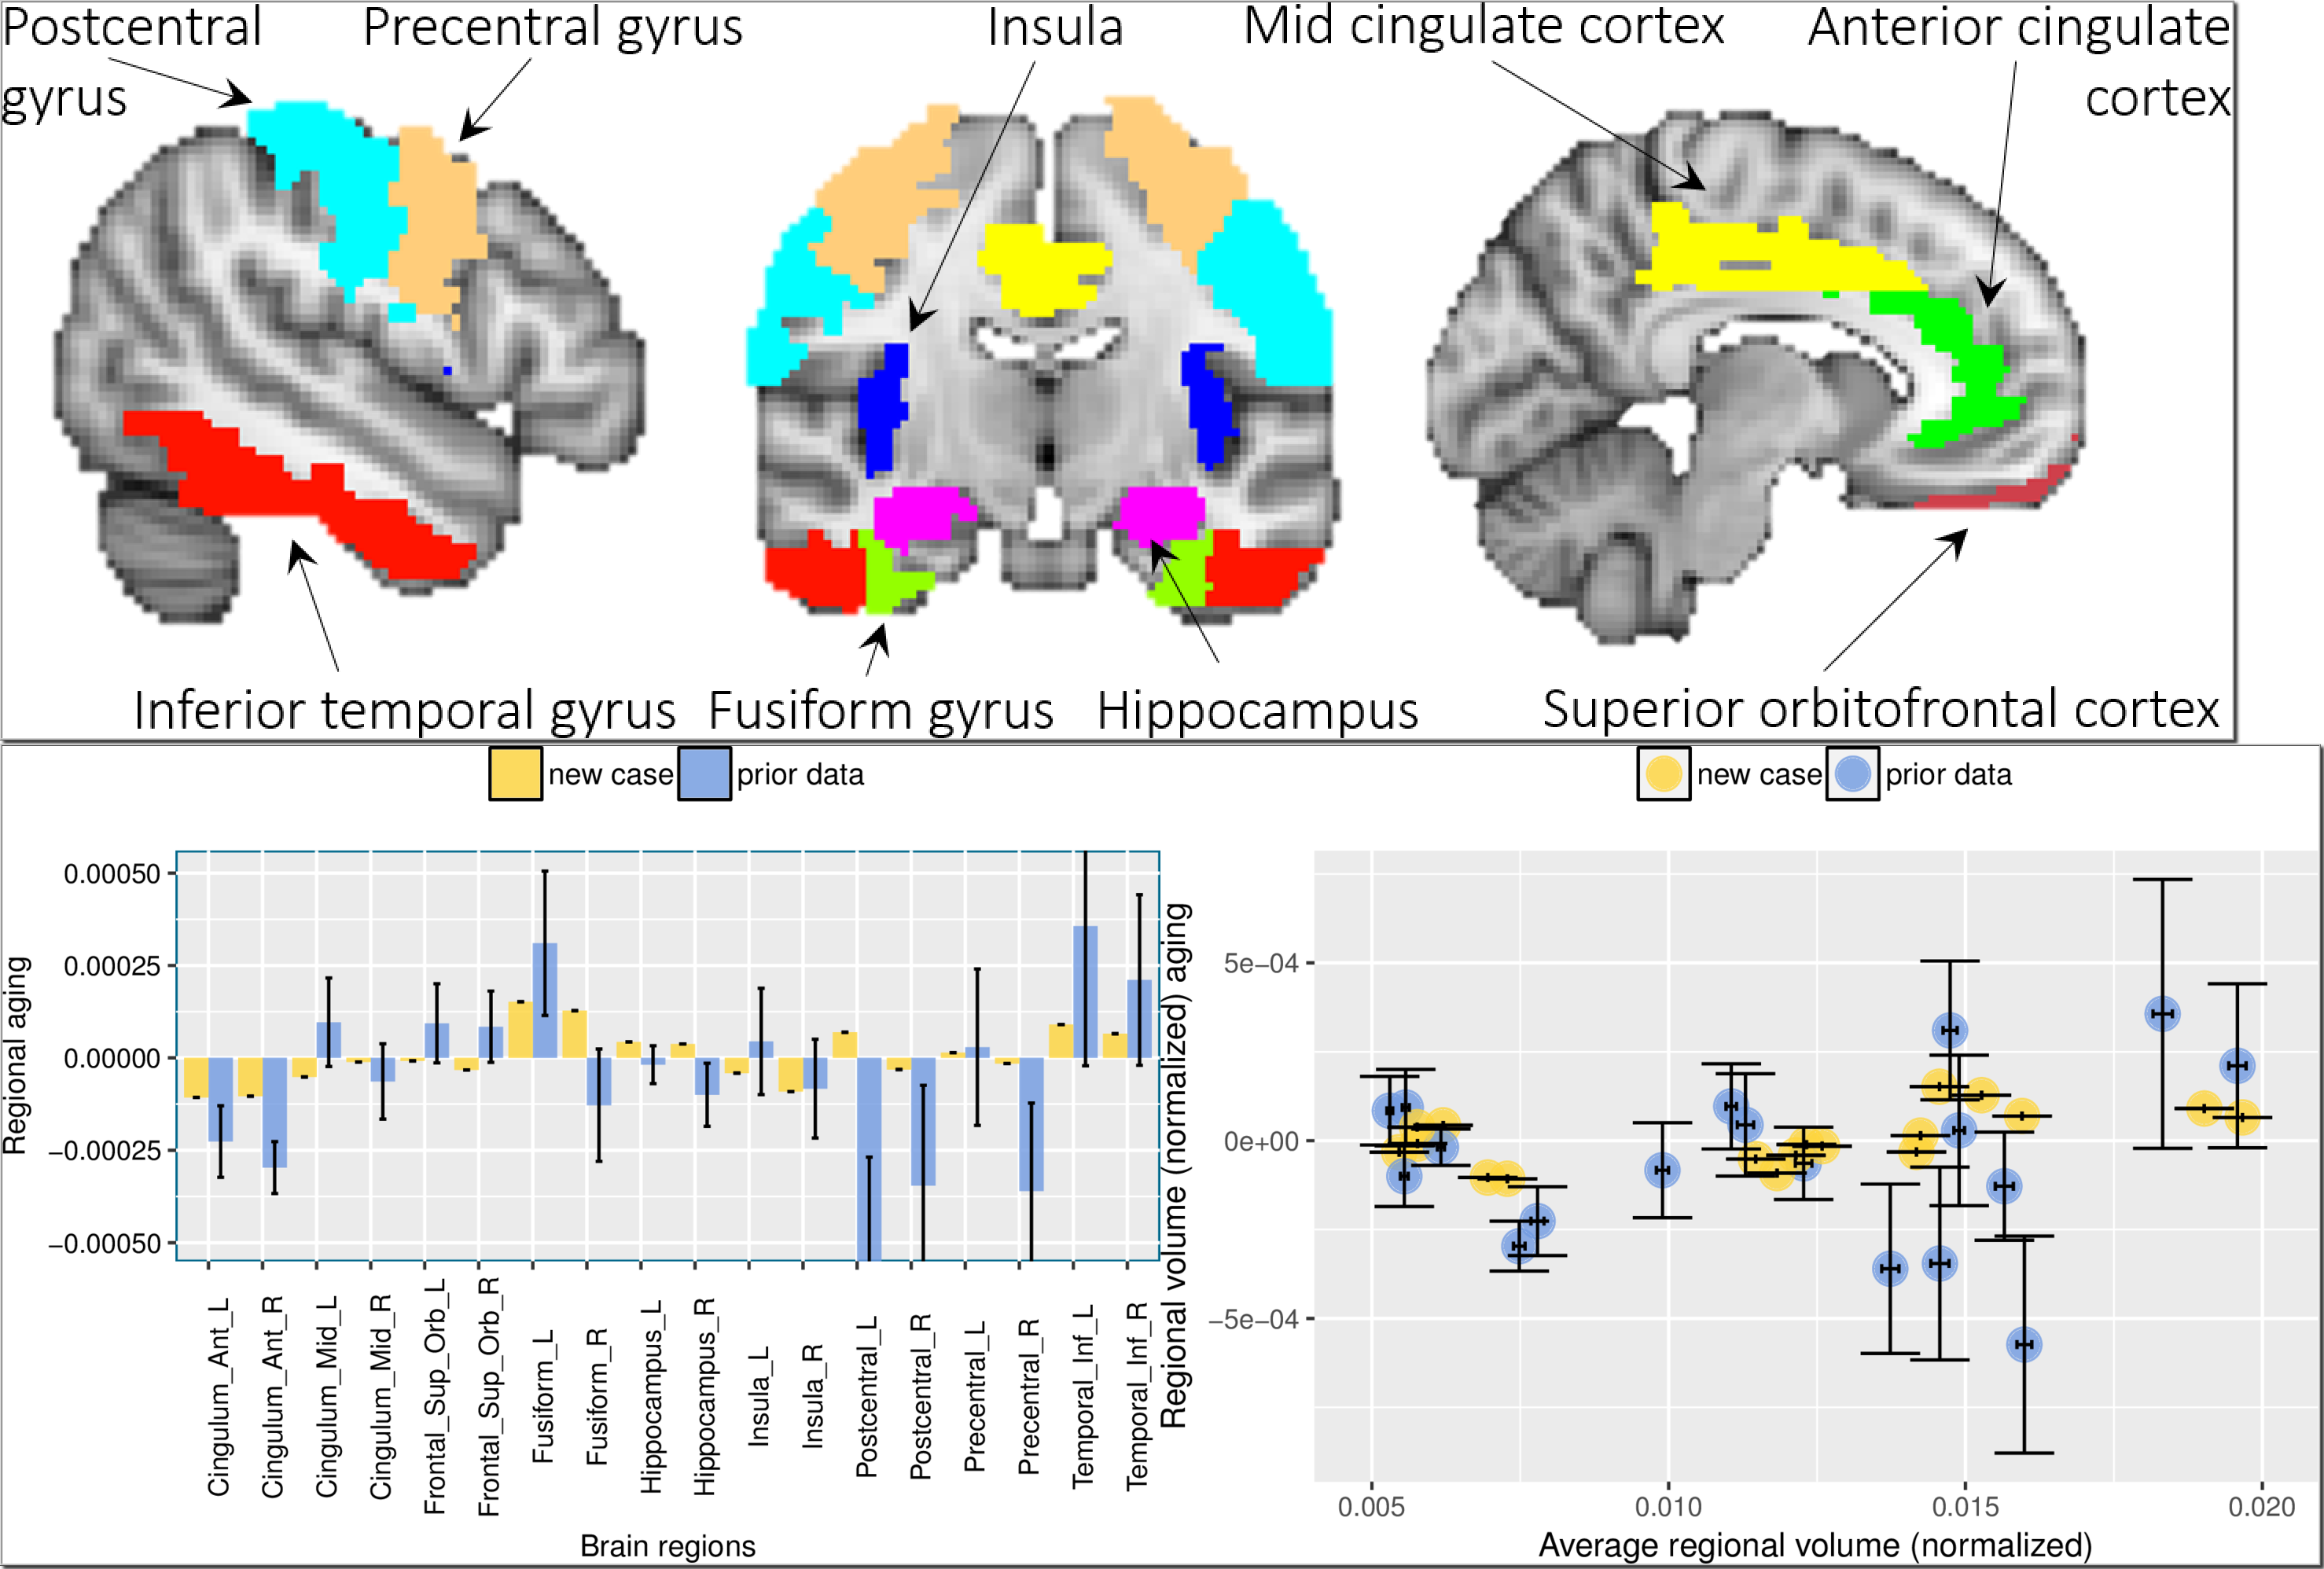
In addition to the $$$\mathtt{BrainAGE}$$$ analysis, we visualized the MRI case in the space spanned by a constant $$$(\frac{\partial\mathtt{vol}}{\partial\mathtt{age}}=0)$$$ and linear model $$$(\frac{\partial\mathtt{vol}}{\partial\mathtt{age}}=\beta)$$$ of changes in volumes of the regions implicated in mindfulness studies. Top: Regions of interest (ROIs) implicated in meditation studies. We extract both these both on the left and right hemispheres giving us a total of 18 ROIs. Bottom: (Left) The magnitudes of regional aging $$$(\beta)$$$ for each of the regions and (Right) sample mean and standard deviations of the prior data and the case study are shown in the space spanned by the constant and linear model of volumetric aging.