2736
Breast MRI Tissue Classification and Partial Volume Estimation using Different Methods: Evaluation on T1, T2 and PD-weighted TSE Images1Centre for Biomedical Engineering, Indian Institute of Technology Delhi, New Delhi, India, 2C-DOT India, New Delhi, India, 3Computer Science and Engineering, Indian Institute of Technology Delhi, New Delhi, India, 4Department of Radiology and Imaging, Fortis Memorial Research Institute, Gurgaon, India, New Delhi, India, 5Department of Biomedical Engineering, All India Institute of Medical Sciences Delhi, New Delhi, India
Synopsis
Partial volume effect(PVE) is caused by the insufficient spatial resolution of MRI images. Boundaries of different tissue-types are considered as partial volume(PV) prone area where each voxel can be mixture more than one tissue-type. PVE can introduce errors in inner segmentation and Breast density estimation. In this study we have identified PV voxels and estimated the proportion of each tissue-type within a PV voxel using fat and nonfat saturated MRI data. Experimental results revealed that difference method (difference between nonfat and fat saturated images) can provide similar tissue classification and estimation accuracy as compared to existing methods.
Introduction:
The partial volume effect(PVE) in Breast MRI appears when more than one type of tissue occupies one voxel in an image due to the finite spatial resolution of the imaging device. These voxels are usually termed as mixels. Several methods have been proposed for partial volume estimation in literature1-2. In case of breast MRI, PVE leads to errors in inner segmentation of lesion due to mixels and false epidemiological and parenchymal studies(morphological distribution pattern of the fibro-glandular tissue) due to wrong breast density estimation. Previous studies1,3 have shown that ignoring partial volume(PV) estimation can lead to density measurement error upto 20-60%4. The objective of this study was to investigate a simple method which used difference image using with and without fat suppression for PV estimation in PVE prone areas of the Breast. We compared this approach with different existing method and also calculated fractional contribution of different tissues on mixels.Methods:
All MRI experiments were performed at 3T whole-body Ingenia MRI system (Philips Healthcare, The Netherlands) using a 7 channel biopsy compatible breast coil. In this study, we have included seven patients.
MRI Data acquisition: After a localizer, T1, T2 and PD weighted (W) images, with and without fat saturation were acquired using turbo spin echo pulse sequence. Fat saturation was based upon DIXON method5. Multiple slices, covering entire breast tissue with slice thickness of 3mm were acquired for all three data types. FOV=338*338mm2 and matrix size=452×338(interpolated matrix 512×512) were used. For PD ,T2,T1-W, TR/TE=2974/30ms , TR/TE=2974/100ms and TR/TE=603/10ms were used respectively. T1-perfusion MRI was performed using a 3-dimensional-fast-field-echo(3D-FFE) sequence (TR/TE=3.0ms/1.5ms,flip angle=12o,FOV=338×338mm2, slice-thickness=3mm,matrix-size=228×226 (interpolated-matrix 512*512) and acquisition-time 3.7 minute).
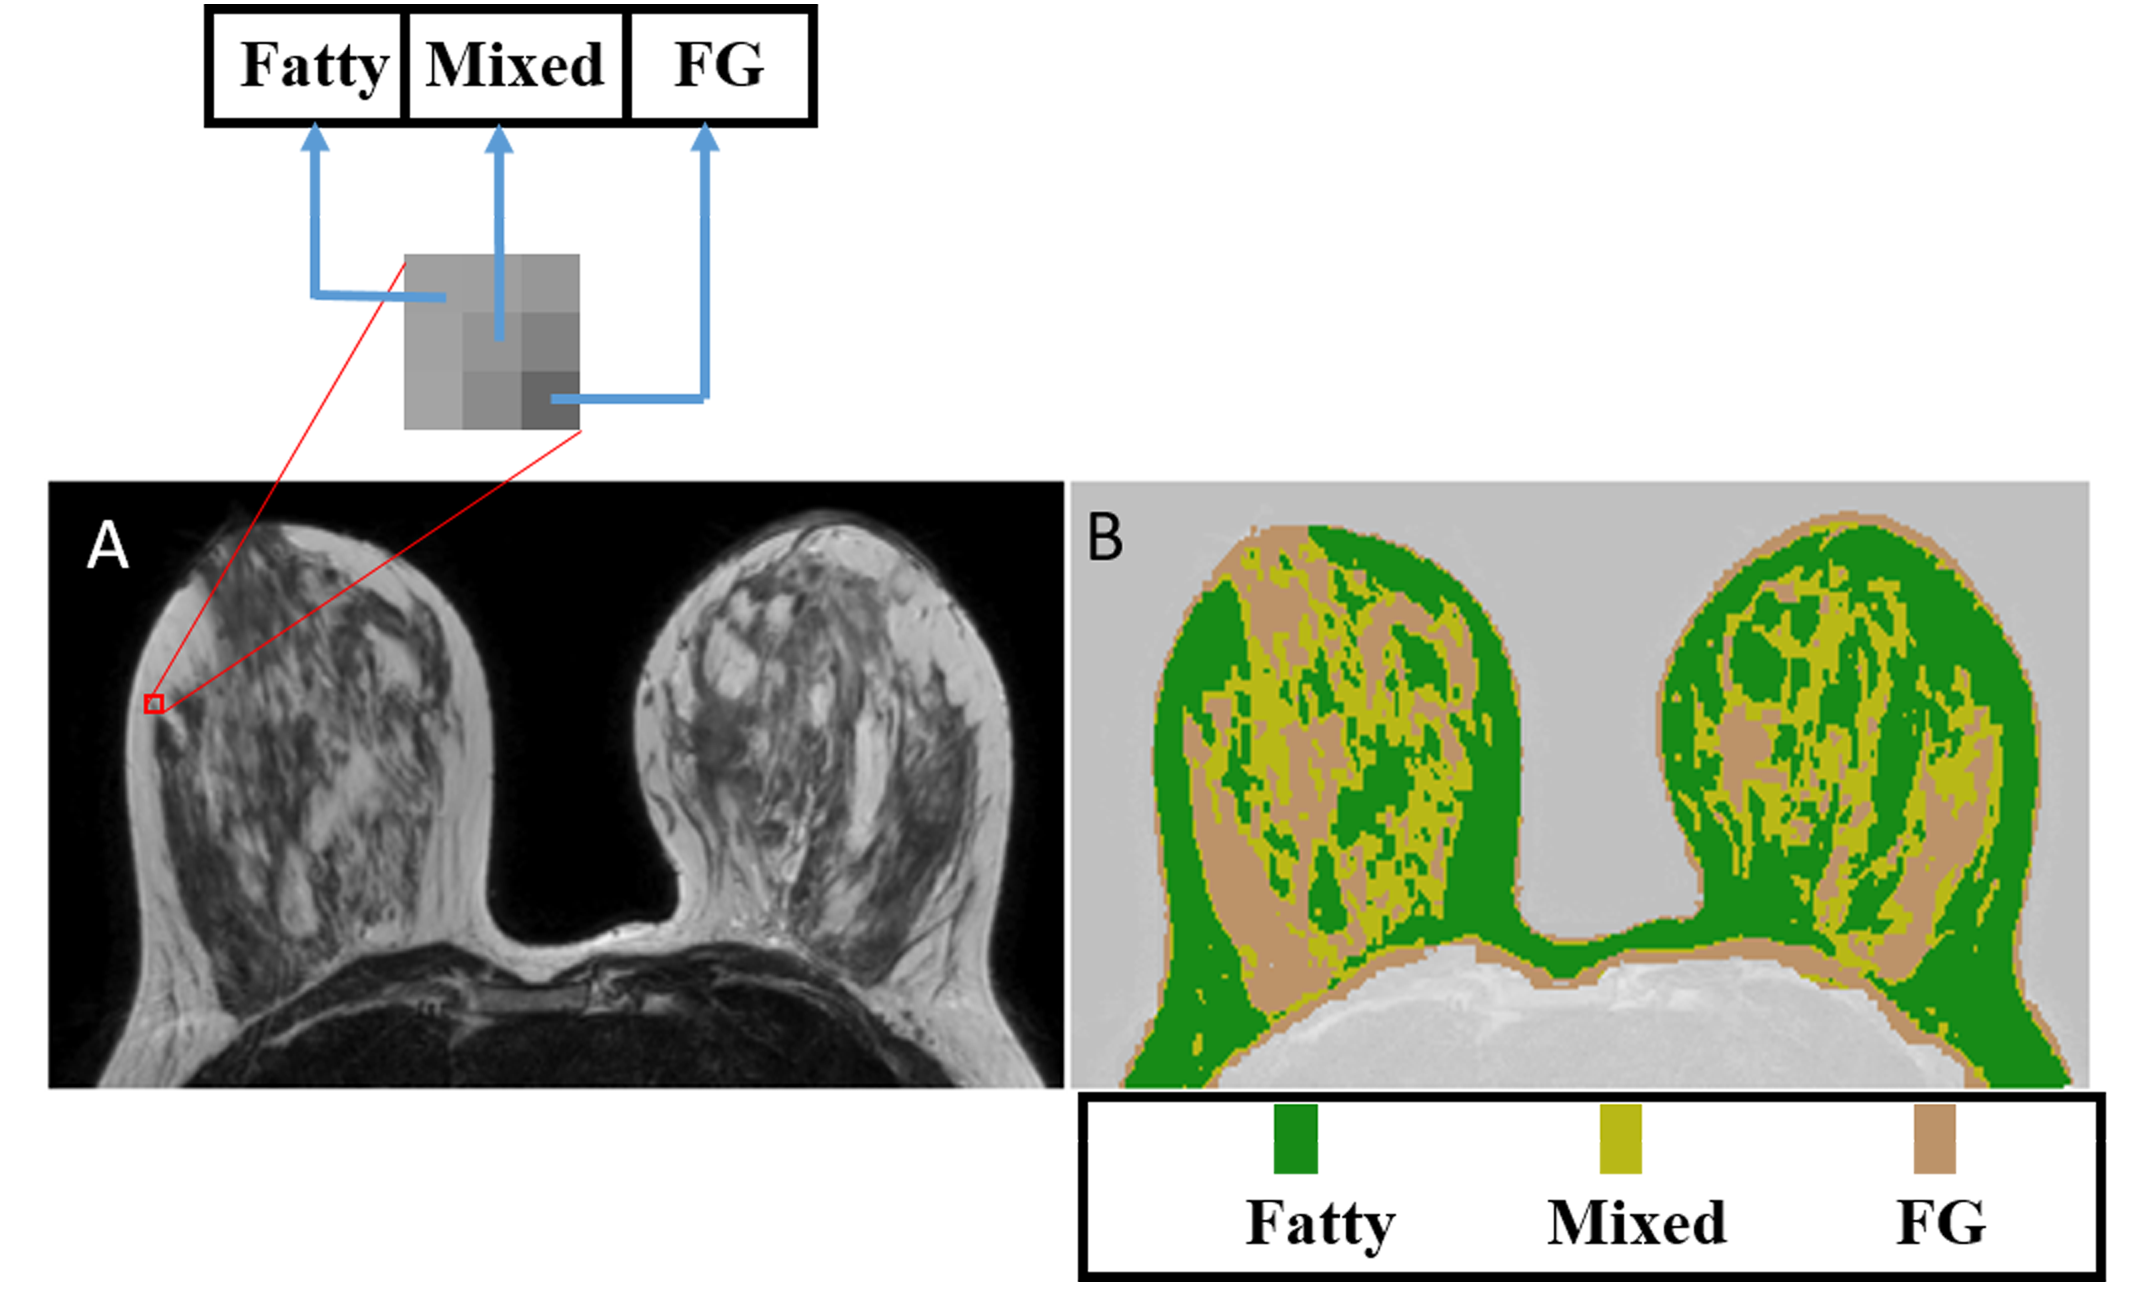
Data Processing: Outer segmentation(OS) of breast image was carried out to remove unwanted tissues. After OS, there were primarily three types of tissues such as fatty tissue, Fibro-glandular(FG) tissue, and skin tissue. We used hessian based method to remove skin part to reduce the complexity of the analysis6. The difference between these two breast images(NFS - FS) and FS image provides crude estimation of fatty and FG tissue contribution on any voxel respectively. This initial estimation from difference and FS images along with mean±standard deviation guesstimate of different tissues on non-fat images(obtained using Otsu's method7) were used to classify FG, fatty and mixel tissues. After PV classification, PV estimation was measured using mixel model2,7.We compared accuracy of different methods8-12 such as Normal mixture model(NMM) fitted by the Expectation-Maximization(EM) algorithm(NMM-EM), Hidden Markov Normal mixture model fitted(HMNMM) using Iterated Conditional Mode(ICM) algorithm(HMNMM-ICM), Hidden Markov random field (HMRF) with EM(HMRF-EM), Partial volume HMRF with EM(PVHMRF-EM) and Bayesian methods on the same T2-W NFS image with difference image using with and without fat suppression(DIWWFS). All these methods were also evaluated on T1 and PD-W images.
Results:
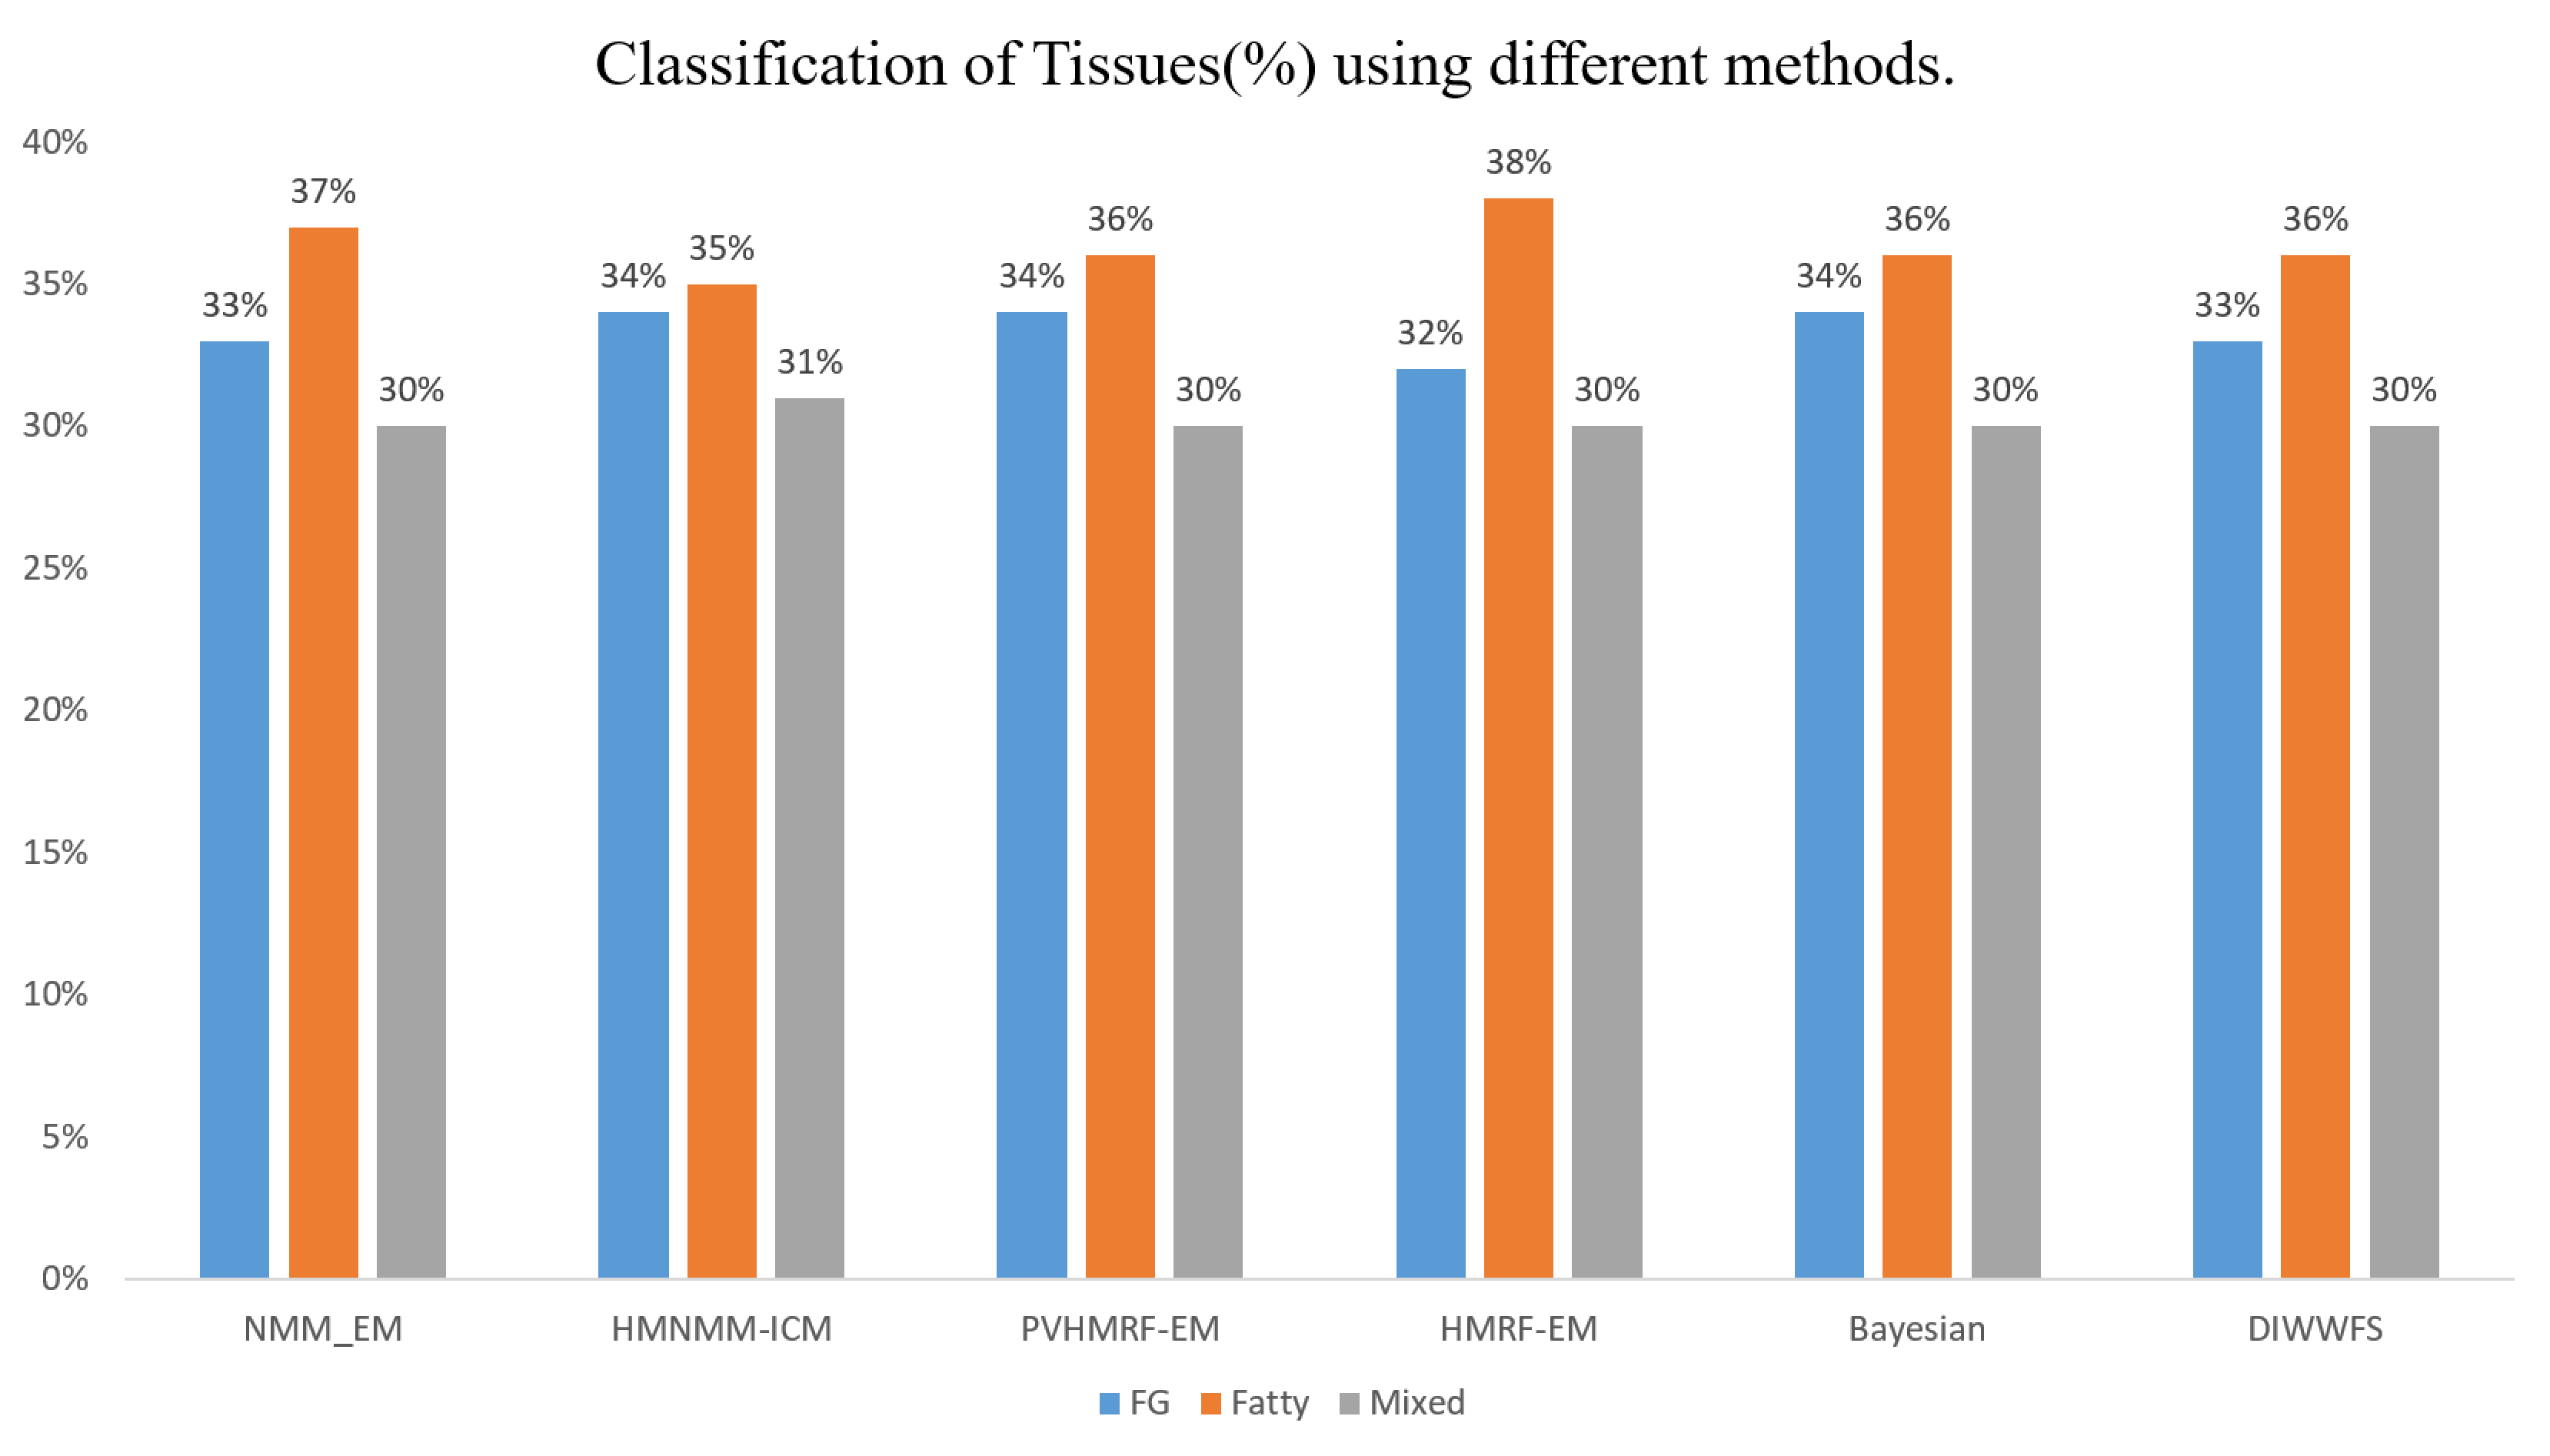
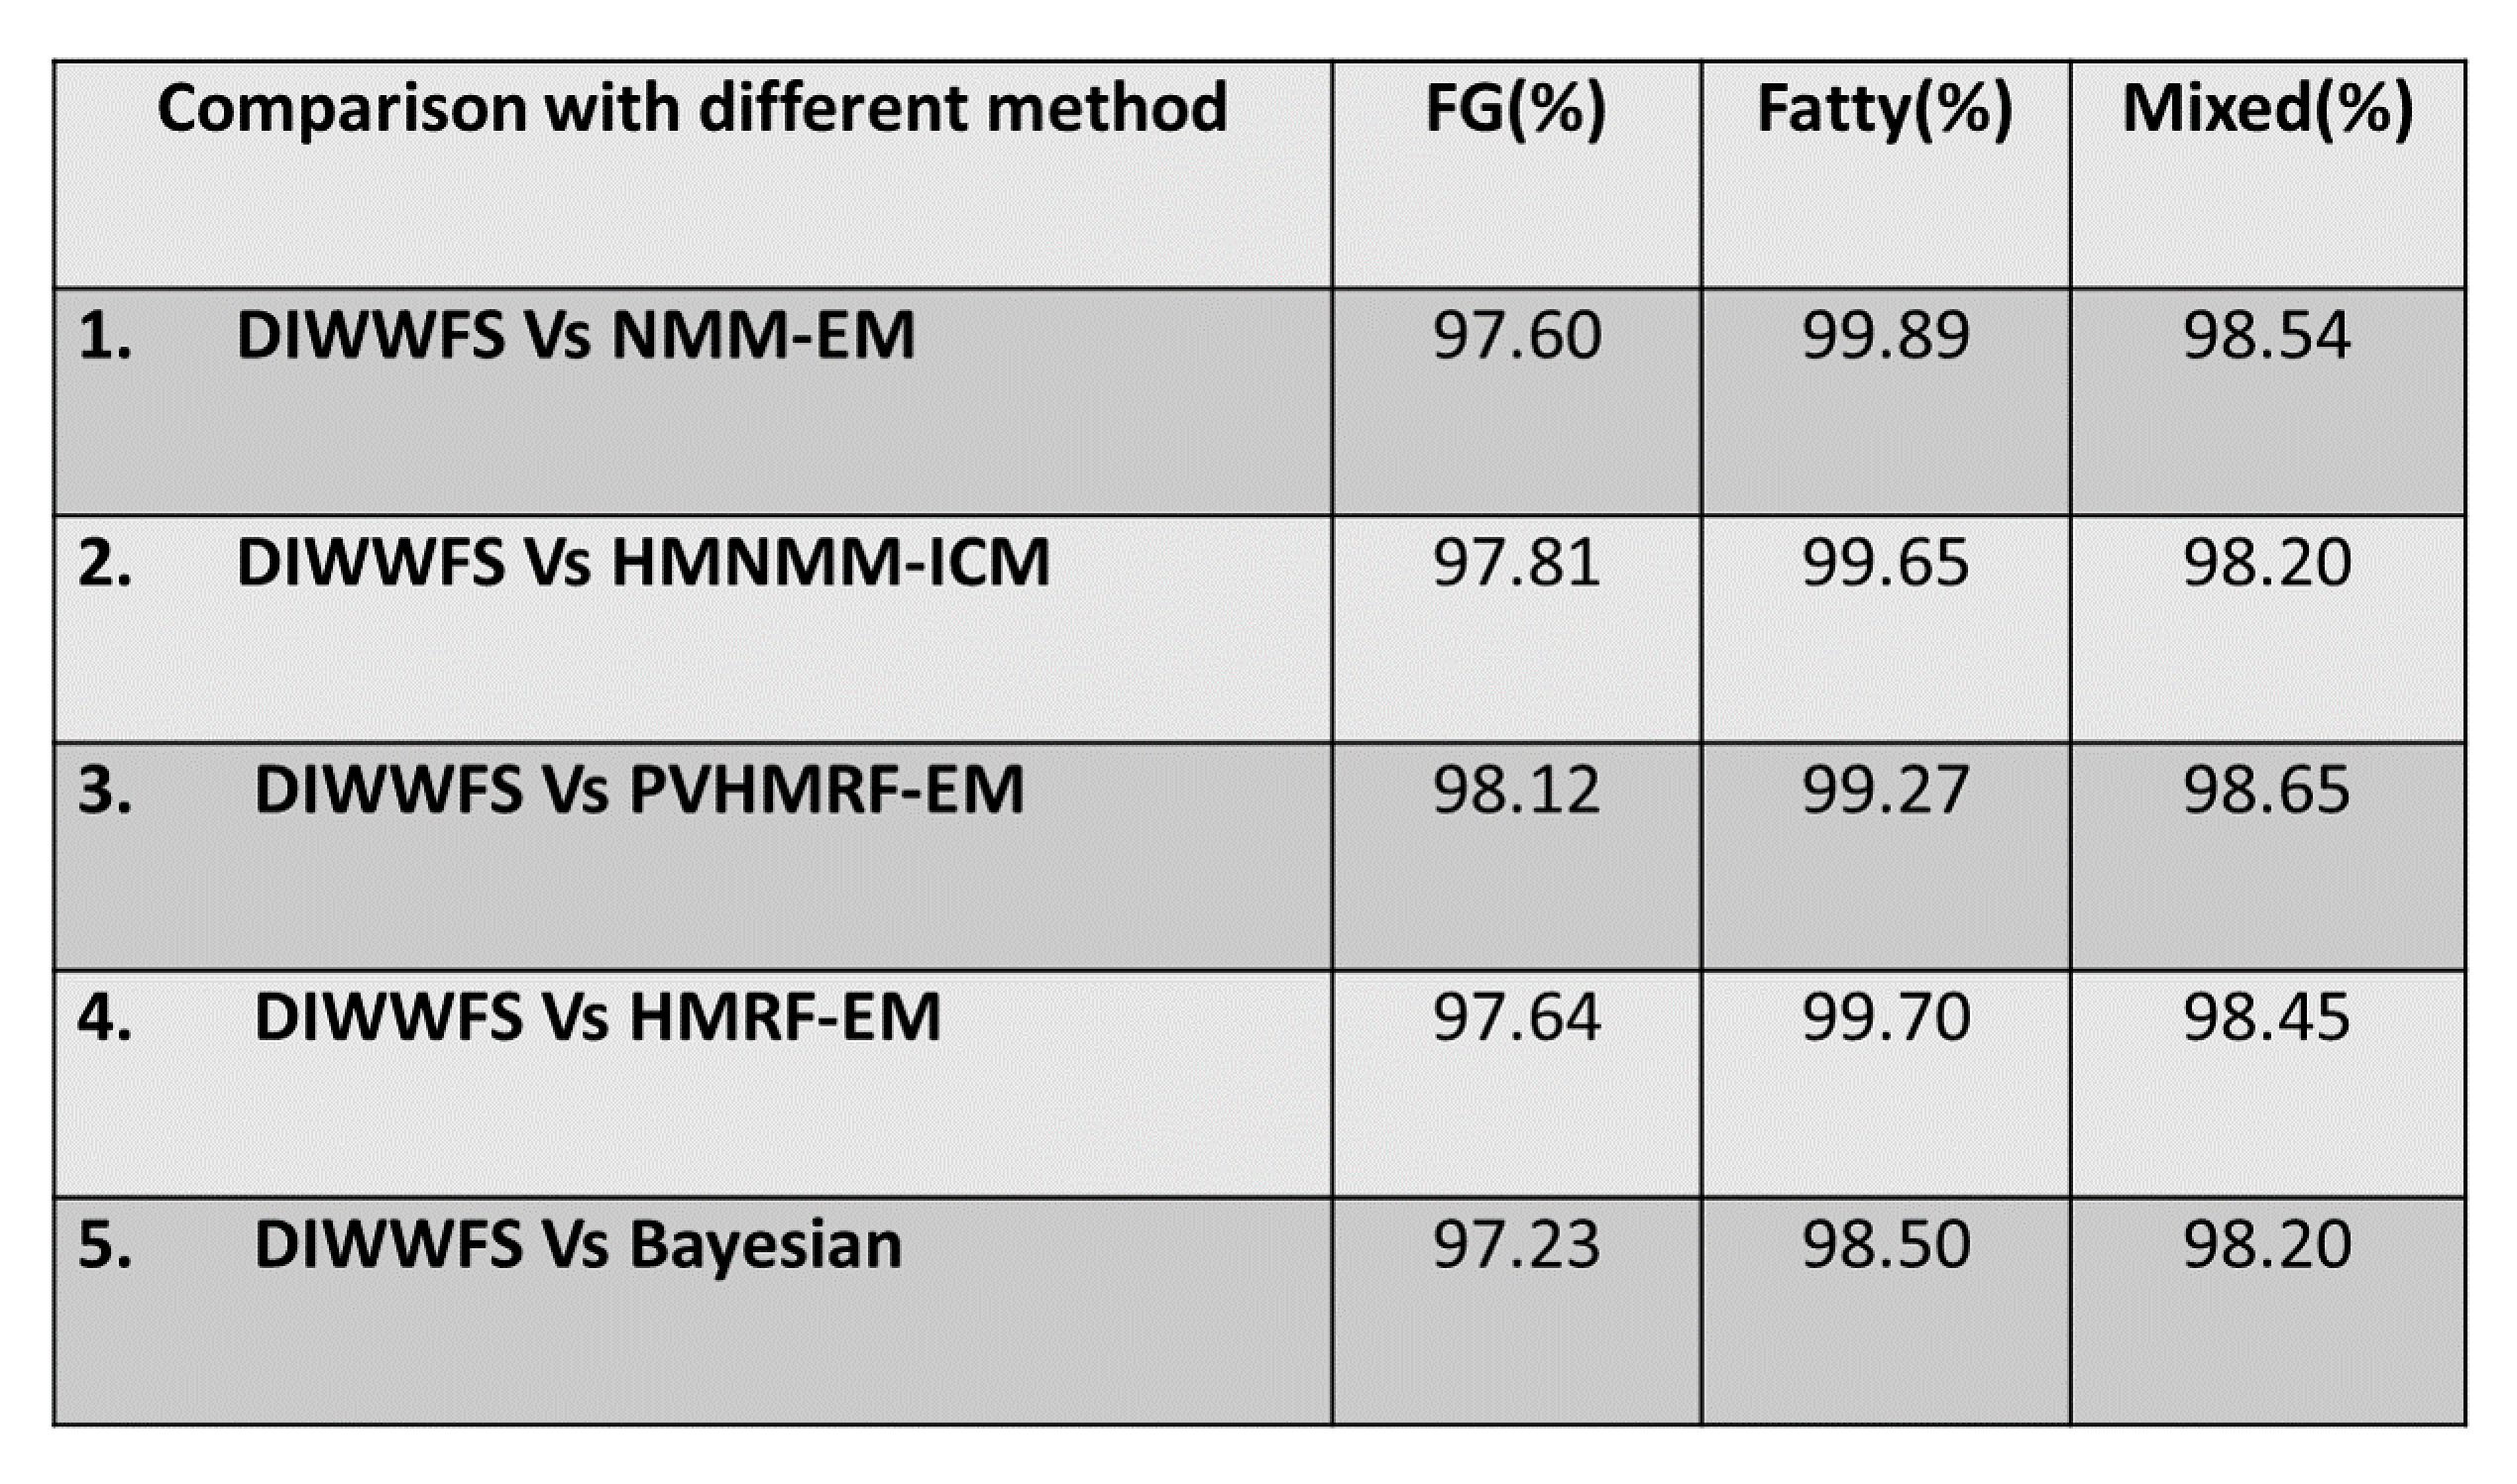
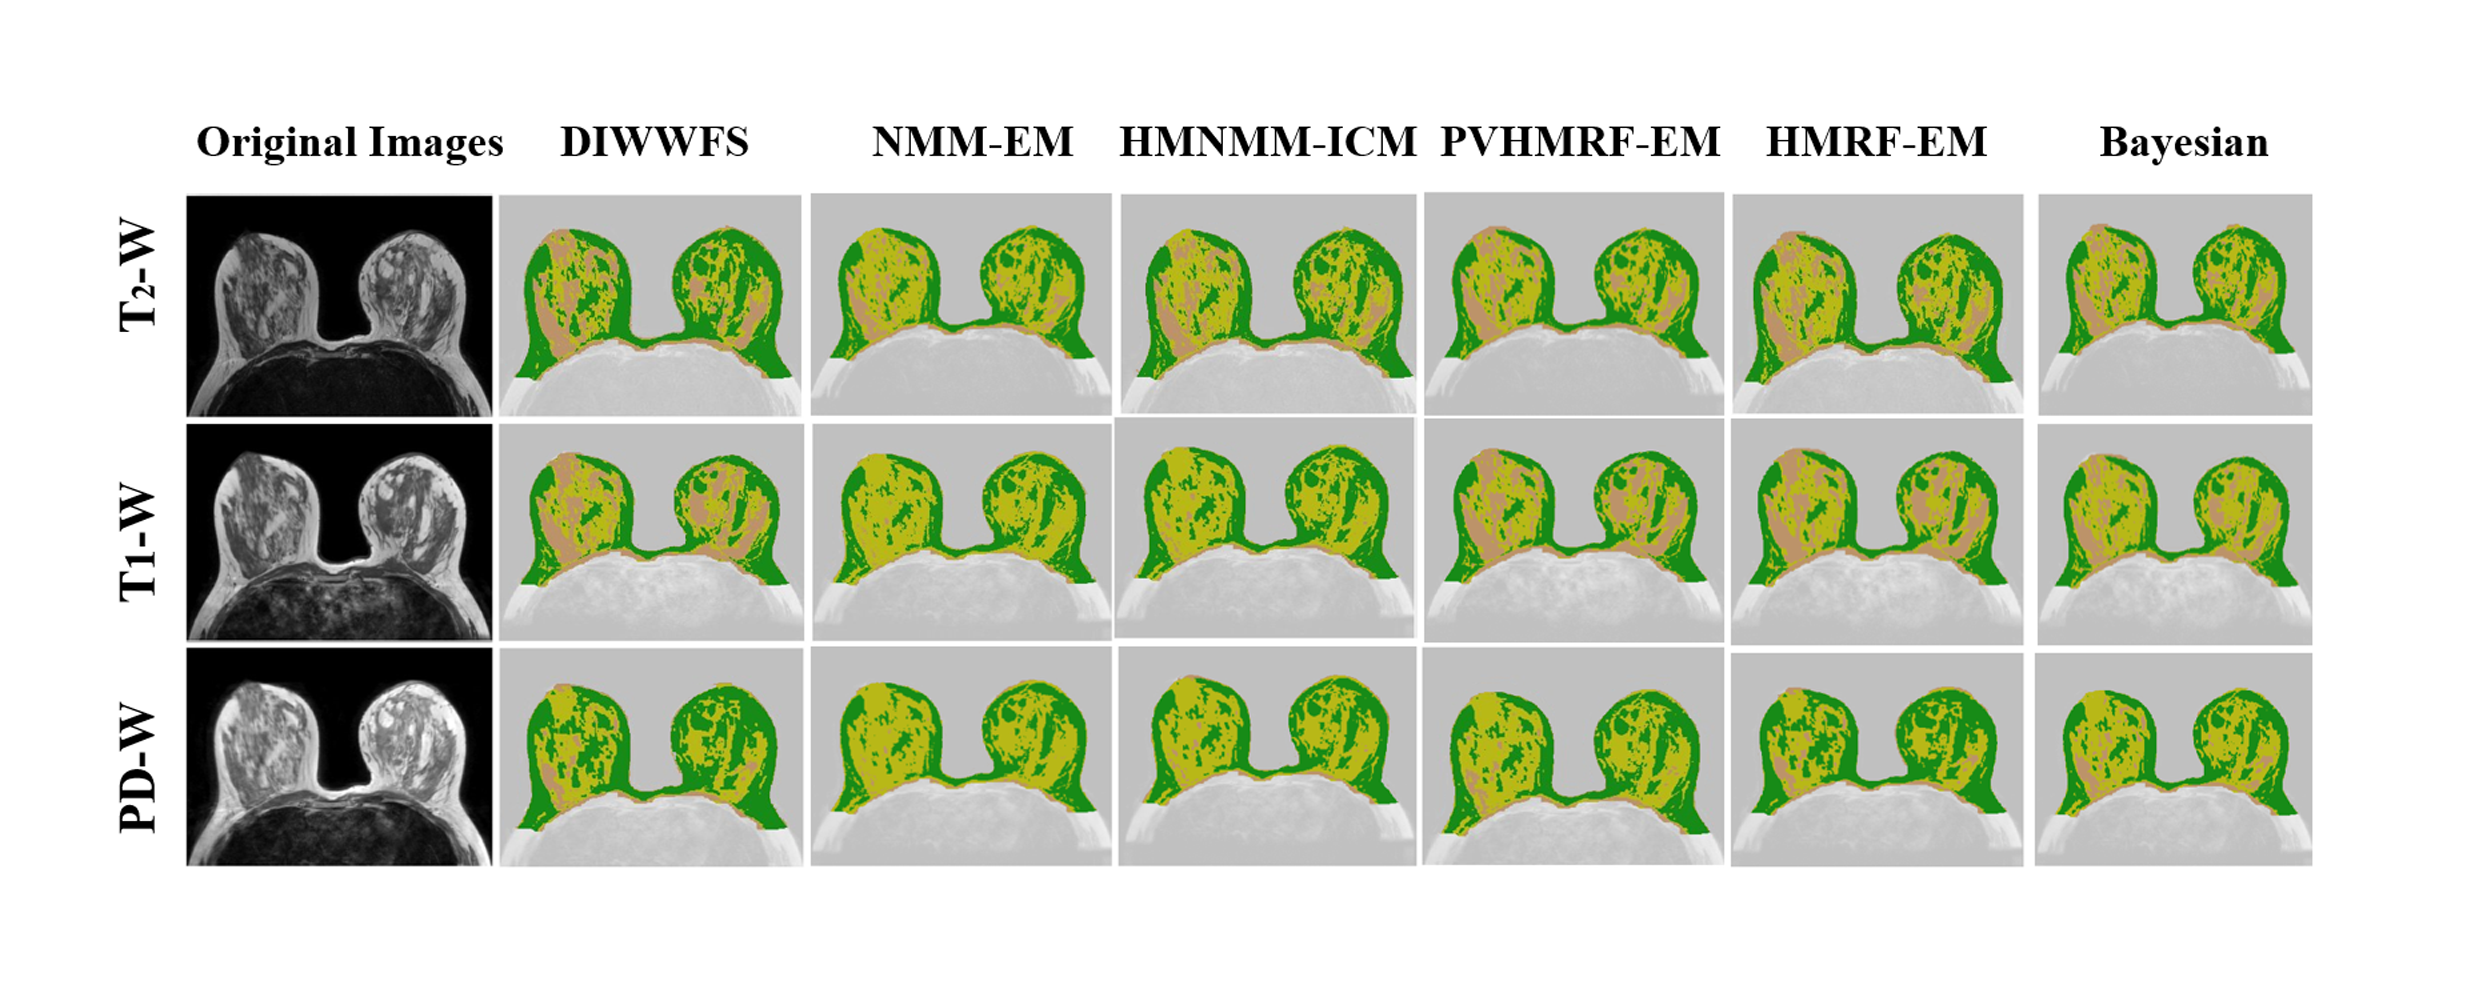
Figure 1(B) shows tissue classification (FG, Fatty and Mixed) using DIWWFS on T2-W images. Figure(2) shows the percentage of pure Fatty, FG and mixed tissue obtained by various methods on a healthy patient subject Breast data. Difference method has almost similar classification accuracy like other existing methods. In comparison with different methods, DIWWFS has maximum of 1%,3% and 2% classification difference for FG, mixture and Fat tissue respectively. True positive percentage between DIWWFS and other methods was evaluated as shown in Table I. DIWWFS,PVHMRF-EM,HMRF-EM provided similar and satisfactory results in tissue classification on T1 and T2-W images as shown in Figure(3).Discussion:
The difference images of NFS and FS may eliminate the biases due to partial volume effect to some extent. This method uses two MRI images which can provide more information about different tissues. This method has lesser complexity and similar results as compared to PVHMRF-EM which provided better tissue classification among all methods10. Partial volume correction can improve accuracy of inner segmentation as well as breast density estimation13. The assumption was that fat-suppression in FS images was correct. If fat is not accurately suppressed, then baseline correction is required. These are preliminary results with small number of patients. More data sets should be investigated in future studies.Conclusions:
The difference images of FS and NFS method is simple and robust. It can be used as an alternative approach with same accuracy of PVHMRF-EM for tissue classification and partial volume estimation. In future, Fuzzy C means can be used with difference image for more accurate tissue classifications.Acknowledgements
The authors acknowledge an internal grant from IIT-Delhi and technical support of Philips India Limited in MRI data acquisition. We thanks, Dr. Indrajit Saha for providing technical support for MRI data acquisition; Dr. Priti Jain and Dr. Pradeep Kumar Gupta for data handling and providing biopsy reports and Dr. Meenakshi Singhal for clinical input.References
1. Gage et. al Quantification of brain tissue through incorporation of partial volume effects(1992).
2. H.S.Choi et.al Partial volume tissue classification of multichannel magnetic resonance images-A mixel model (1991).
3. J. Besag et. al On the statistical analysis of dirty pictures (1991).
4. Ballester et. al Segmentation and measurement of brain structures in MRI including condence bounds (2000).
5.Dixon W. Simple proton spectroscopic imaging. Radiology (1984).
6. Lei wang et. al Fully Automated Segmentation of the Pectoralis Muscle Boundary in Breast MR Images(2011).
7. Ping-sung Liao et.al A Fast Algorithm for Multilevel Thresholding (2001).
8. Dai Feng et. al An unified Bayesian hierarchical model for MRI tissue classification Statistics(2014).
9. Dai Feng et. al MRI tissue classification using high resolution Bayesian hidden Markov normal mixture models (2009).
10. Dai Feng et. al mritc: A package for MRI tissue classification Journal of Statistical Software(2011).
11. Dai Feng et. al Bayesian hidden Markov normal mixture models with application to MRI tissue classification. (2009).
12. Yongyue Zhang, Michael Brady, and Stephen Smith Segmentation of brain MR images through a hidden Markov random field model and the expectation-maximization algorithm (2001).
13. Cuadra MB et. al Comparison and Validation of Tissue Modelization and Statistical Classification Methods in T1-Weighted MR Brain Images(2005).
Figures